Dividend Growth
Realty Income (O): Price Growth vs Dividend Growth, 2016–2025
Explore Realty Income (O) price growth vs dividend growth from 2016 to 2025. Compare a 1.9% share price decline with 34.0% dividend growth and rising yield on cost.
Published November 5, 2026 · Updated November 5, 2026
Realty Income · O · Dividend Growth · Price vs Income · Yield on Cost
Hover or focus a year for details. Click or tap to pin. Press Escape to clear.
Introduction
How can dividend income keep growing while a stock's share price finishes a decade nearly unchanged? This interactive visualization compares Realty Income Corporation (O) share price performance with annual dividends per share from 2016 through 2025. Both series start at an index value of 100, making it easier to see how price growth and dividend growth developed independently. The comparison highlights the difference between changes in market value and changes in cash income, without assuming dividend reinvestment.
Key insights
Dividend Growth Outpaced Share Price Growth
Between 2016 and 2025, Realty Income's annual dividends per share increased by 34.0%, while its year-end share price declined by 1.9%. The indexed series finished at 134 for dividends and 98 for price. This divergence illustrates how dividend income can grow even when the share price delivers little long-term appreciation.
Share Prices Fluctuated While Annual Dividends Increased
Realty Income's year-end share price reached $73.63 in 2019, compared with $57.48 in the 2016 baseline year. By the end of 2024, it had fallen to $53.41 before recovering to $56.37 in 2025. Annual dividends per share followed a different pattern, increasing every year in the supplied data, from $2.401 in 2016 to $3.217 in 2025. The contrast is particularly visible after 2021, when the price index declined while the dividend index continued rising.
Yield on Cost Rose From 4.2% to 5.6%
Using the 2016 year-end share price as a fixed cost basis, Realty Income's annual yield on cost increased from 4.2% in 2016 to 5.6% in 2025. This improvement reflects higher annual dividends per share relative to the original baseline price, rather than changes in the stock's current market yield. The result demonstrates how growing dividends can increase income relative to a fixed historical purchase price.
Dividend Growth Was Gradual Rather Than Explosive
Realty Income recorded a dividend CAGR of 3.3% over the 2016–2025 comparison period. The annual dividend index increased from 100 in 2016 to 117 in 2020, 124 in 2022, and 134 in 2025. Rather than depending on a single large increase, the historical income progression reflects a series of smaller annual gains. These historical increases do not establish how quickly dividends will grow in the future.
Price Appreciation Alone Misses the Income Story
By the end of 2025, Realty Income's share price remained slightly below its 2016 year-end level, despite higher annual dividend payments. For investors evaluating dividend-paying securities, the practical takeaway is that share price growth and dividend income growth measure different outcomes. Examining both reveals how the investment's market value and income-producing characteristics evolved across the same period. Neither series alone represents the investment's total return.
Methodology
This Price & Income Growth visualization compares Realty Income Corporation (O) year-end share prices and annual dividends paid per share from 2016 through 2025. Both series are indexed to 100 in the 2016 baseline year: - Price Growth: Each year's closing share price is compared with the 2016 year-end closing price. Prices are split-adjusted but not dividend-adjusted. - Dividend Growth: Each year's total dividends paid per share are compared with annual dividends per share in 2016. Dividends are grouped by payment year rather than ex-dividend date. - Dividend CAGR: The displayed 3.3% figure summarizes the annualized growth in dividends per share over the comparison period. - Yield on Cost: Annual dividends per share are divided by the 2016 year-end share price of $57.48, maintaining a fixed historical cost basis throughout the comparison. This is not the current dividend yield. Dividends are treated as cash income and are not reinvested. The price series excludes dividend adjustments, so the visualization is not a total-return comparison and does not measure the compounded performance of a dividend-reinvestment strategy. All figures are historical and do not imply future price appreciation or dividend growth.
Source: Year-end closing prices from Digrin and Stock Analysis. Annual dividends paid per share from Realty Income reports and historical dividend data.
Data as of: November 5, 2026
Explore Your Own Dividend Portfolio
Go beyond historical dividend charts. Track your dividend income, yield on cost, and allocation targets in one dashboard.
Free for up to 15 stocks. No credit card required.
Related links
Keep Exploring
 Dividend Growth
MAIN vs ARCC vs HTGC vs CSWC vs TSLX – 10 Years of Dividend Income Growth
Compare 10 years of dividend income growth for MAIN, ARCC, HTGC, CSWC and TSLX using historical yield on cost from 2016 to 2025.
BDC · Dividend Growth · Yield on Cost · Dividend Income…
Nov 1, 2026
 Dividend Growth
Dividend Kings: 9 Years of Dividend Growth Compared
Compare 11 Dividend Kings from 2016–2025. Explore annual dividend growth patterns, starting yields, and how dividend increases shaped long-term yield on cost.
Dividend Kings · Dividend Growth · Yield on Cost · Dividend Investing…
Oct 24, 2026
 Dividend Growth
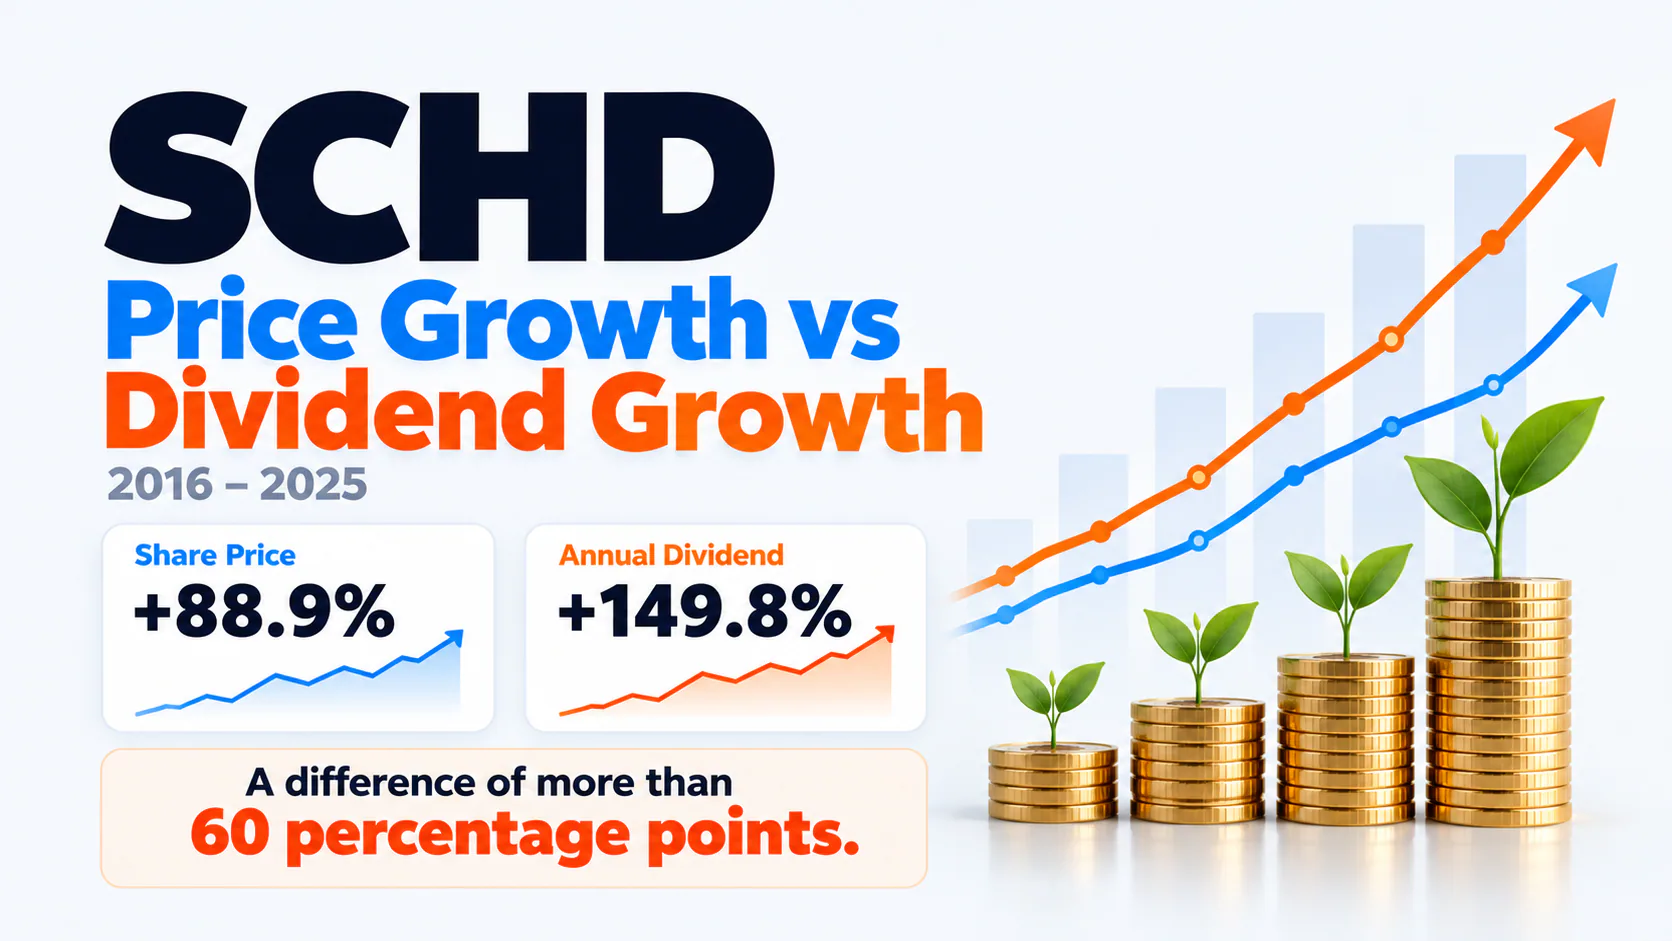
SCHD: Price Growth vs Dividend Growth (2016–2025)
SCHD's share price grew 88.9% from 2016–2025, while annual dividends per share rose 149.8%. Explore dividend growth, yield on cost, and historical trends.
SCHD · Dividend Growth · Yield on Cost · Price Growth…
Oct 19, 2026
Explore Our Free Tools
Dividend Calculator
Project how your dividend income and portfolio could grow over time.
Open Calculator →Dividend Snowball Calculator
See how dividend growth and reinvestment can compound over time.
Explore the Snowball →Dividend Income Goal Calculator
Compare how much you'd need to invest in different stocks or ETFs to reach a dividend income goal.
Calculate an Income Goal →Dividend Yield Sandbox
Build a hypothetical dividend portfolio and see the income it could generate.
Open the Sandbox →Ticker Battles
Compare dividend stocks and ETFs head-to-head.
Start a Ticker Battle →
Enjoyed this analysis? Get the next one.
New dividend investing comparisons, charts, and research delivered to your inbox.