Dividend Growth
SCHD: Price Growth vs Dividend Growth (2016–2025)
SCHD's share price grew 88.9% from 2016–2025, while annual dividends per share rose 149.8%. Explore dividend growth, yield on cost, and historical trends.
Published October 19, 2026 · Updated October 19, 2026
SCHD · Dividend Growth · Yield on Cost · Price Growth · Dividend ETFs
Hover or focus a year for details. Click or tap to pin. Press Escape to clear.
Introduction
How does SCHD's dividend growth compare with its share-price appreciation over time? This visualization examines the Schwab U.S. Dividend Equity ETF (SCHD) from 2016 through 2025, comparing year-end share prices with annual dividends per share. Both measures are indexed to 100 in 2016, making it easier to see how price appreciation and dividend income growth developed independently over nine years.
Key insights
Dividend Growth Outpaced Price Appreciation
Between 2016 and 2025, SCHD's share price increased 88.9%, while annual dividends per share grew 149.8%. The price index finished at 189, compared with 250 for dividends. This represents a difference of approximately 61 percentage points in cumulative growth. Annual dividend growth averaged 10.7% on a compounded basis over the period.
The Two Growth Trends Diverged After 2021
Through 2021, SCHD's price and dividend indexes followed broadly similar upward trends, with the price index slightly ahead at 186 versus 179. In 2022, the price index declined to 173, while the dividend index continued rising to 204. The divergence persisted through 2025, illustrating how annual dividend payments can continue growing even during periods of declining or relatively flat share prices.
Yield on Cost Increased from 2.9% to 7.2%
Using SCHD's year-end 2016 share price as a fixed reference, annual dividends per share represented approximately 2.9% of that price in the baseline year. By 2025, the same calculation reached 7.2%. This increase reflects higher annual dividend payments relative to an unchanged reference price, without assuming additional share purchases or dividend reinvestment. Yield on cost is not the same as SCHD's current dividend yield.
Price Growth and Dividend Growth Measure Different Outcomes
SCHD experienced meaningful growth in both share price and annual dividends per share, but the two measures describe different aspects of historical performance. Price appreciation reflects changes in market value, while dividend growth reflects changes in annual cash payments per share. For income-focused investors, examining both trends provides a clearer picture of how an investment's market value and income stream evolved over time.
Methodology
The visualization compares SCHD's year-end closing share prices and full-calendar-year dividends per share from 2016 through 2025. Both series are indexed to 100 in 2016. Each subsequent value represents its change relative to the corresponding baseline-year figure. The price series uses split-adjusted closing prices that are not dividend-adjusted. Historical prices are approximate month-end closes derived from rounded monthly source data. Annual dividends are measured per share, with no dividend reinvestment assumed. Dividend CAGR represents the compound annual growth rate of annual dividends per share between 2016 and 2025. Yield on cost is calculated by dividing each year's annual dividends per share by the fixed December 2016 year-end share price. The starting yield uses full-year 2016 dividends, which predate that hypothetical purchase date. All historical figures reflect SCHD's October 2024 3-for-1 stock split. This is not a total-return comparison. Dividends received, reinvestment, taxes, and inflation are excluded. Historical dividend growth does not guarantee future increases. The key takeaway is that SCHD's annual dividends per share grew substantially faster than its share price over the period examined.
Source: Schwab Asset Management (distributions) and Digrin (historical prices).
Data as of: October 19, 2026
Related links
Keep Exploring
 ETF Comparison
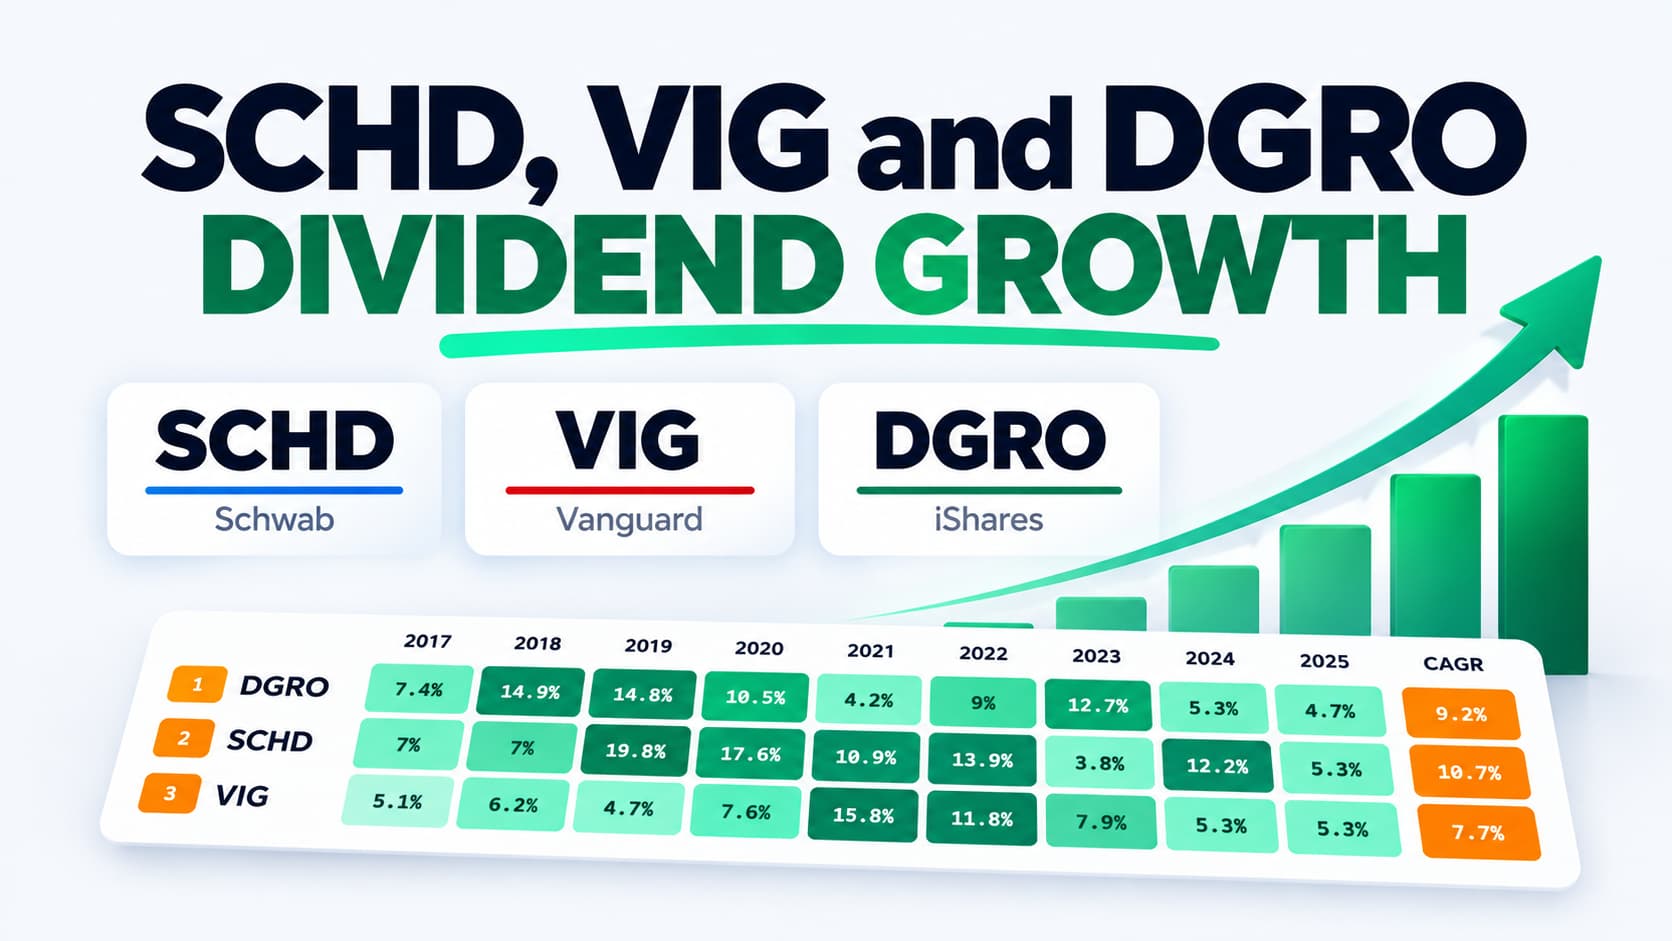
SCHD vs VIG vs DGRO: Dividend Growth
Compare annual dividend growth for SCHD, VIG, and DGRO from 2017–2025 and see how their year-to-year growth patterns differed.
SCHD · VIG · DGRO
Sep 30, 2026
 ETF Comparison
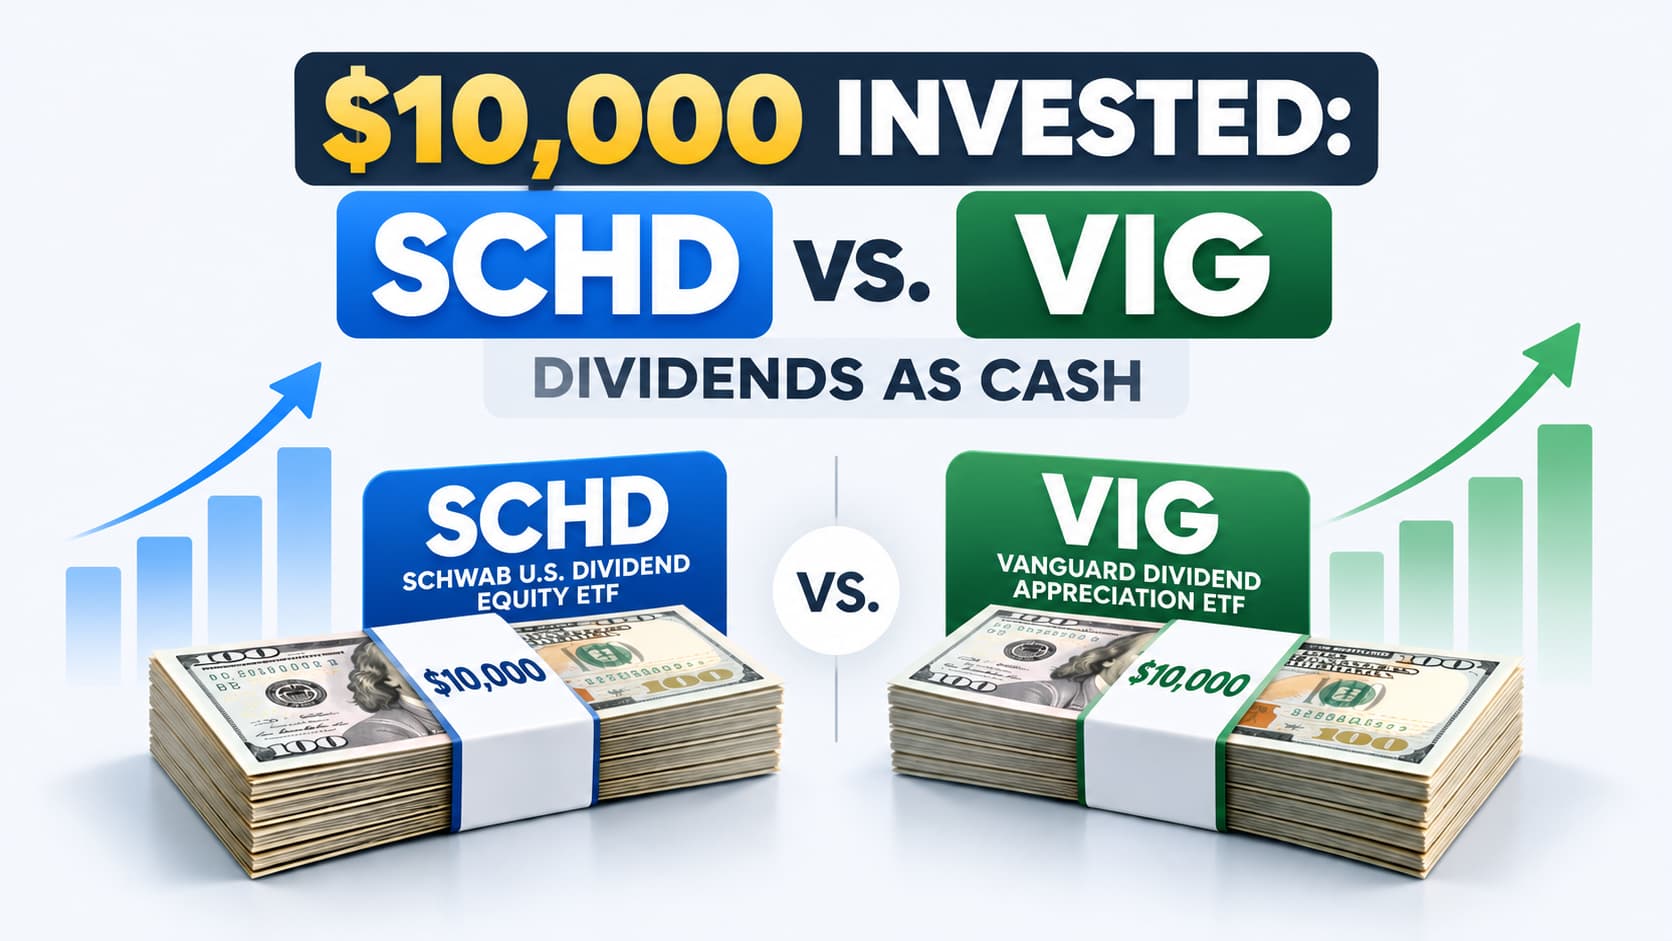
SCHD vs VIG: $10,000 Dividend Income Growth From 2018–2025
See how $10,000 invested in SCHD and VIG developed into different annual cash-income streams from 2018 through 2025, with dividends taken as cash.
SCHD · VIG · dividend growth
Sep 27, 2026
 ETF Comparison
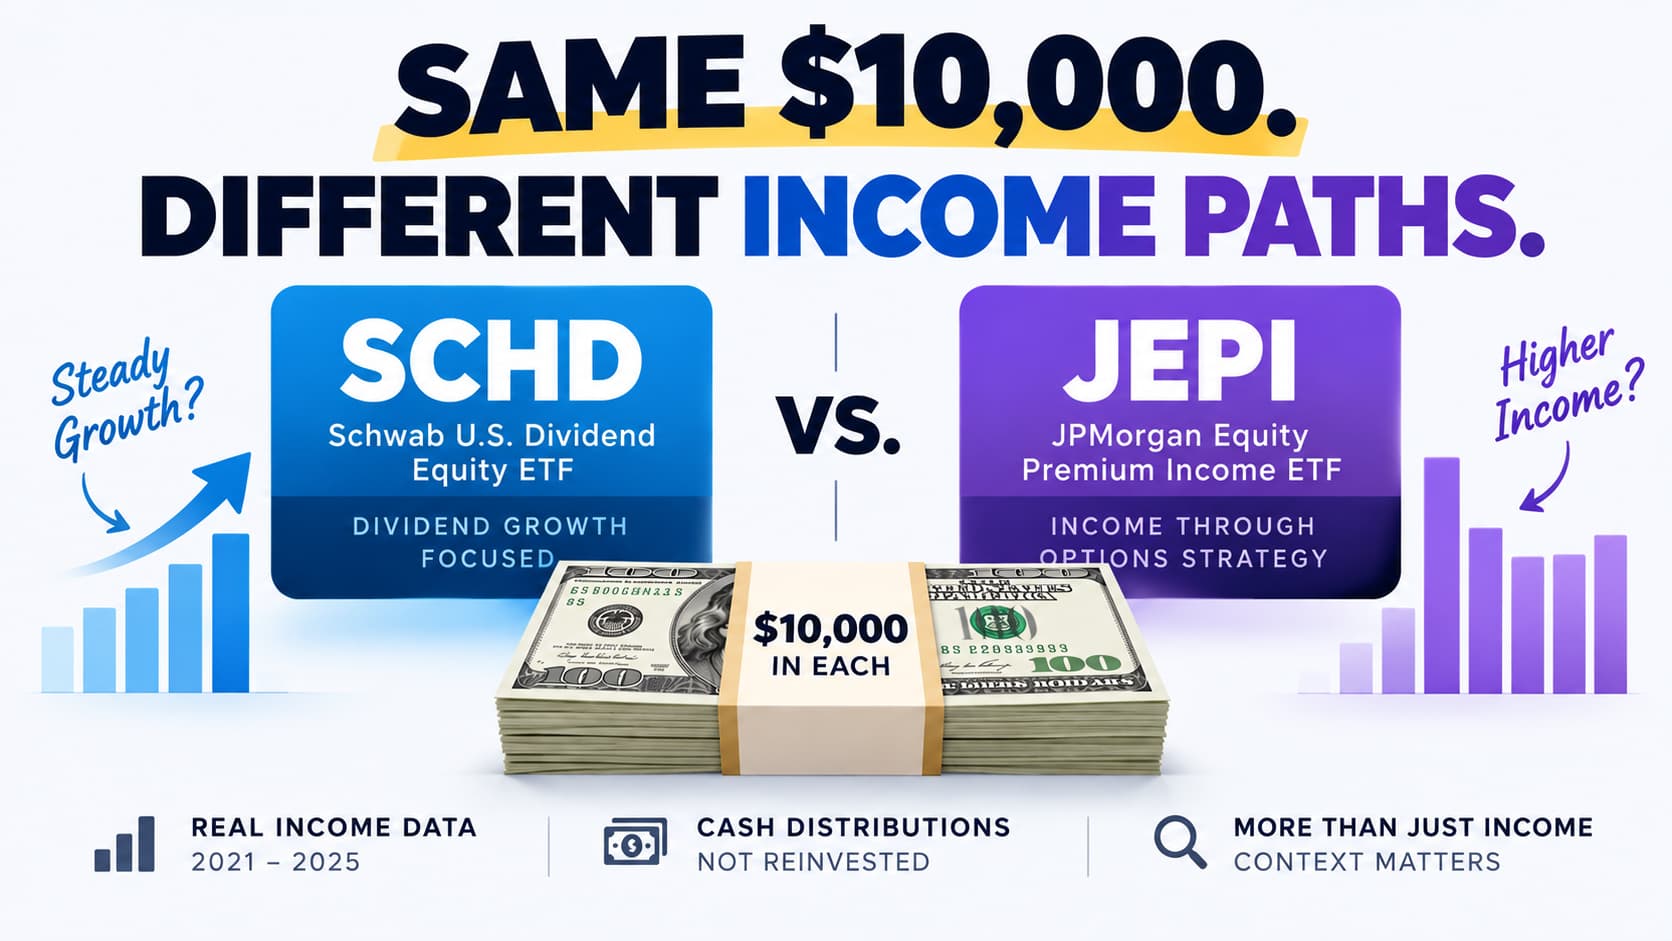
SCHD vs. JEPI: How $10,000 of Income Changed From 2021–2025
Compare the annual cash distributions from $10,000 invested in SCHD and JEPI from 2021–2025, including income growth and yield-on-cost trends.
SCHD · JEPI · dividend growth
Sep 22, 2026
Explore Our Free Tools
Dividend Calculator
Project how your dividend income and portfolio could grow over time.
Open Calculator →Dividend Snowball Calculator
See how dividend growth and reinvestment can compound over time.
Explore the Snowball →Dividend Income Goal Calculator
Compare how much you'd need to invest in different stocks or ETFs to reach a dividend income goal.
Calculate an Income Goal →Dividend Yield Sandbox
Build a hypothetical dividend portfolio and see the income it could generate.
Open the Sandbox →Ticker Battles
Compare dividend stocks and ETFs head-to-head.
Start a Ticker Battle →
Enjoyed this analysis? Get the next one.
New dividend investing comparisons, charts, and research delivered to your inbox.