Explore free tools for dividend planning, income projections, portfolio comparisons, and investment research. No account required.
Plan, compare, and explore dividend investments before putting real money to work.
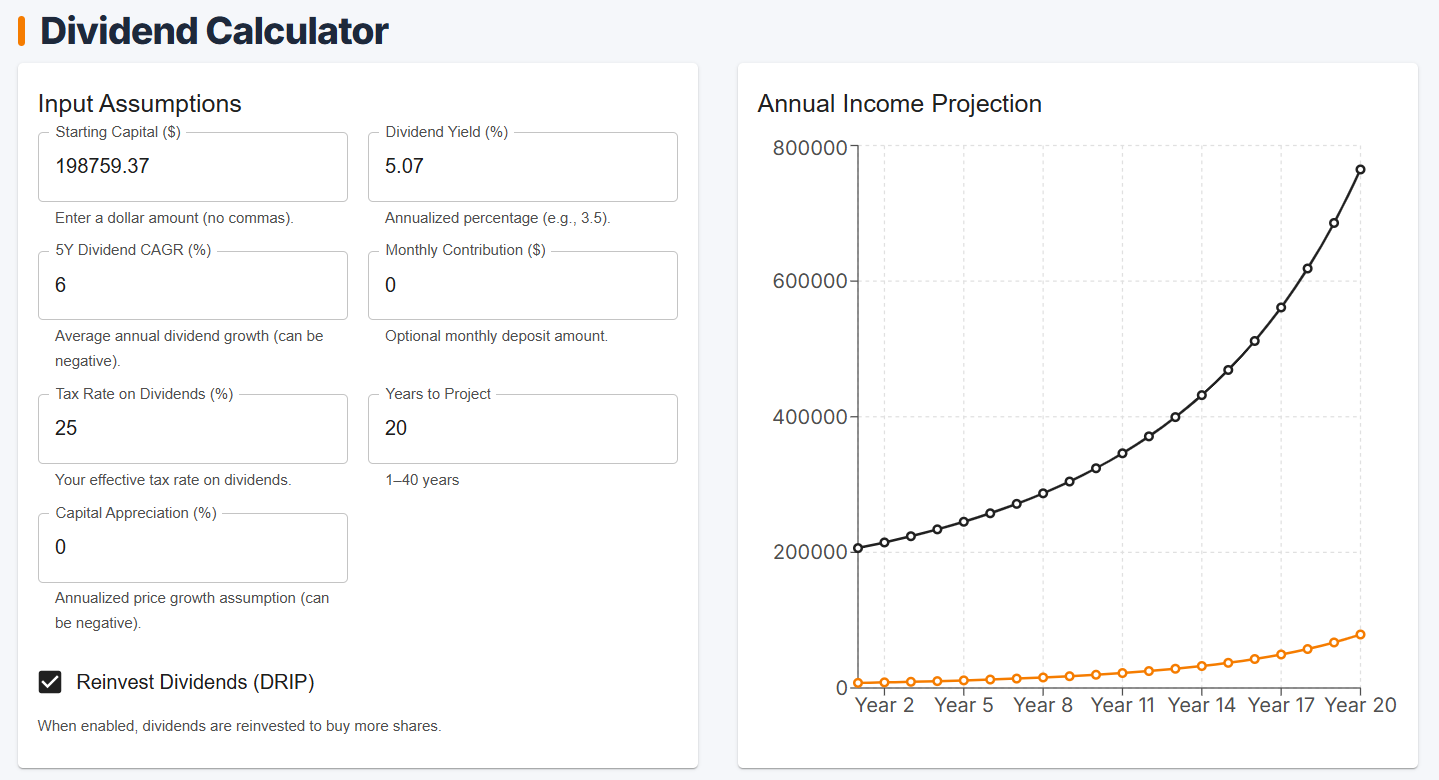
Project how your dividend income and portfolio could grow over time.
Model long-term dividend income and portfolio growth using your own assumptions.
- Starting capital
- Dividend yield
- Dividend growth
- Monthly contributions
- DRIP
- Taxes
- Capital appreciation
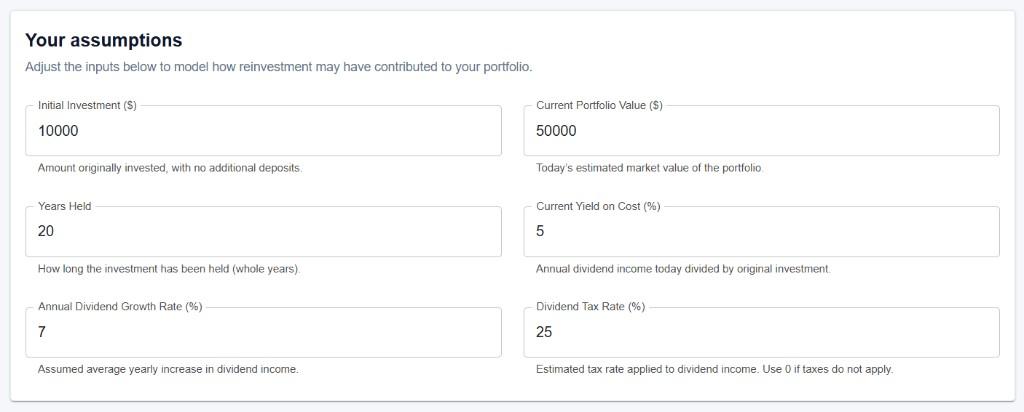
See how dividend growth and reinvestment can compound over time.
Estimate how much of your portfolio growth came from capital appreciation, dividend growth, and reinvestment.
- Dividend growth
- Reinvestment
- Capital appreciation
- Portfolio contribution breakdown
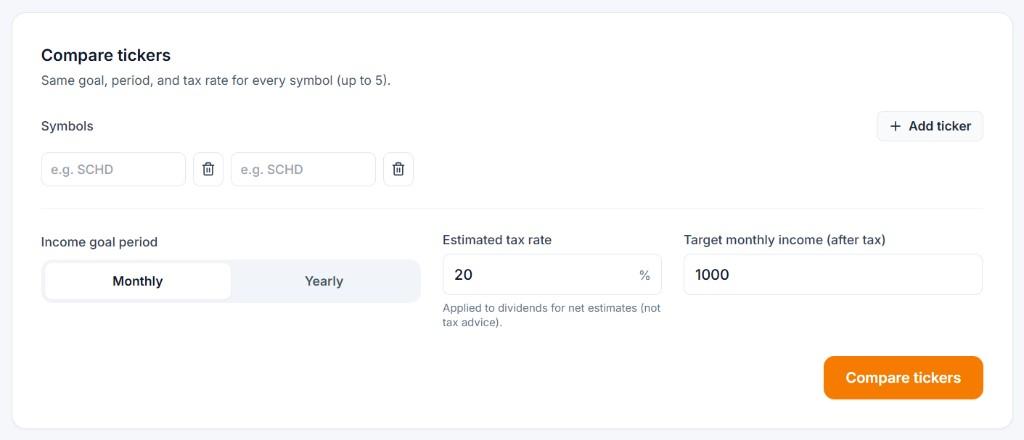
Compare how much you'd need to invest in different stocks or ETFs to reach a dividend income goal.
Compare multiple dividend investments against the same income target.
- Up to 5 tickers
- Monthly or yearly income goals
- After-tax income
- Capital required
- Shares required
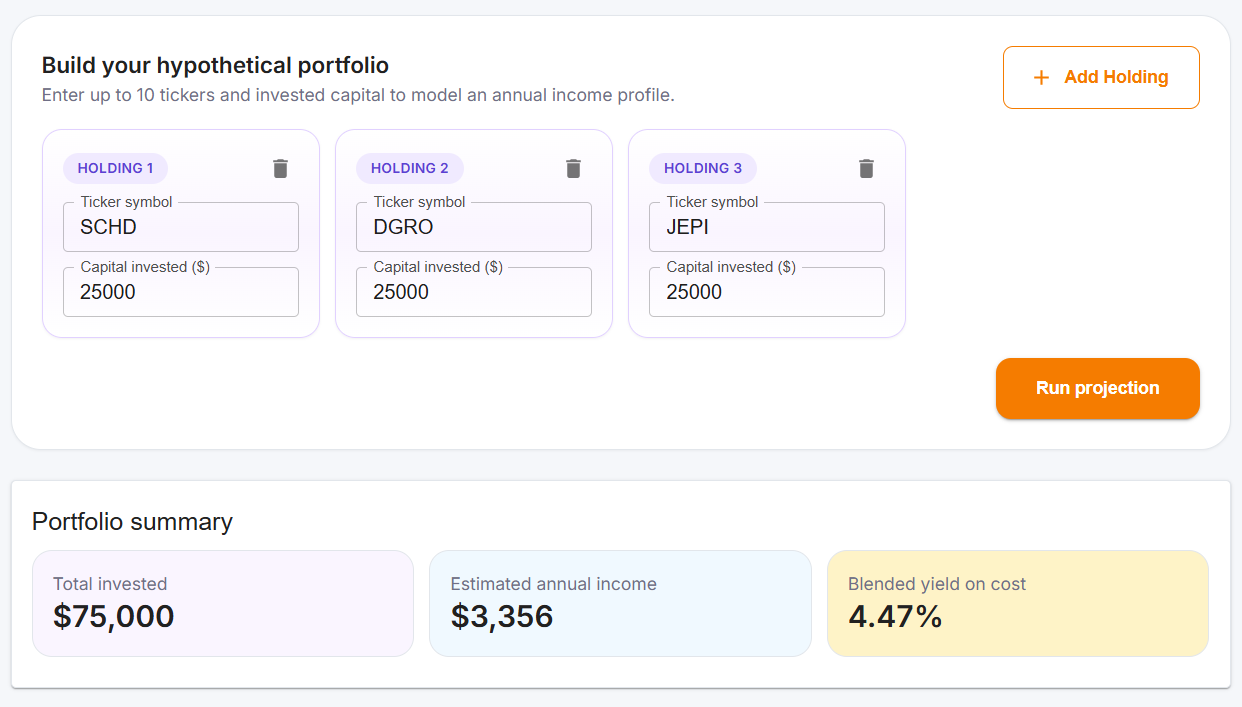
Build a hypothetical dividend portfolio and see the income it could generate.
Quickly test different dividend portfolio combinations before committing capital.
- Up to 10 holdings
- Annual dividend income
- Blended yield on cost
- Per-position breakdown
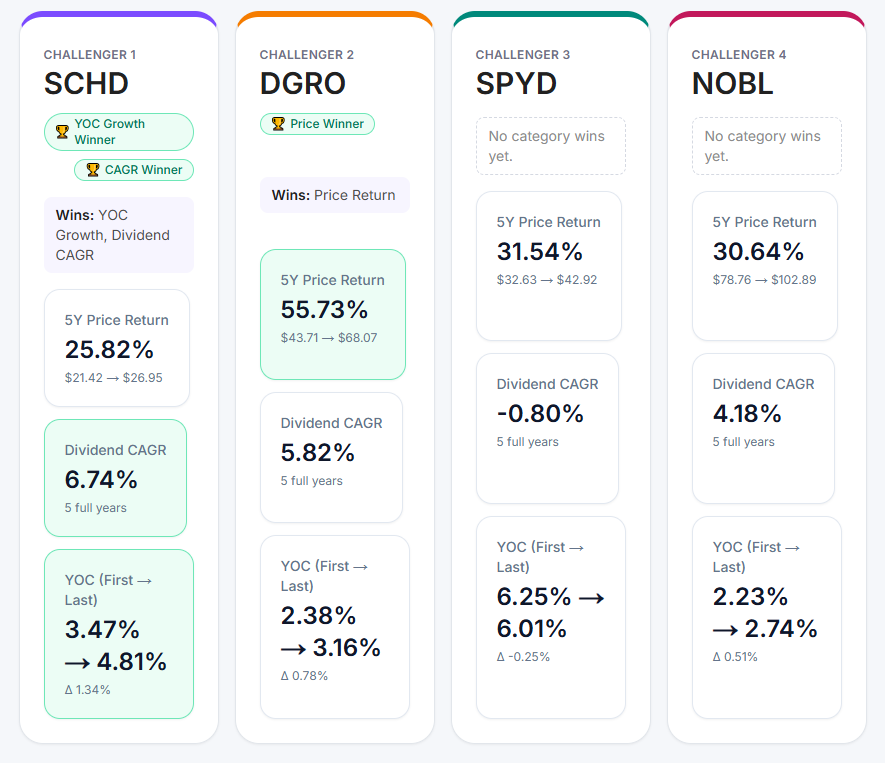
Compare dividend stocks and ETFs head-to-head.
Compare dividend investments side by side using historical return and yield-on-cost data.
- Up to 4 tickers
- Price returns
- Yield on cost
- 5-year and 10-year comparisons
Looking for dividend data visualizations too?
Explore DividendXray’s visualization library for charts covering dividend growth, ETFs, income, valuation, and more.