Realty Income: Price Growth vs Dividend Growth
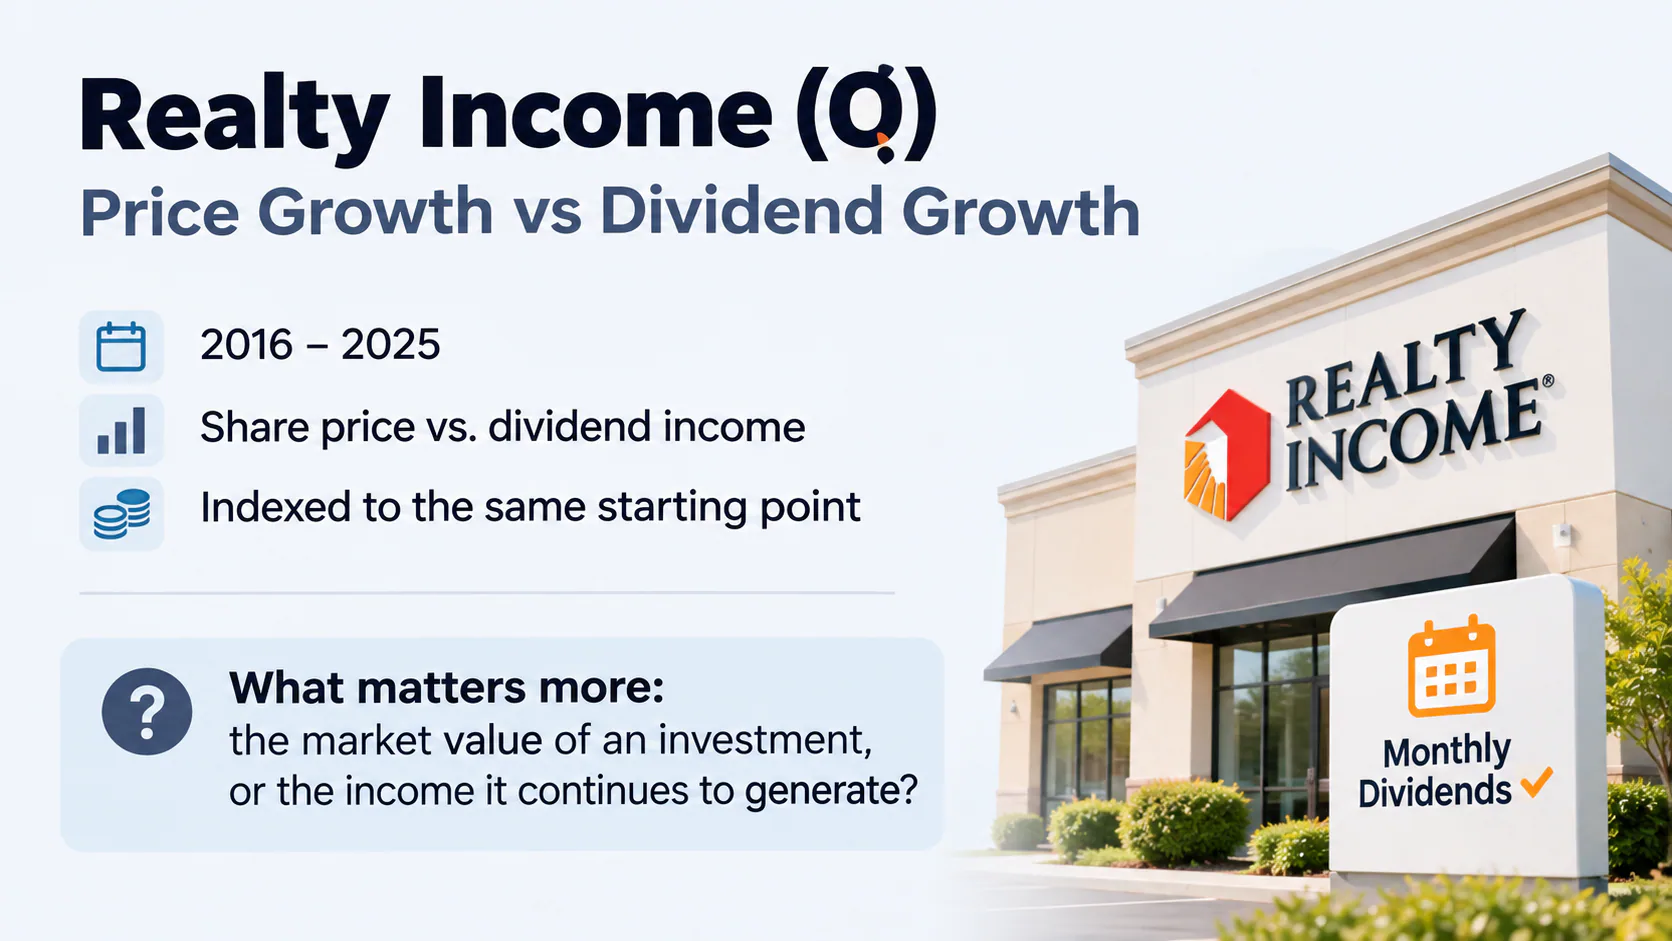
What happens when a company keeps raising its dividend while its share price ends a decade almost exactly where it started?
Realty Income (O) provides an interesting example. From 2016 through 2025, its share price and dividend income followed very different paths.
By indexing both measures to the same starting point, we can see how an investment's market value and the income it generates can tell very different stories.
Explore the Interactive Chart
Want to explore the data behind the images below? Load the interactive version here.
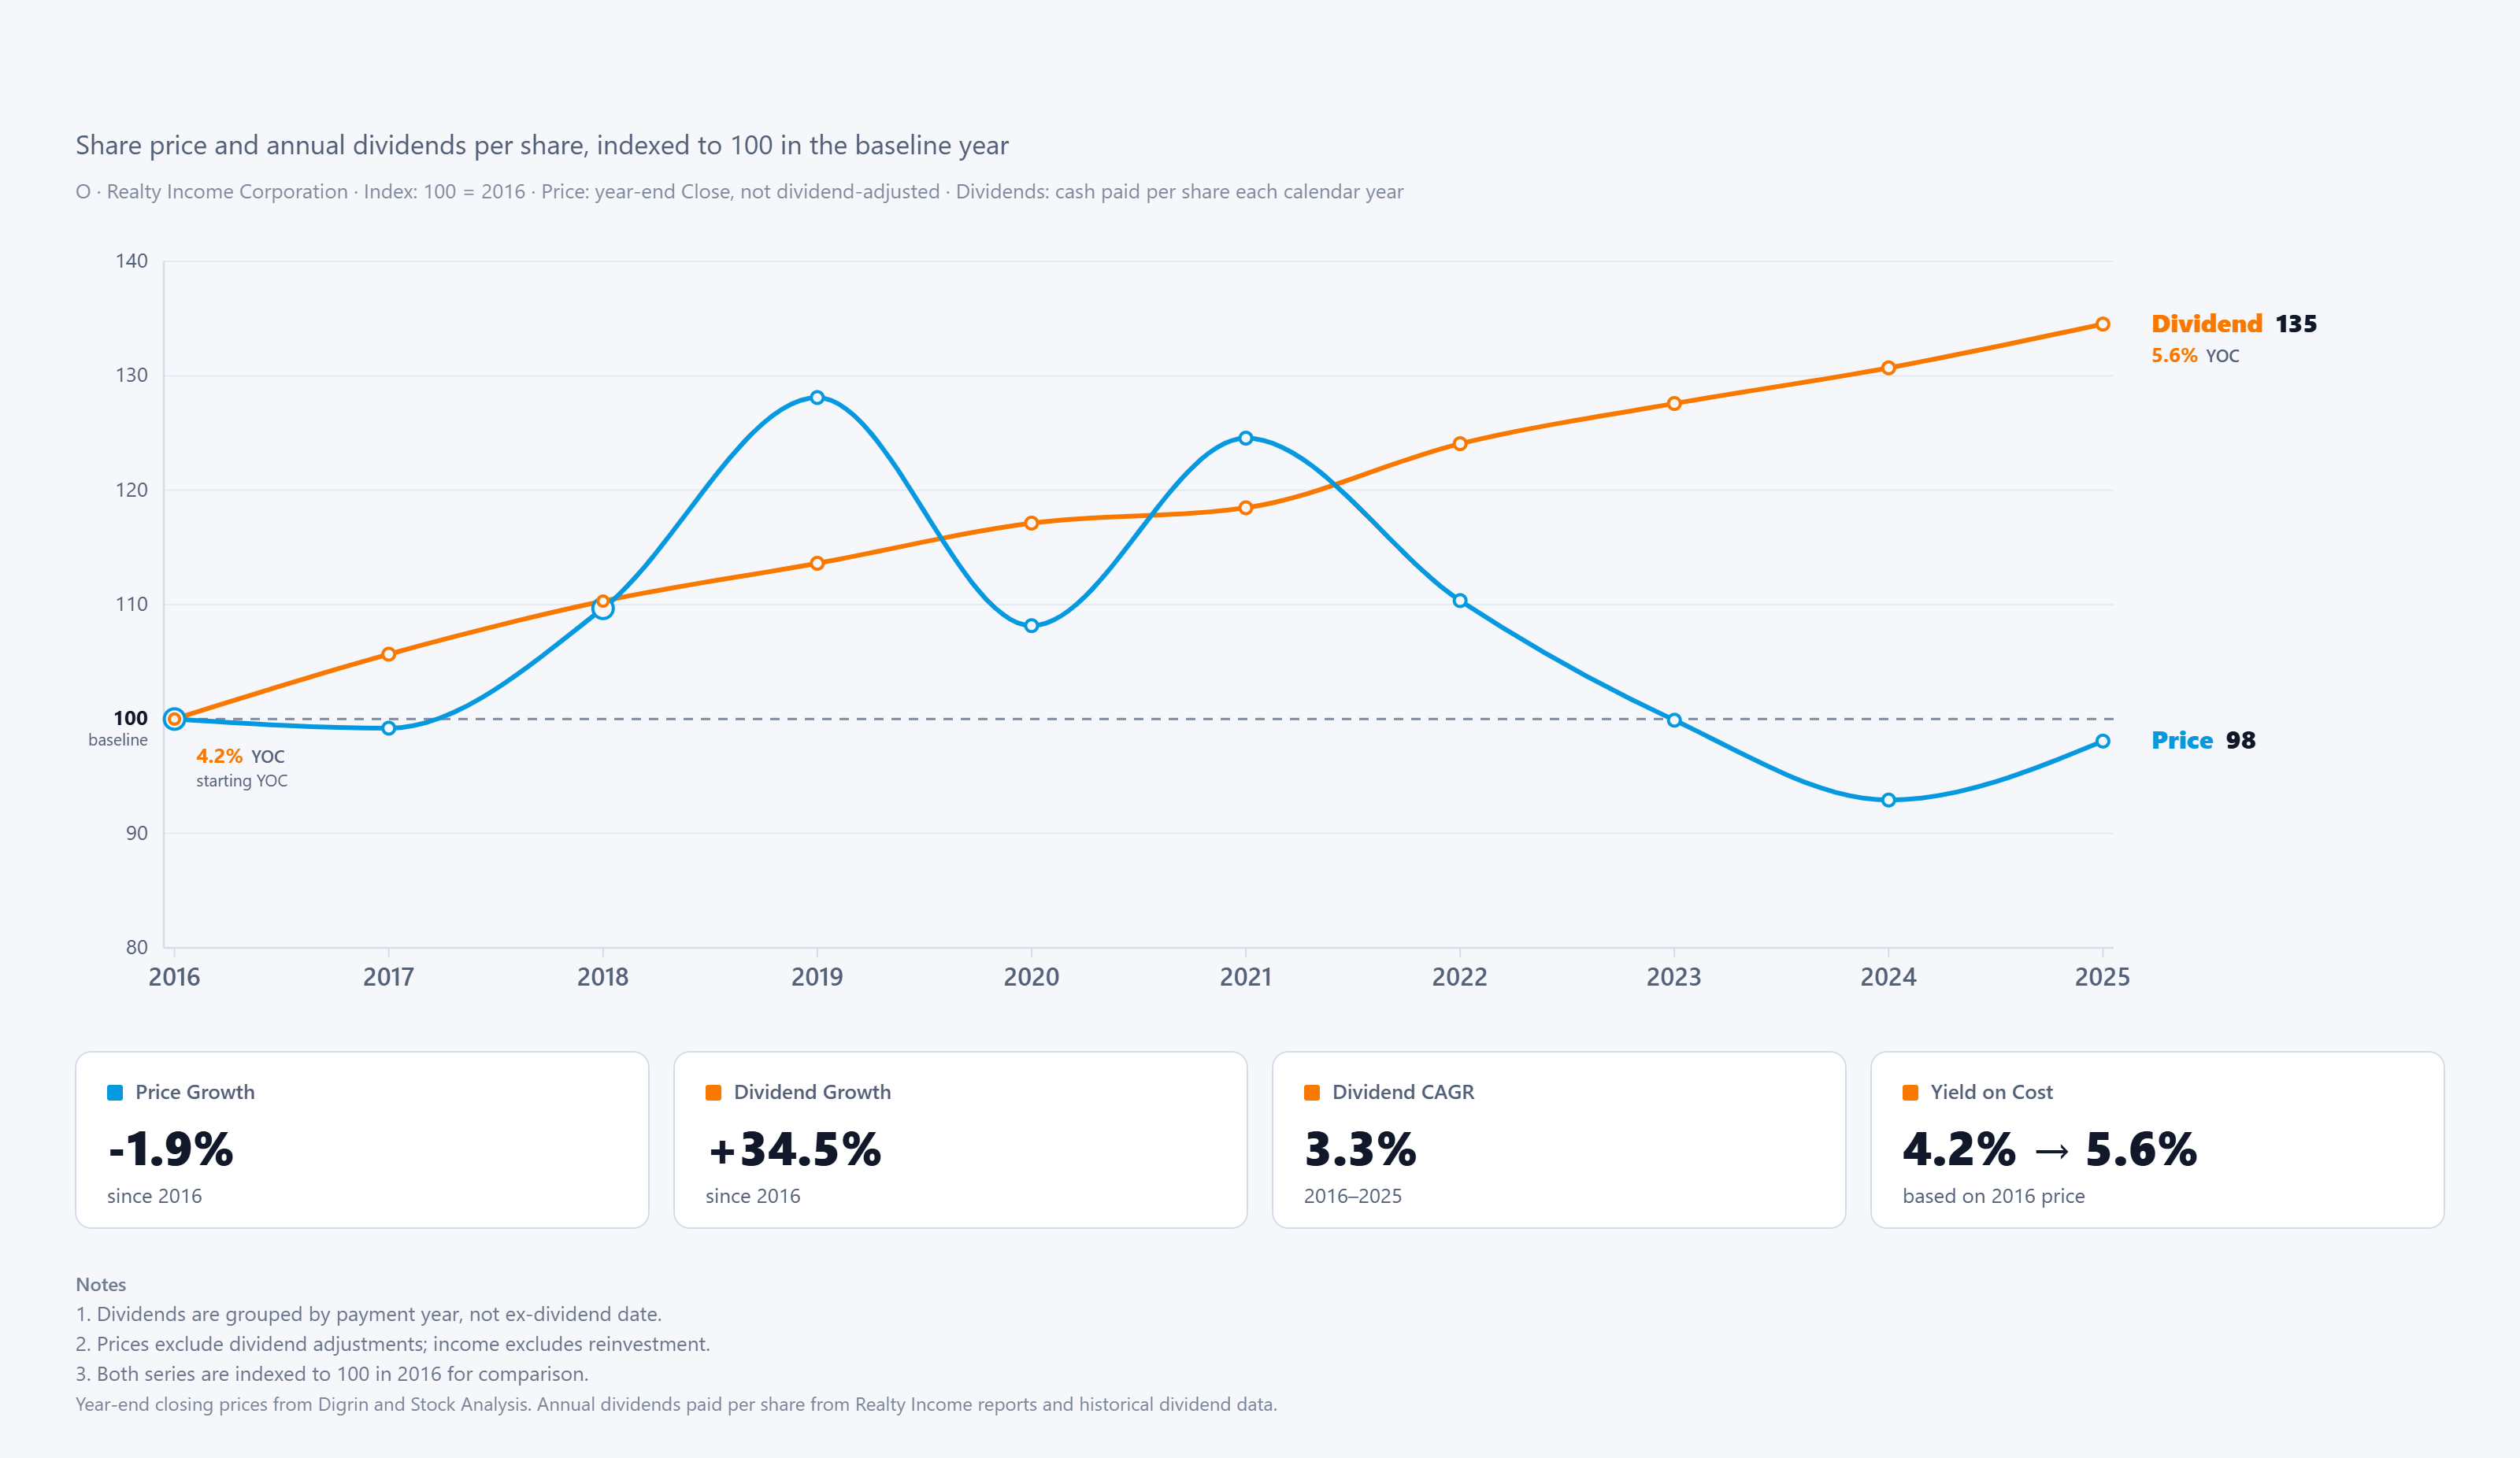
The chart compares Realty Income's year-end share price with its annual dividends per share across ten calendar years from 2016 through 2025.
By the end of 2025, Realty Income's share price was about 1.9% below its 2016 year-end level. Annual dividends per share, however, had increased by 34.5%, equivalent to approximately 3.3% compound annual growth.
The paths were also noticeably different.
Realty Income's share price climbed strongly into 2019, recovered again in 2021, and then declined through 2024. Dividend income moved much more steadily, continuing to rise despite those changes in the share price.
For an income-focused investor, that difference is important. Measured against the 2016 share price, annual yield on cost increased from approximately 4.2% to 5.6% by 2025, even without reinvesting dividends.
That does not mean Realty Income produced a negative total return over the period. The price line measures share price performance only and excludes the dividends investors received along the way.
Final Takeaway
Realty Income's decade illustrates why share price performance and dividend growth should not be treated as interchangeable measures.
From 2016 through 2025, the share price made little net progress from its starting point, while annual dividend income continued to grow. For investors focused on cash flow, that income progression can reveal something a price chart alone does not.
At the same time, dividends are part of the investment's overall return, so neither price performance nor income growth tells the complete story in isolation.
DividendXray helps visualize these different dimensions side by side, making it easier to examine how an investment's price and income have developed over time.
Educational content only. Not financial advice.