Dividend Growth
Dividend Kings: 9 Years of Dividend Growth Compared
Compare 11 Dividend Kings from 2016–2025. Explore annual dividend growth patterns, starting yields, and how dividend increases shaped long-term yield on cost.
Published October 24, 2026 · Updated October 24, 2026
Dividend Kings · Dividend Growth · Yield on Cost · Dividend Investing · Dividend Growth Fingerprints
Hover or focus a mark for details. Click or tap to pin. Press Escape to clear.
Introduction
Dividend Kings are known for their decades-long records of consecutive dividend increases. But maintaining a dividend growth streak and delivering substantial income growth are two different things. This visualization compares 11 Dividend Kings using annual dividend growth fingerprints from 2017 through 2025. Each colored capsule represents the percentage change in dividends per share from the previous year, making it easier to distinguish modest, consistent increases from periods of faster growth. Alongside these patterns, starting yield and ending yield on cost reveal how differently income developed for investors who purchased shares at the beginning of 2016.
Key insights
Parker-Hannifin leads in ending yield on cost
Parker-Hannifin (PH) achieved the highest ending yield on cost among the 11 companies, rising from a starting yield of 2.61% to 7.27% in 2025. Its annual dividend increased by 178.97% over the comparison period, supported by several years of strong growth. In 2022 alone, its dividend increased by 26.45%. The fingerprint illustrates how repeated periods of faster dividend growth can substantially change the income generated by an original investment.
Lowe's delivered the strongest total dividend growth
Lowe's (LOW) began with a relatively modest dividend yield of 1.67%, but reached a 6.24% yield on cost by 2025. Its total dividend growth of 273.02% was the highest in the comparison, exceeding Parker-Hannifin's 178.97%. Lowe's also recorded the strongest individual annual increase in the dataset, with dividend growth of 32.14% in 2022. Nordson (NDSN) followed a similarly growth-oriented pattern, increasing its dividend by 213.73% over the full period and reaching a 5.05% yield on cost. These examples demonstrate why starting yield alone provides an incomplete picture of long-term dividend income.
Consistent increases can produce different income outcomes
Cincinnati Financial (CINF) increased its dividend by 81.25% over the period, expanding its yield on cost from 3.34% to 6.05%. Procter & Gamble (PG) and Johnson & Johnson (JNJ) followed more moderate growth patterns, finishing with yields on cost of 5.33% and 5.12%, respectively. Their fingerprints show how sustained dividend increases can gradually improve income without relying on repeated exceptional growth years. The distinction is important: consistency describes the pattern of increases, while the magnitude of those increases determines how much the dividend actually grows.
A long dividend streak does not guarantee rapid income growth
Emerson Electric (EMR) had the highest starting yield in the comparison at 4.03%, yet finished with a yield on cost of just 4.52%. Its total dividend growth was 12.20%, the lowest among the 11 companies. Dover (DOV) similarly moved from a starting yield of 2.86% to 3.44%, while Colgate-Palmolive (CL) finished with the lowest ending yield on cost at 3.18%. These companies continued increasing their annual dividends, but the relatively small increases produced more limited income expansion. The comparison highlights why the length of a dividend growth streak should not be confused with the strength of dividend growth itself.
Methodology
The visualization compares annual dividends per share for 11 selected Dividend Kings from 2016 through 2025. Each capsule represents year-over-year dividend growth, calculated by comparing a company's annual dividend with the previous year's value. The displayed fingerprints cover 2017–2025. Capsule colors distinguish different growth ranges, from smaller increases to years of stronger dividend growth. The visualization is ranked by ending yield on cost, highest to lowest. Starting yield is calculated using the 2016 annual dividend divided by the original purchase price. Ending yield on cost uses the 2025 annual dividend divided by that same purchase price. The purchase-price basis is January 4, 2016, for the companies in this comparison. Dividends are not reinvested. Yield on cost measures annual dividend income relative to the original purchase price. It is not the current market yield and does not represent total investment return. The analysis covers a selected group of 11 companies rather than every Dividend King. Historical dividend growth does not establish future growth rates.
Data as of: October 24, 2026
Explore Your Own Dividend Portfolio
Go beyond historical dividend charts. Track your dividend income, yield on cost, and allocation targets in one dashboard.
Free for up to 15 stocks. No credit card required.
Related links
Keep Exploring
 Dividend Growth
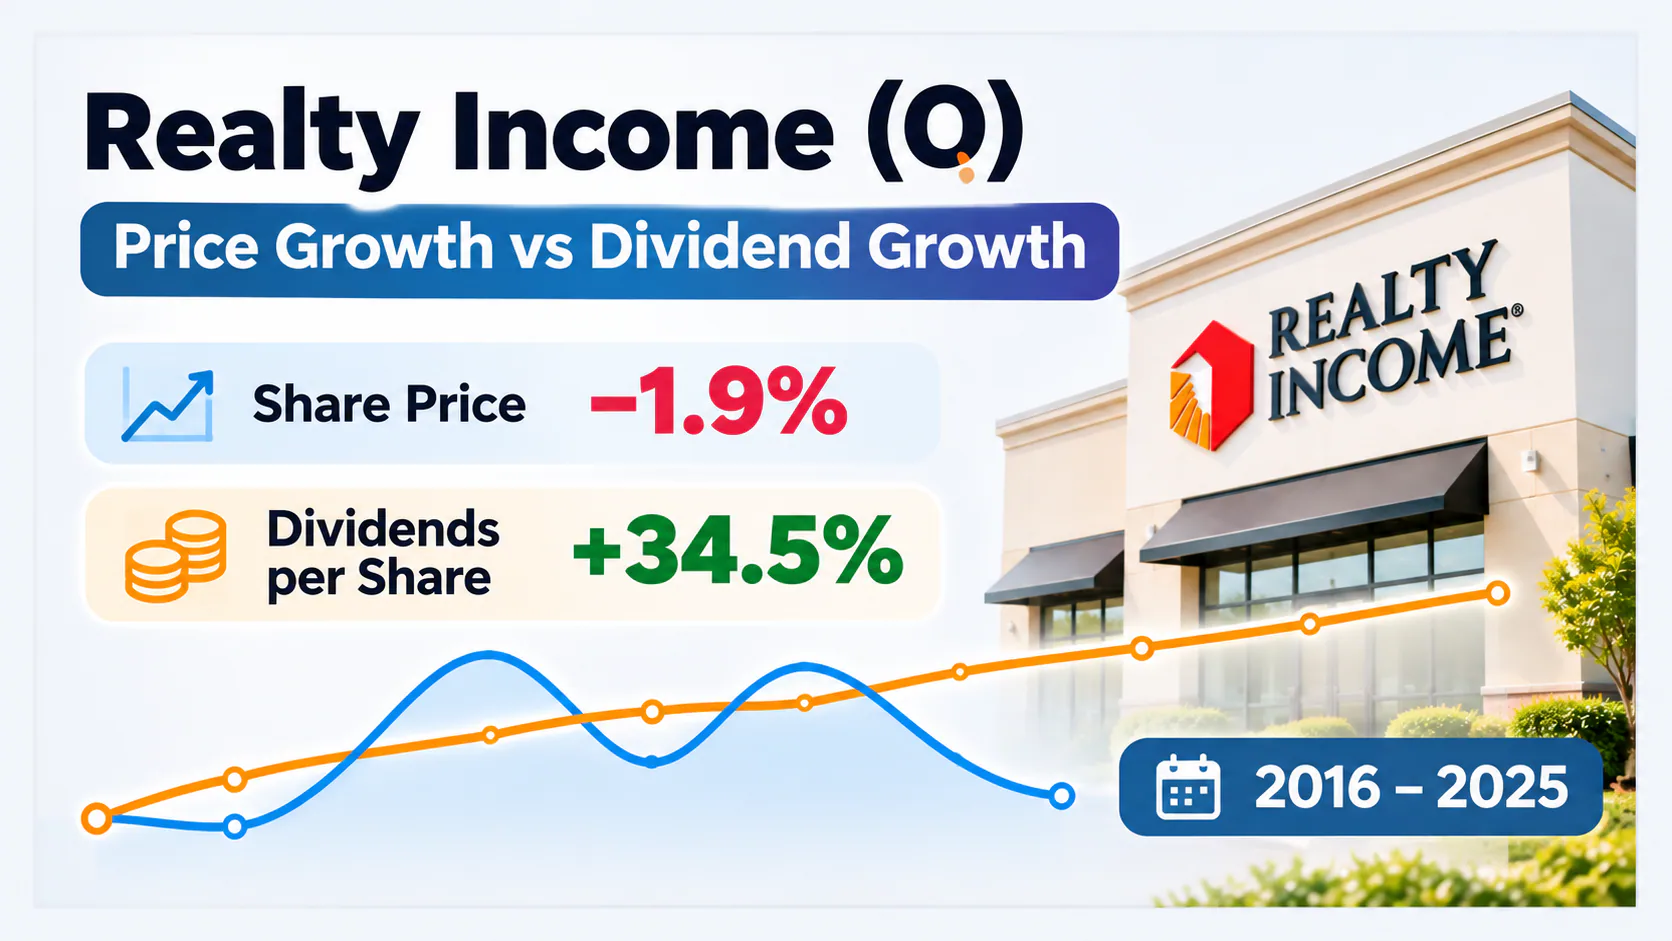
Realty Income (O): Price Growth vs Dividend Growth, 2016–2025
Explore Realty Income (O) price growth vs dividend growth from 2016 to 2025. Compare a 1.9% share price decline with 34.0% dividend growth and rising yield on cost.
Realty Income · O · Dividend Growth · Price vs Income…
Nov 5, 2026
 Dividend Growth
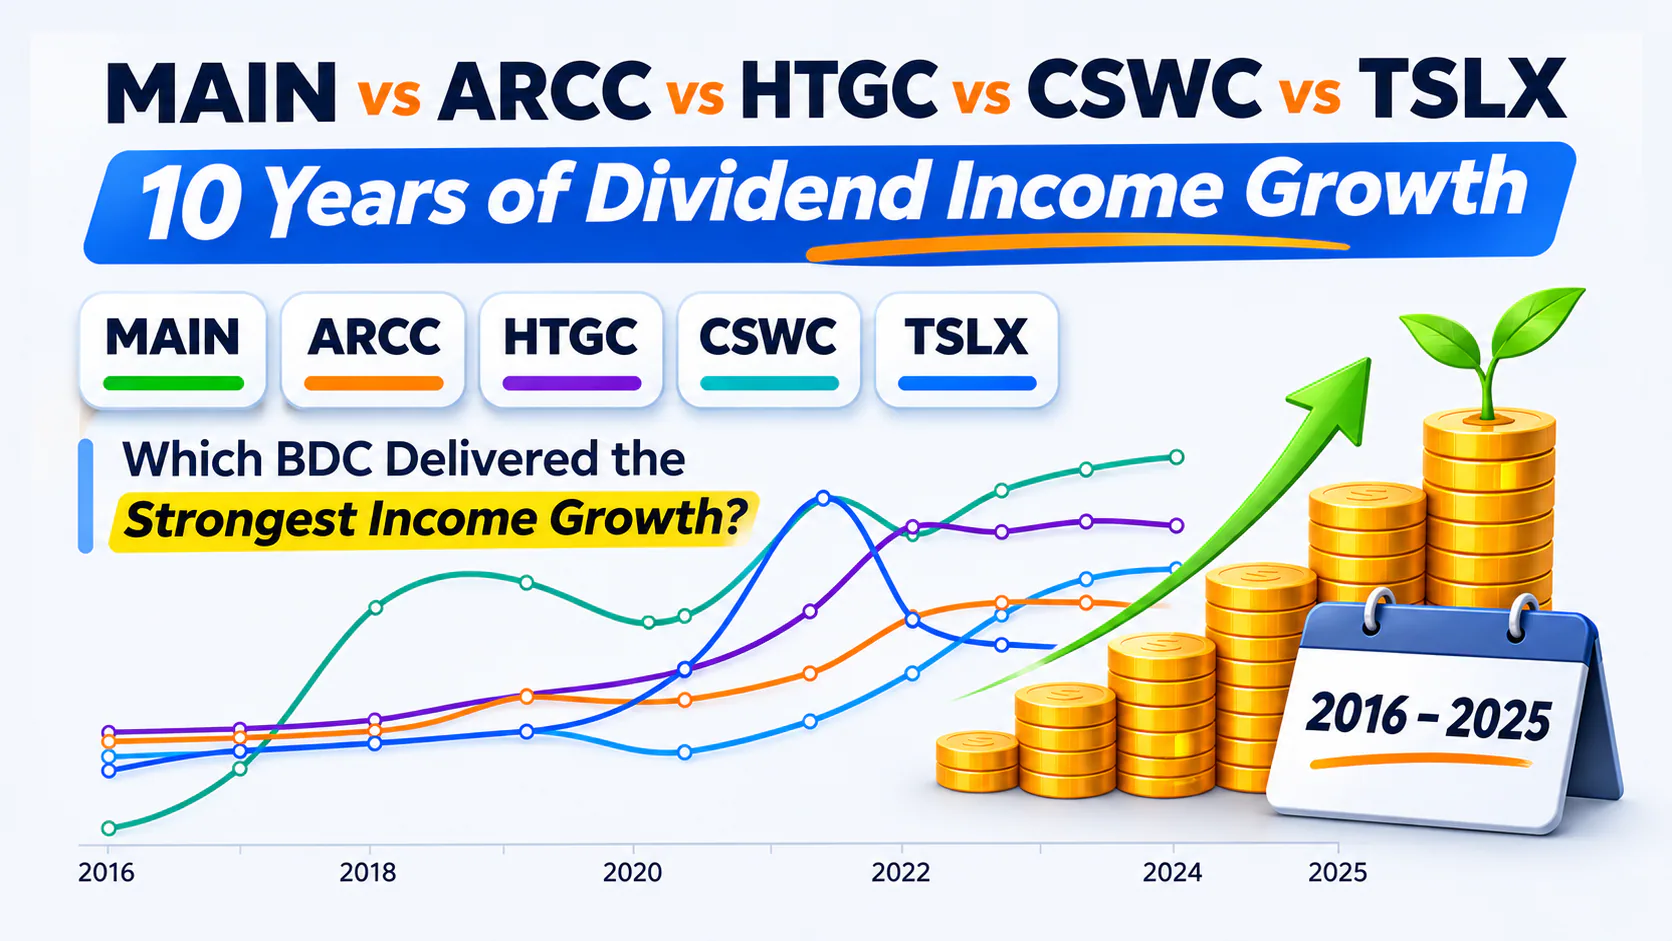
MAIN vs ARCC vs HTGC vs CSWC vs TSLX – 10 Years of Dividend Income Growth
Compare 10 years of dividend income growth for MAIN, ARCC, HTGC, CSWC and TSLX using historical yield on cost from 2016 to 2025.
BDC · Dividend Growth · Yield on Cost · Dividend Income…
Nov 1, 2026
 Dividend Growth
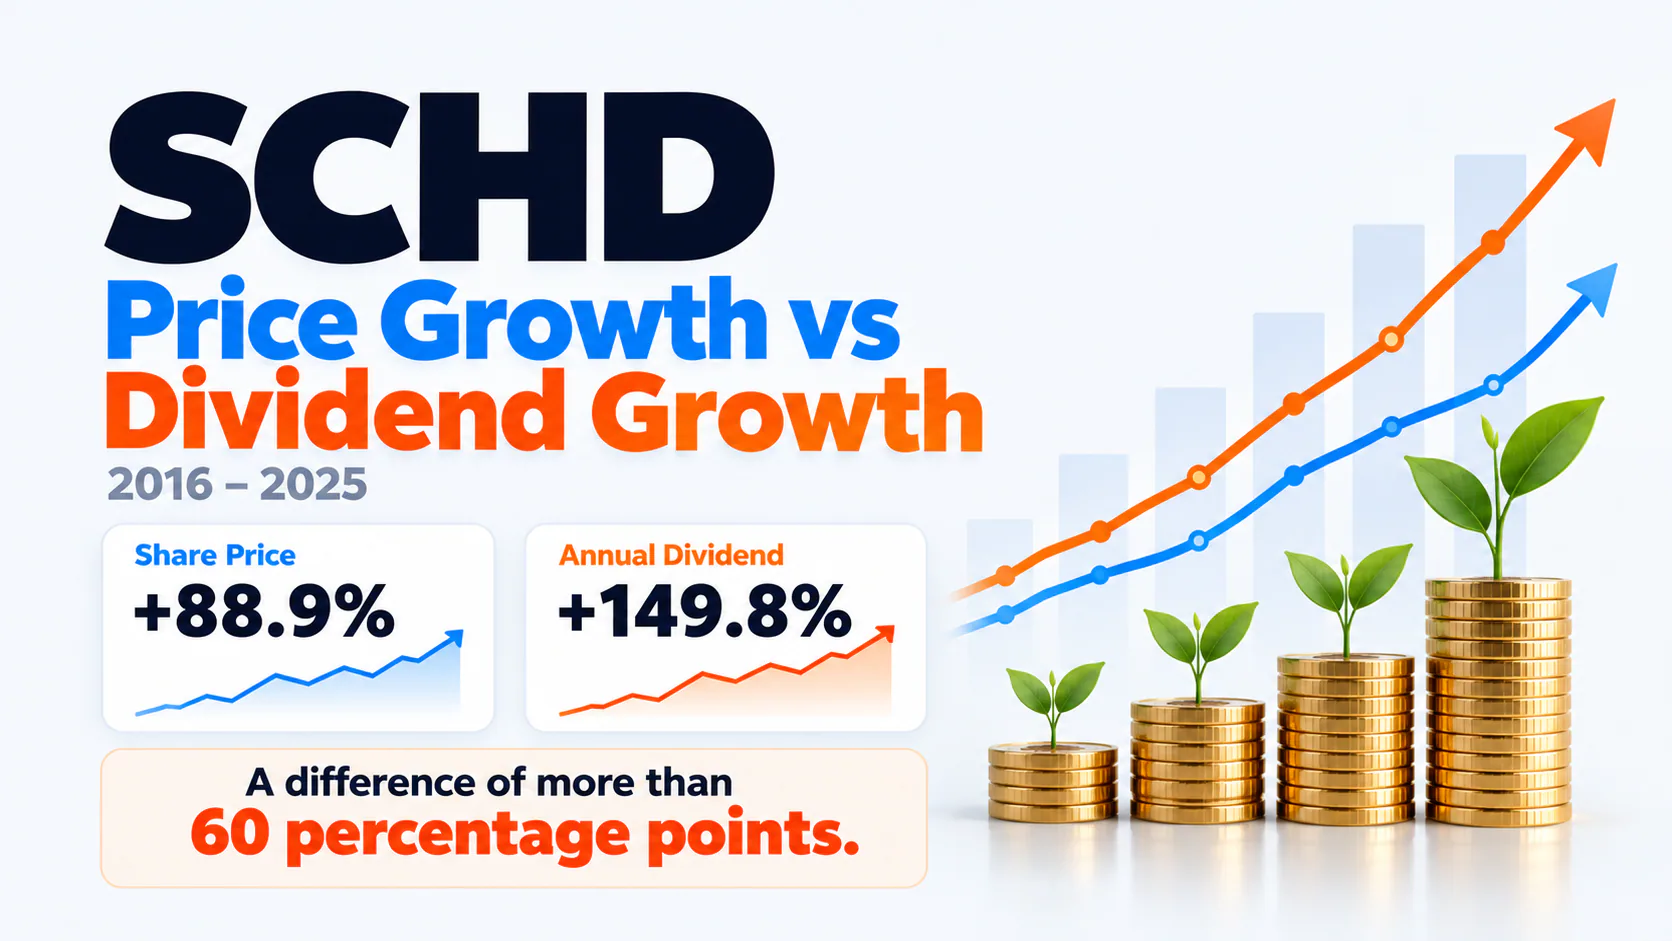
SCHD: Price Growth vs Dividend Growth (2016–2025)
SCHD's share price grew 88.9% from 2016–2025, while annual dividends per share rose 149.8%. Explore dividend growth, yield on cost, and historical trends.
SCHD · Dividend Growth · Yield on Cost · Price Growth…
Oct 19, 2026
Explore Our Free Tools
Dividend Calculator
Project how your dividend income and portfolio could grow over time.
Open Calculator →Dividend Snowball Calculator
See how dividend growth and reinvestment can compound over time.
Explore the Snowball →Dividend Income Goal Calculator
Compare how much you'd need to invest in different stocks or ETFs to reach a dividend income goal.
Calculate an Income Goal →Dividend Yield Sandbox
Build a hypothetical dividend portfolio and see the income it could generate.
Open the Sandbox →Ticker Battles
Compare dividend stocks and ETFs head-to-head.
Start a Ticker Battle →
Enjoyed this analysis? Get the next one.
New dividend investing comparisons, charts, and research delivered to your inbox.