Dividend Kings: 9 Years of Dividend Growth Compared
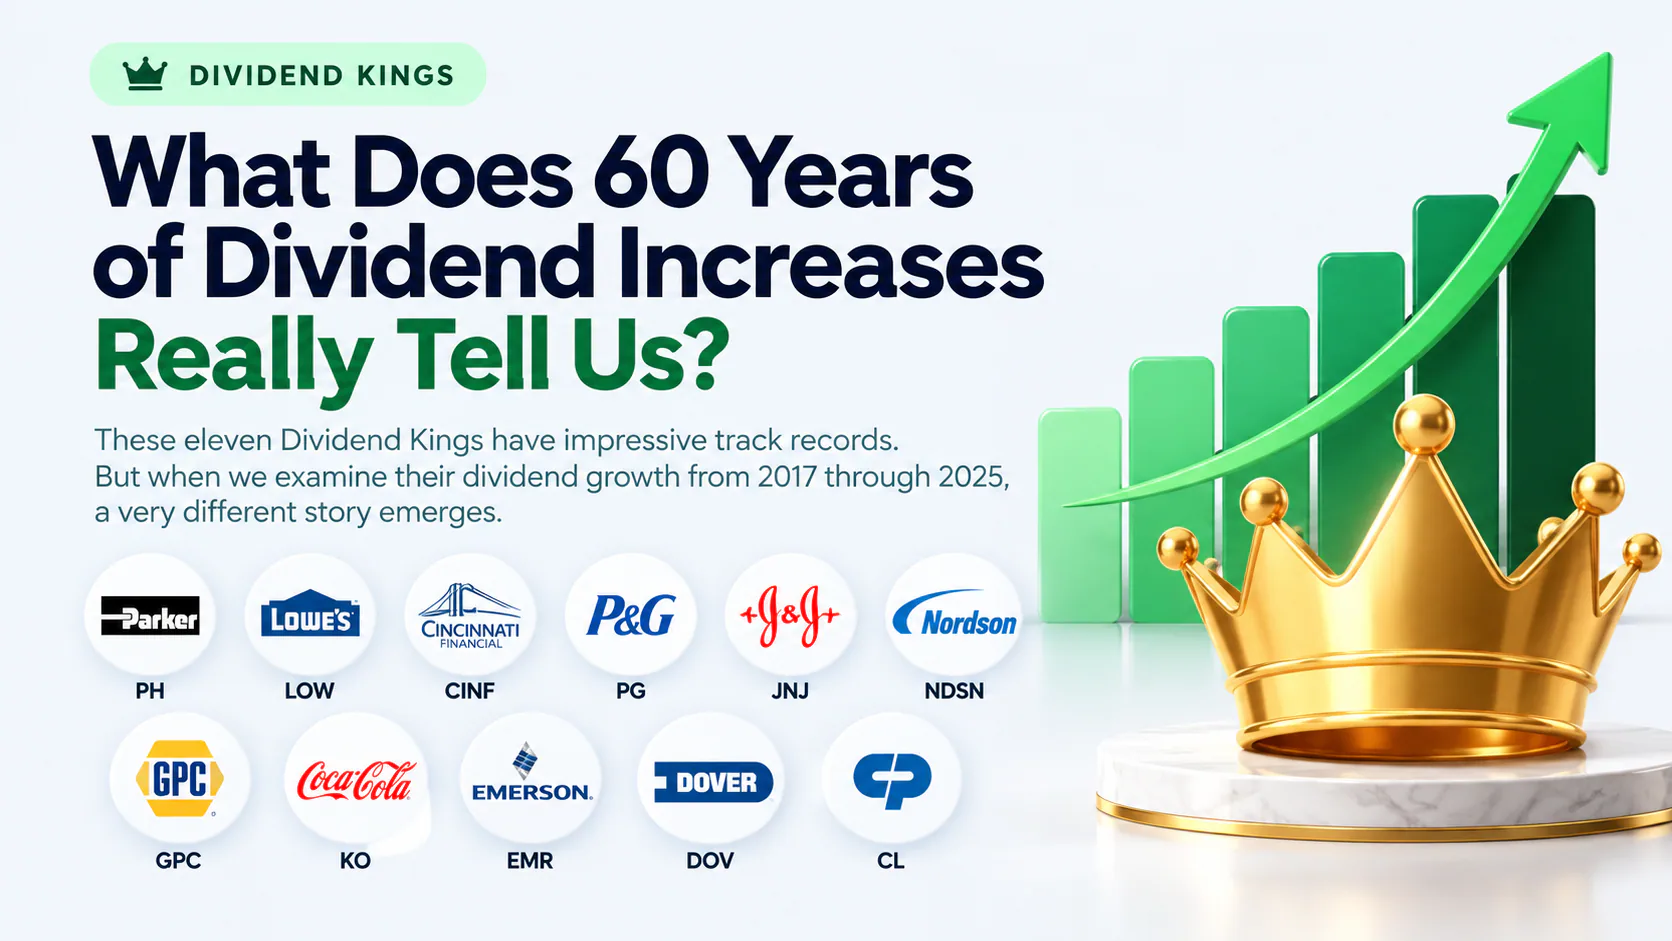
A company that has increased its dividend for more than 60 consecutive years has demonstrated remarkable consistency. But does that necessarily mean it has delivered strong income growth for long-term shareholders?
Not all dividend increases are equal.
In this visual analysis, we examine 11 Dividend Kings and compare their annual dividend growth patterns from 2017 through 2025. Rather than focusing only on how long each company has maintained its dividend growth streak, we look at how quickly those dividends actually increased.
The visualization also tracks yield on cost, showing how each company's original dividend yield evolved for an investor who purchased shares at the beginning of 2016.
The results reveal meaningful differences between companies with similarly impressive dividend histories.
Explore the Interactive Chart
Want to explore the data behind the images below? Load the interactive version here.
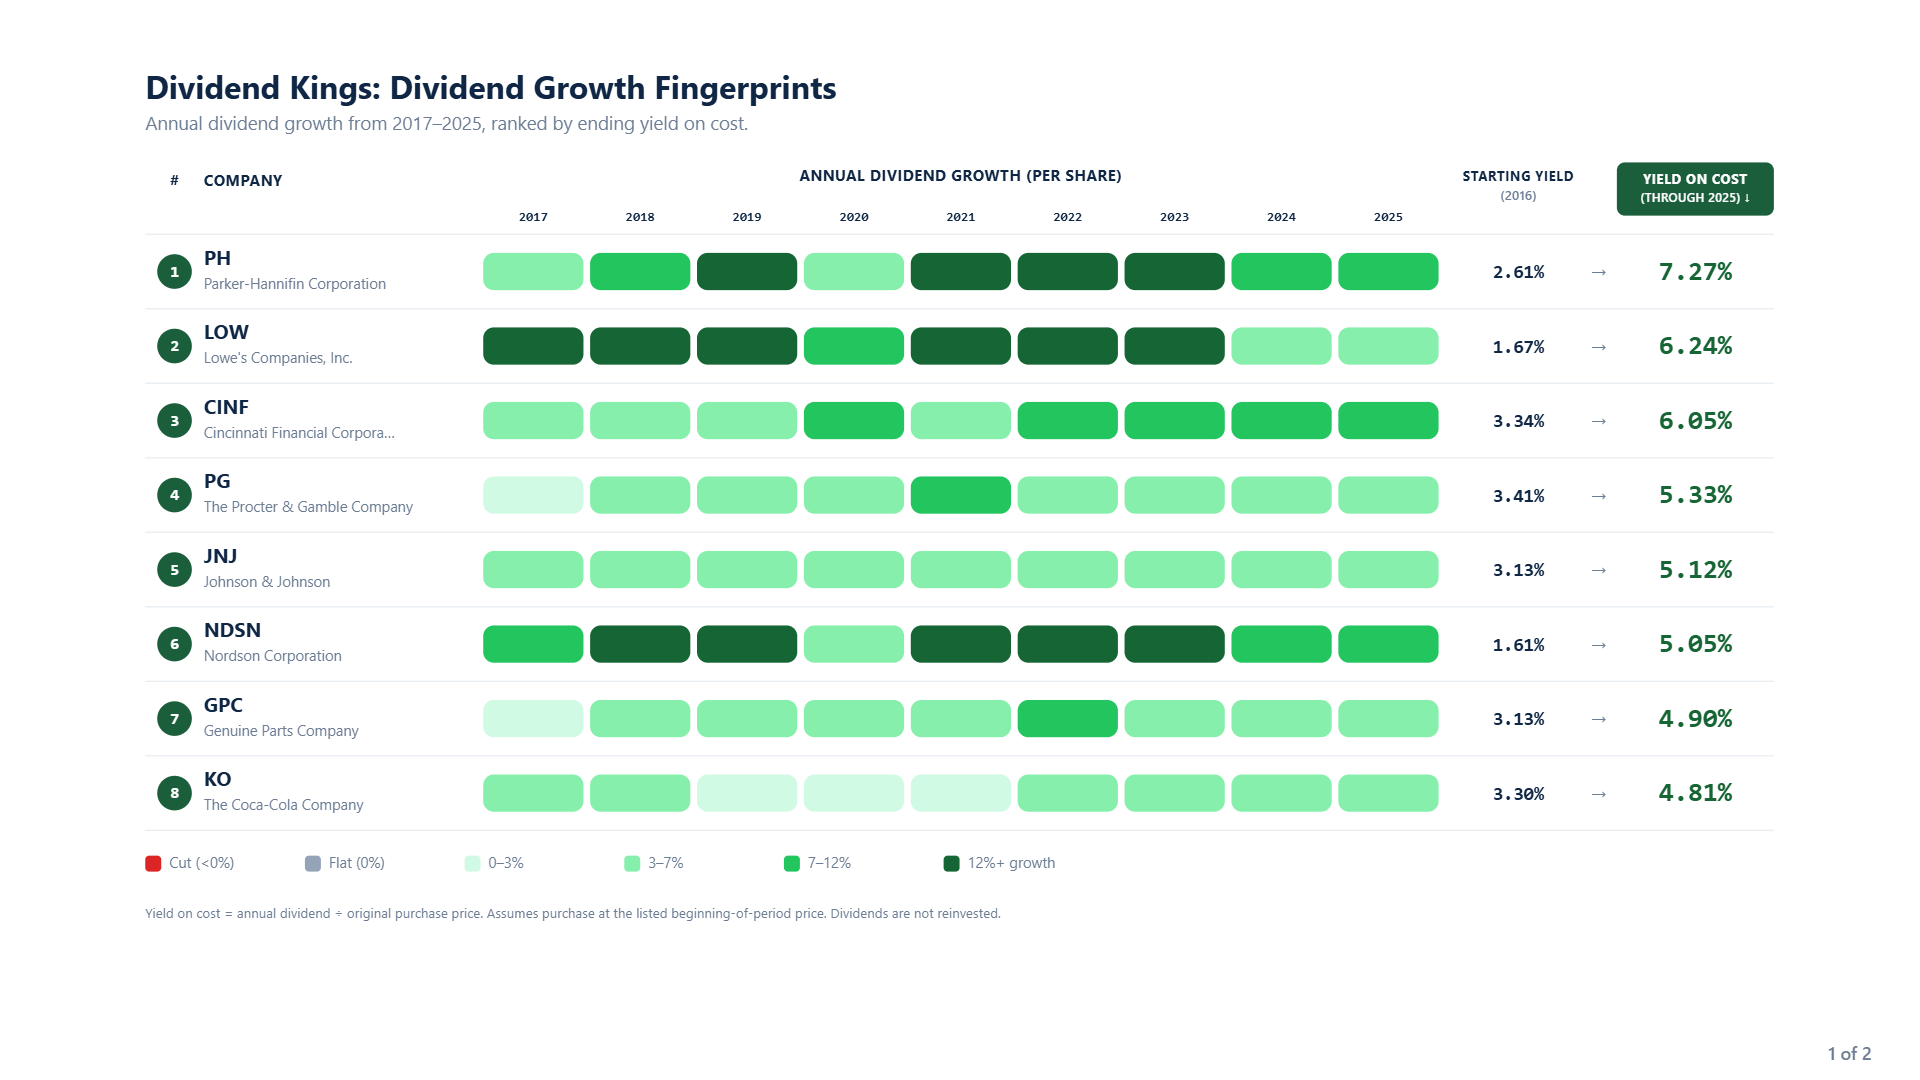
The first chart presents eight Dividend Kings ranked by their ending yield on cost.
Each colored block represents one year of dividend growth. Lighter greens indicate smaller increases, while darker greens represent faster growth, including years when dividends increased by more than 12%.
Parker-Hannifin (PH) leads the comparison.
An investor purchasing shares at the beginning of 2016 would have started with a dividend yield of 2.61%. By 2025, the annual dividend represented a 7.27% yield on that original investment.
Its dividend growth fingerprint reveals multiple years of double-digit increases, particularly between 2019 and 2023.
Lowe's (LOW) demonstrates an even more dramatic transformation relative to its starting yield.
Beginning at just 1.67%, Lowe's reached a 6.24% yield on cost by 2025. Its fingerprint contains several consecutive years of strong dividend growth, illustrating how a relatively low initial yield can develop into meaningful income over time.
This is an important distinction for dividend investors: a low starting yield does not necessarily mean low future income.
Cincinnati Financial (CINF) followed a different path.
Its starting yield of 3.34% expanded to 6.05%, supported by a pattern of relatively consistent annual dividend increases.
Unlike Parker-Hannifin and Lowe's, Cincinnati Financial did not rely on repeated years of exceptionally high dividend growth to achieve its result.
Procter & Gamble (PG) and Johnson & Johnson (JNJ) provide further examples of steady income expansion.
Procter & Gamble increased its yield on cost from 3.41% to 5.33%, while Johnson & Johnson moved from 3.13% to 5.12%.
Their fingerprints show mostly moderate annual increases, illustrating how consistent dividend growth can gradually improve income without requiring frequent double-digit raises.
Nordson (NDSN) also stands out for its strong growth pattern, reaching a 5.05% yield on cost from a starting yield of 1.61%.
Meanwhile, Genuine Parts Company (GPC) and Coca-Cola (KO) finished at 4.90% and 4.81%, respectively.
The central observation is that companies with long dividend growth streaks can produce very different income outcomes, depending on their starting yields and the magnitude of their annual increases.
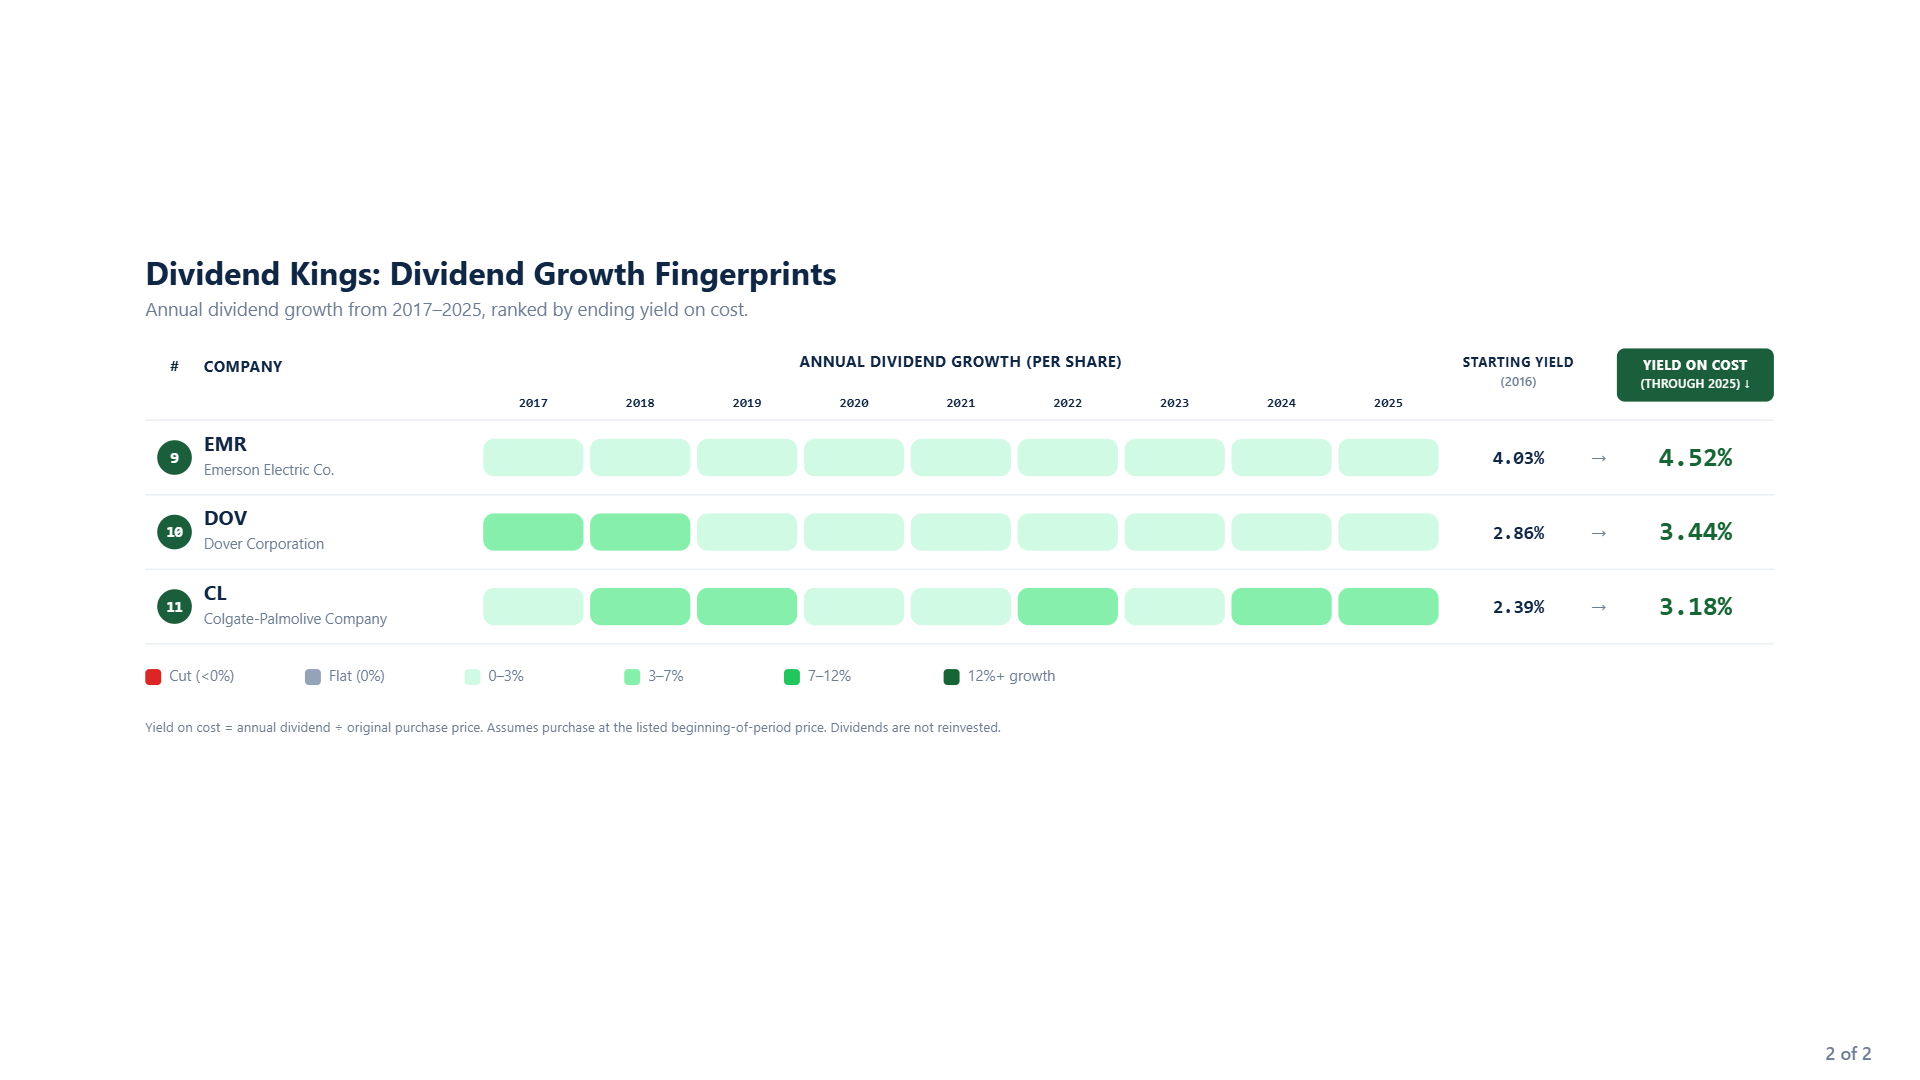
The second chart completes the comparison with Emerson Electric, Dover, and Colgate-Palmolive.
These companies demonstrate the other side of dividend growth investing: maintaining a long dividend increase streak does not necessarily translate into rapid income expansion.
Emerson Electric (EMR) had the highest starting yield among all 11 companies, at 4.03%.
However, by 2025, its yield on cost had reached only 4.52%.
Despite maintaining its dividend growth record, Emerson's relatively small annual increases produced limited additional income relative to the original investment.
Dover (DOV) shows a similar pattern.
Its starting yield of 2.86% increased to 3.44% by 2025. The predominantly light-green fingerprint reflects a series of modest dividend increases.
Colgate-Palmolive (CL) finished with a yield on cost of 3.18%, compared with its initial 2.39% yield.
All three companies continued increasing their dividends throughout the period examined, but their income growth was considerably slower than that of the strongest performers in the first chart.
This highlights an important difference between dividend consistency and dividend growth magnitude.
A company can maintain an impressive dividend growth streak through relatively small annual increases. That consistency may be valuable, but it does not automatically produce substantial income growth.
Final Takeaway
Dividend Kings have earned their reputation through decades of consecutive dividend increases. Their histories demonstrate a sustained commitment to returning cash to shareholders.
However, a dividend growth streak alone tells investors relatively little about how quickly their income might increase.
This comparison highlights three factors worth evaluating together:
- Starting yield: How much income does the investment initially provide?
- Dividend growth: How quickly has the company increased its payments?
- Time: How have those increases translated into income on the original investment?
Parker-Hannifin and Lowe's illustrate the potential impact of faster dividend growth, while Emerson Electric and Dover demonstrate how modest increases can preserve a streak without dramatically changing the income picture.
Neither approach guarantees better future investment performance. Dividend growth can change, and yield on cost does not account for share-price appreciation, valuation, or total return.
For long-term dividend investors, the practical lesson is to look beyond the number of consecutive annual increases and examine the actual growth pattern behind the streak.
A long dividend history tells you what a company has maintained. Its dividend growth fingerprint shows how much its income has changed.
Explore more dividend comparisons, historical income analysis, and interactive research tools at DividendXray.
Methodology: Annual dividend growth is measured using dividend payments per share from 2017 through 2025. Yield on cost is calculated as annual dividends per share divided by the original purchase price at the beginning of 2016. Dividends are not reinvested. The analysis covers a selected group of 11 Dividend Kings and is not an exhaustive ranking. Historical performance does not guarantee future results.
Educational content only. Not financial advice.