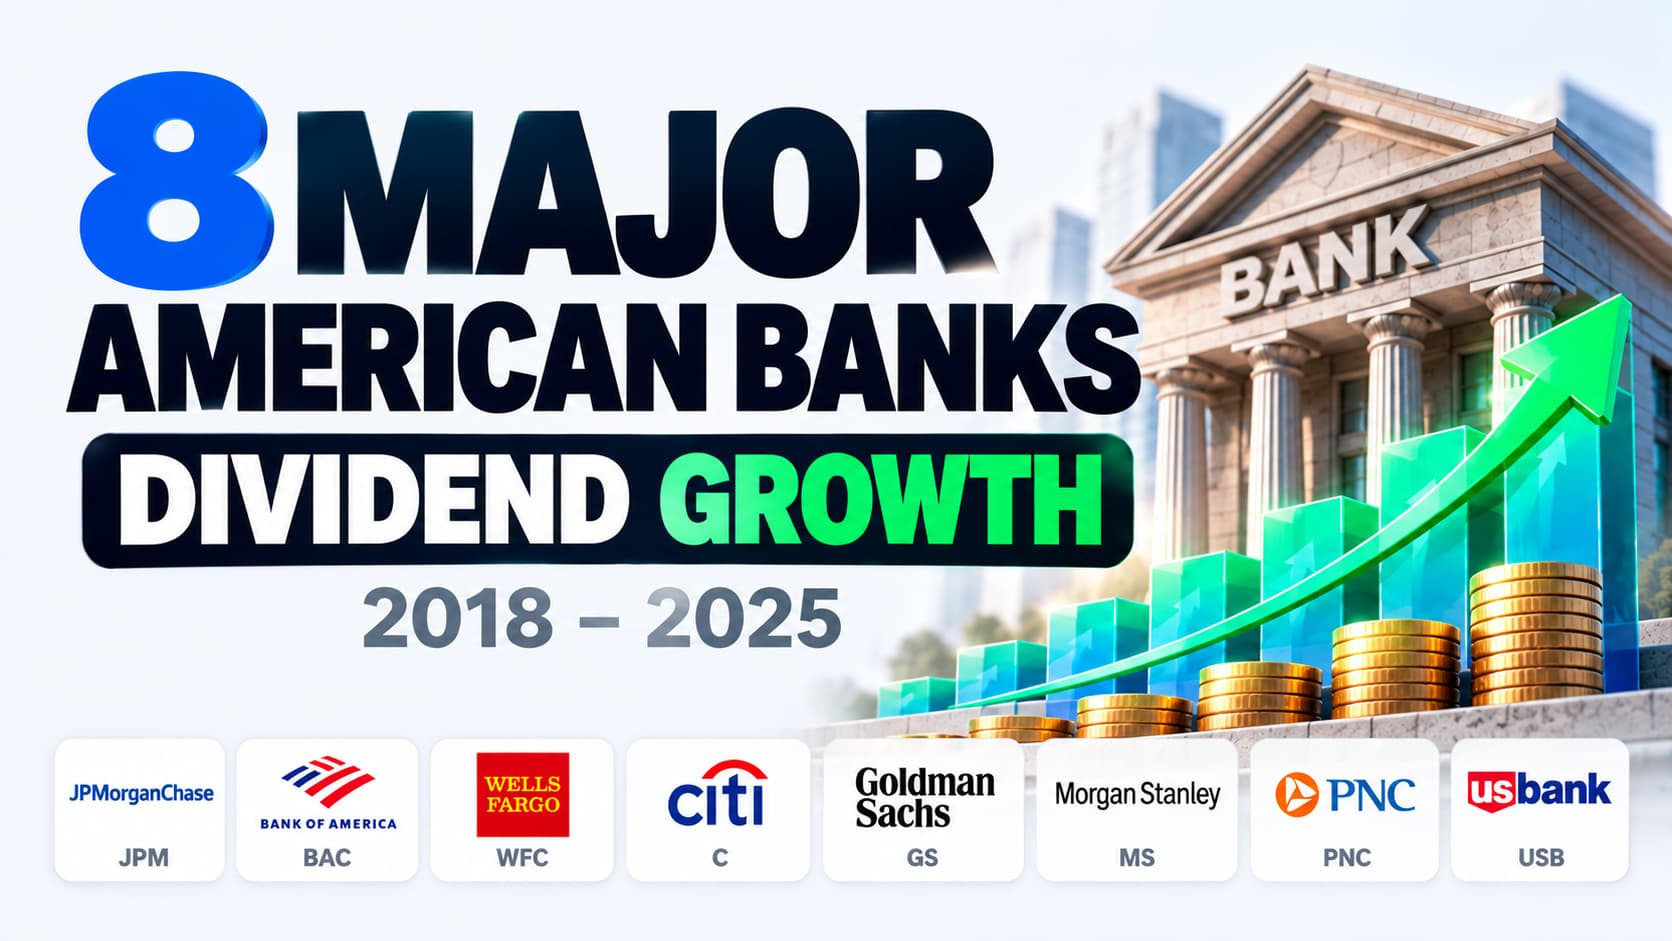
8 Major Bank Stocks Ranked by Dividend Growth (2018–2025)
How did JPM, BAC, WFC, C, GS, MS, PNC and USB grow their dividends from 2018 to 2025? Compare dividend growth, yield on cost and payout consistency across eight major U.S. banks.
Read more →Dividend Growth
Compare dividend growth across eight major U.S. banks from 2018 to 2025, including Goldman Sachs, Morgan Stanley, JPMorgan, and Wells Fargo.
Published October 12, 2026 · Updated October 12, 2026
Dividend Growth · Bank Stocks · Dividend Growth Ladder · Yield on Cost · U.S. Banks
Hover or focus a mark for details. Click or tap to pin. Press Escape to clear.
How differently did eight major American banks reward dividend investors between 2018 and 2025? This Dividend Growth Ladder compares the annual dividend histories of Goldman Sachs (GS), Morgan Stanley (MS), JPMorgan Chase (JPM), Bank of America (BAC), PNC Financial (PNC), U.S. Bancorp (USB), Citigroup (C), and Wells Fargo (WFC). Each company's dividend history starts at the same indexed level, making it easier to compare the pace and consistency of dividend growth regardless of the original dollar payment. The differences are substantial, from uninterrupted annual increases to extended periods of flat dividends and significant cuts.
Goldman Sachs recorded the highest annualized dividend growth rate at 23.75%, increasing its annual dividend by 344.44% between 2018 and 2025. Its normalized dividend ladder finished at 444.4, meaning its annual dividend reached approximately 4.44 times its 2018 level. Morgan Stanley followed with 19.60% annualized growth and a 250% cumulative increase. Both companies increased their annual dividends in every year-over-year comparison.
Despite ranking second in dividend growth, Morgan Stanley finished with the highest yield on cost at 7.38%, compared with 5.47% for Goldman Sachs. JPMorgan ranked third in dividend growth at 12.20%, followed by Bank of America at 10.41%, PNC at 9.94%, and U.S. Bancorp at 6.19%. All six companies increased their annual dividend payments in each consecutive year of the comparison. The distinction between dividend growth and yield on cost matters: the former measures payment growth, while the latter relates annual dividend income to the original purchase price.
Citigroup delivered 6.03% annualized dividend growth, but its annual dividend remained unchanged at $2.04 per share from 2020 through 2022. Wells Fargo experienced a more significant interruption, with annual dividend reductions in both 2020 and 2021. Although Wells Fargo subsequently increased its payments, its 2025 annual dividend of $1.70 remained below the $1.92 paid in 2019. Across the full period, Wells Fargo recorded just 0.51% annualized dividend growth and 3.66% cumulative growth. These histories illustrate why the path of dividend payments matters alongside the final growth rate.
Wells Fargo recorded the largest single year-over-year dividend increase in the comparison, at 83.33% in 2022. However, that increase followed two consecutive years of dividend cuts. By contrast, Morgan Stanley's largest annual increase was 50% in 2021, while Goldman Sachs recorded its largest increase of 38.46% in 2022. A large percentage increase can reflect recovery from a reduced payment rather than uninterrupted long-term growth.
The Dividend Growth Ladder compares annual cash dividends per share for eight U.S. banks over the 2018–2025 calendar years. Each company's annual dividend is normalized to its first included year, with 2018 set to a 100% base. Subsequent ladder heights represent dividend growth relative to that company's starting annual payment, not absolute dividend dollars or total investment returns. Dividend CAGR measures the annualized change between the first and last annual dividend amounts. Total dividend growth represents the cumulative percentage change over the same period. Both metrics are calculated by DividendXray from the supplied annual dividend histories. Starting yield and ending yield on cost use each company's recorded purchase price, based on January 2, 2018. Ending yield on cost measures the 2025 annual dividend relative to that original purchase price and should not be confused with current market dividend yield. Year-over-year changes distinguish dividend increases, unchanged payments, and reductions. The black outline identifies the year with the largest annual dividend increase for each company. All eight companies have complete annual dividend observations from 2018 through 2025. The visualization measures dividend payment growth only. It does not include share-price appreciation, dividend reinvestment, or total shareholder returns.
Data as of: October 12, 2026
How did JPM, BAC, WFC, C, GS, MS, PNC and USB grow their dividends from 2018 to 2025? Compare dividend growth, yield on cost and payout consistency across eight major U.S. banks.
Read more →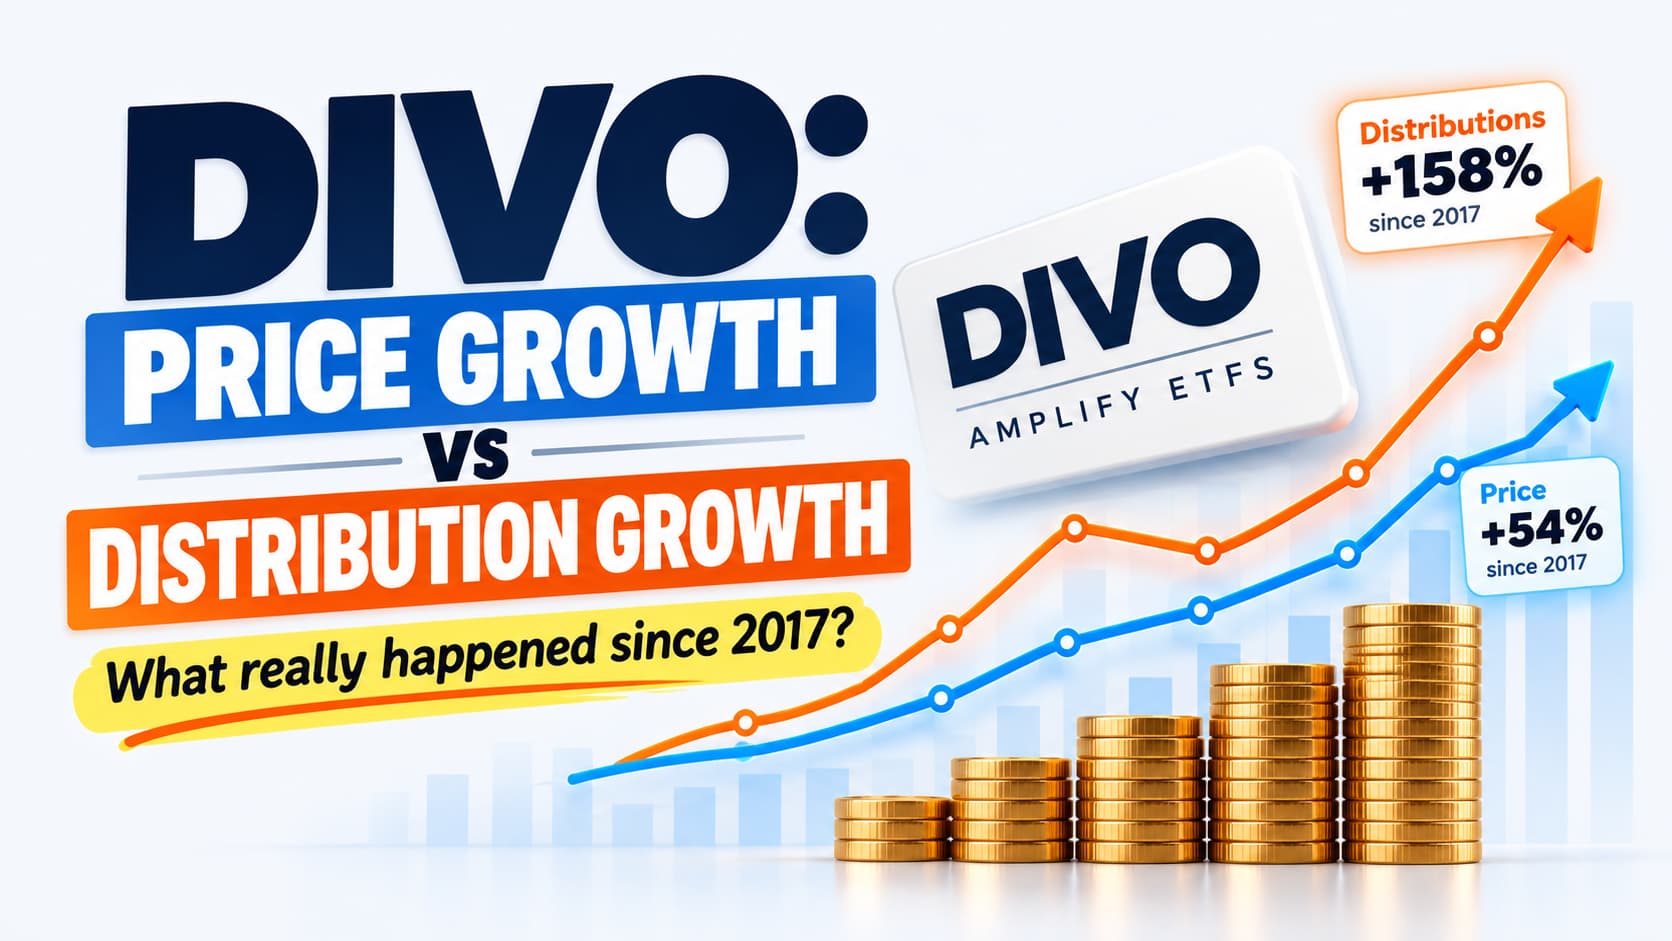
See how DIVO’s share price and annual distributions per share changed from 2017 to 2025, including distribution growth, yield on cost, and unusual year-end payments.
DIVO · Distribution Growth · Yield on Cost
Oct 4, 2026
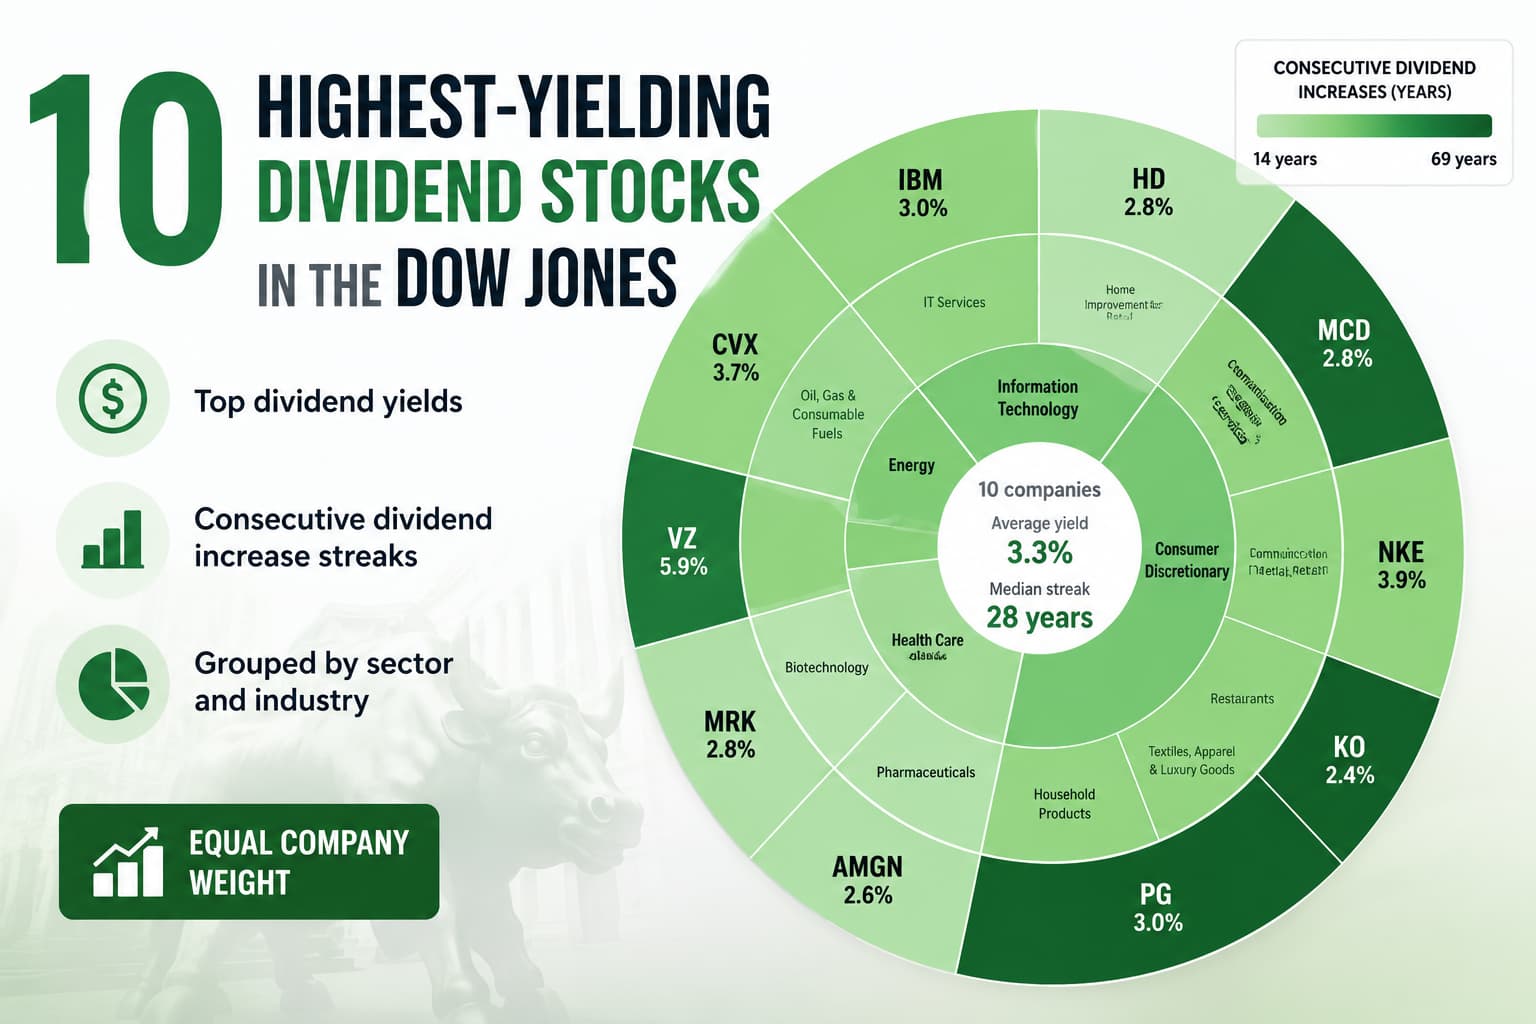
Explore the 10 highest-yielding dividend stocks in the Dow Jones Industrial Average with an interactive sunburst chart grouped by sector and industry. Compare dividend yields, consecutive dividend increase streaks, and sector composition.
Dow Jones · Dividend Yield · Dividend Growth
Aug 4, 2026
Project how your dividend income and portfolio could grow over time.
Open Calculator →See how dividend growth and reinvestment can compound over time.
Explore the Snowball →Compare how much you'd need to invest in different stocks or ETFs to reach a dividend income goal.
Calculate an Income Goal →Build a hypothetical dividend portfolio and see the income it could generate.
Open the Sandbox →Compare dividend stocks and ETFs head-to-head.
Start a Ticker Battle →Get notified when a new dividend visualization is published.