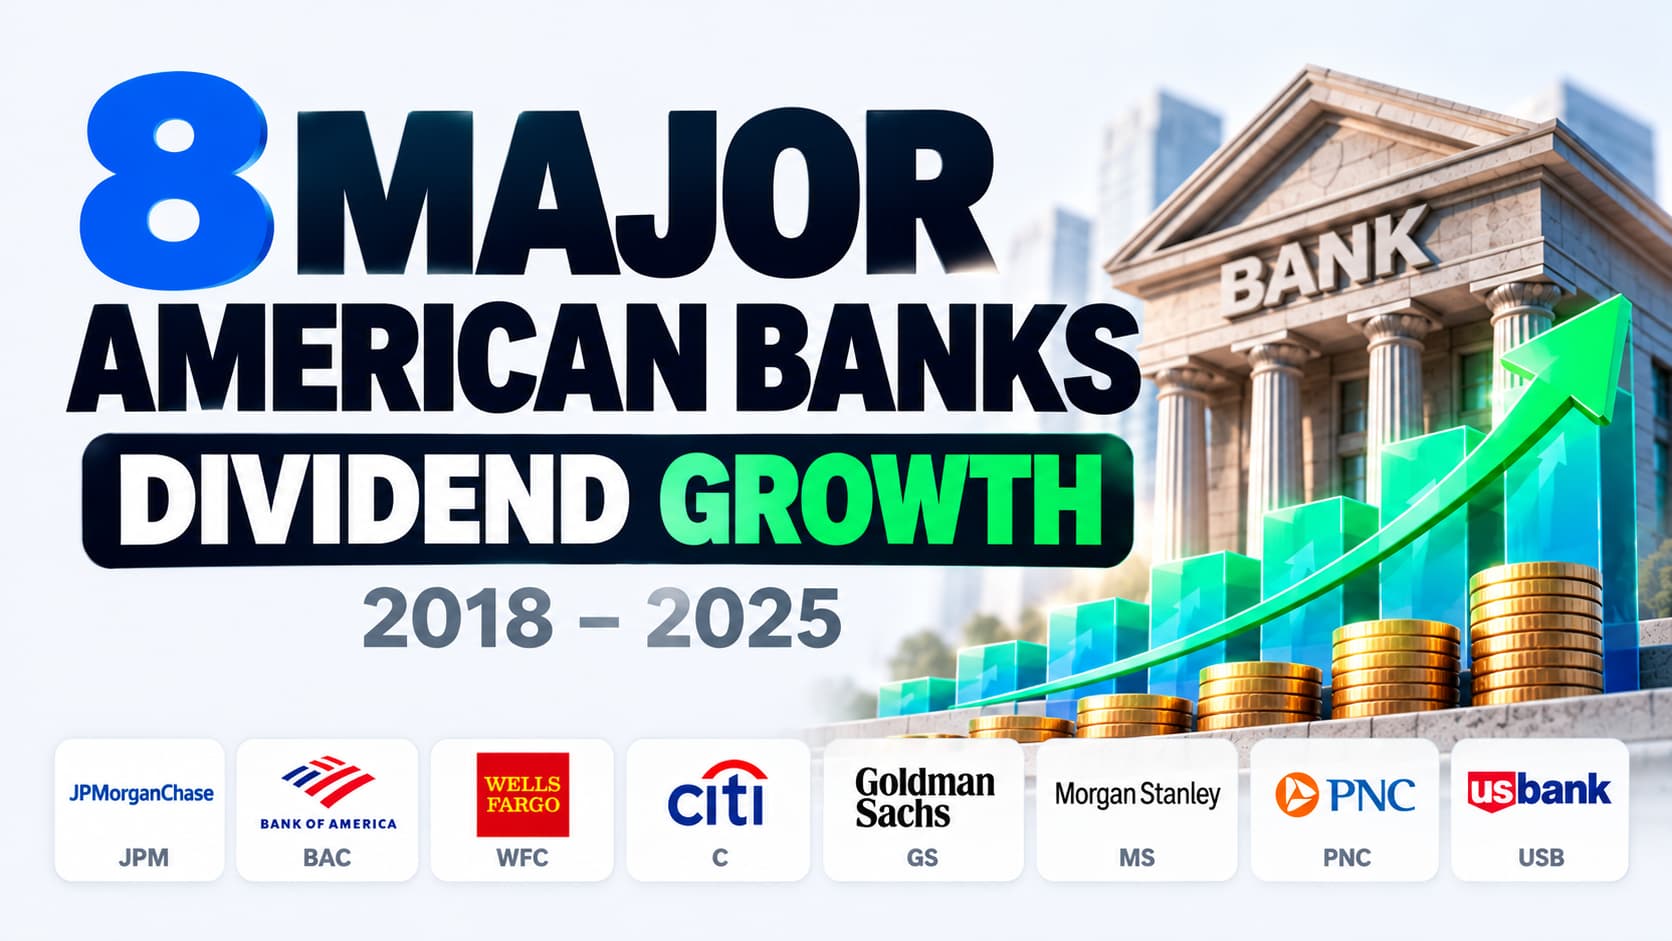
8 Major Bank Stocks Ranked by Dividend Growth (2018–2025)
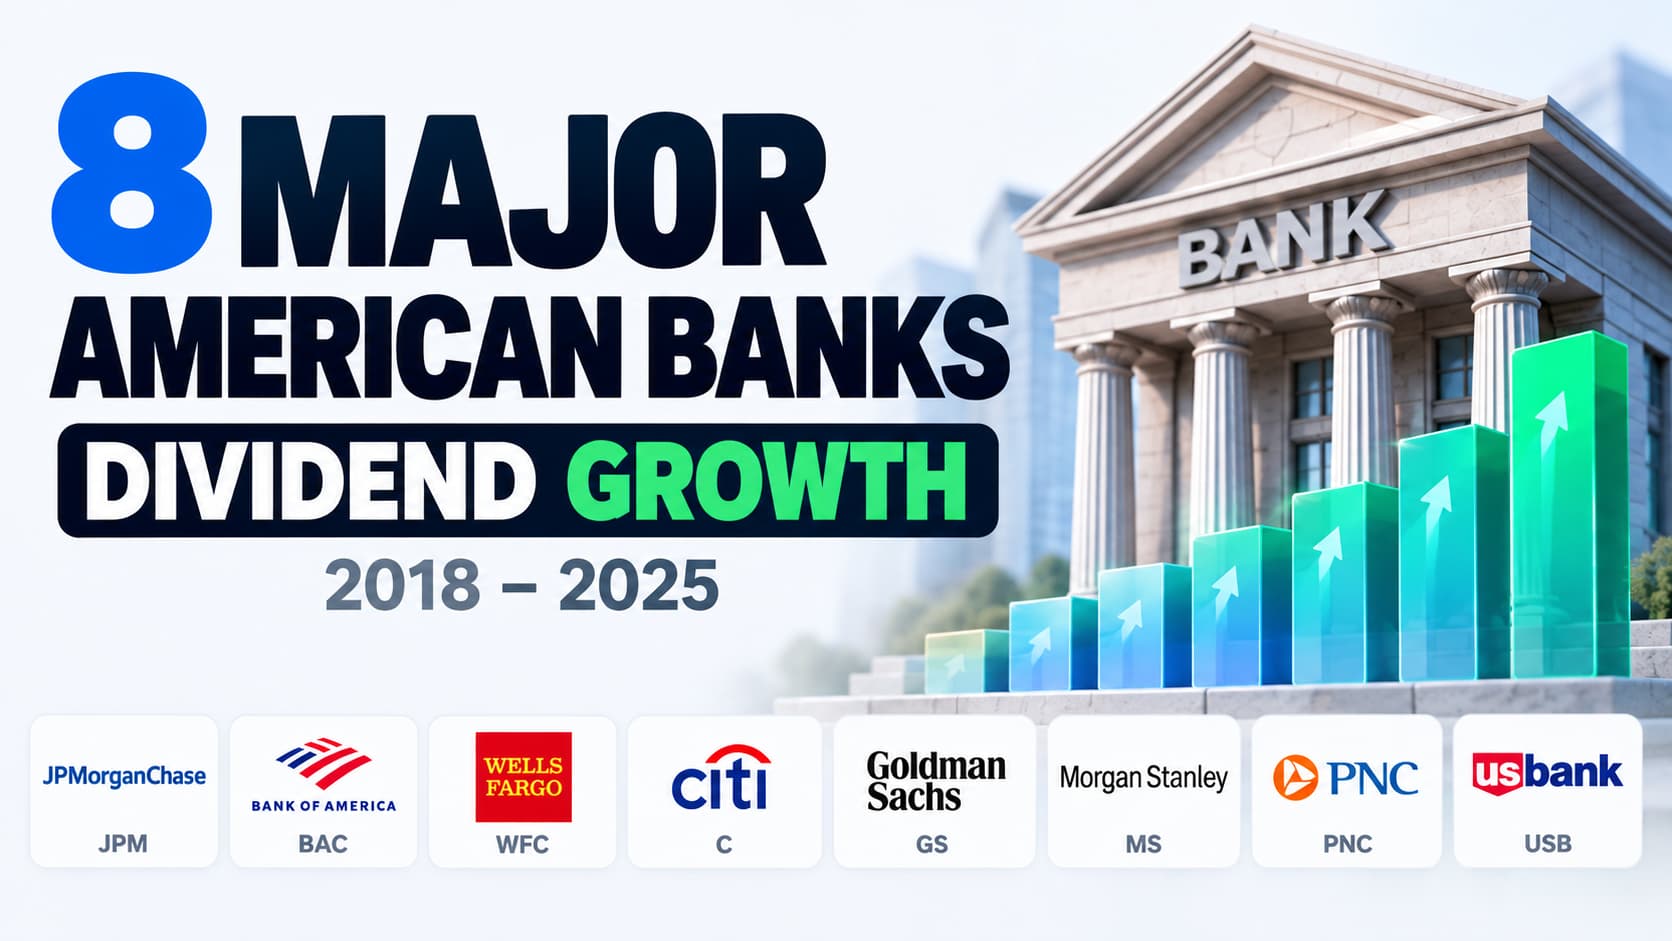
Dividend growth is one of the most important factors for long-term income investors. But even among major American banks, dividend growth can follow dramatically different paths.
From 2018 through 2025, eight prominent U.S. banks delivered very different results. Some more than tripled their annual dividend payments, while others experienced extended periods of stagnation or significant dividend reductions.
This analysis compares JPMorgan Chase (JPM), Bank of America (BAC), Wells Fargo (WFC), Citigroup (C), Goldman Sachs (GS), Morgan Stanley (MS), PNC Financial (PNC), and U.S. Bancorp (USB).
The goal isn't simply to identify which bank grew its dividend the fastest. It's to understand how dividend growth, payment consistency, and yield on cost can tell different stories about the income investors received.
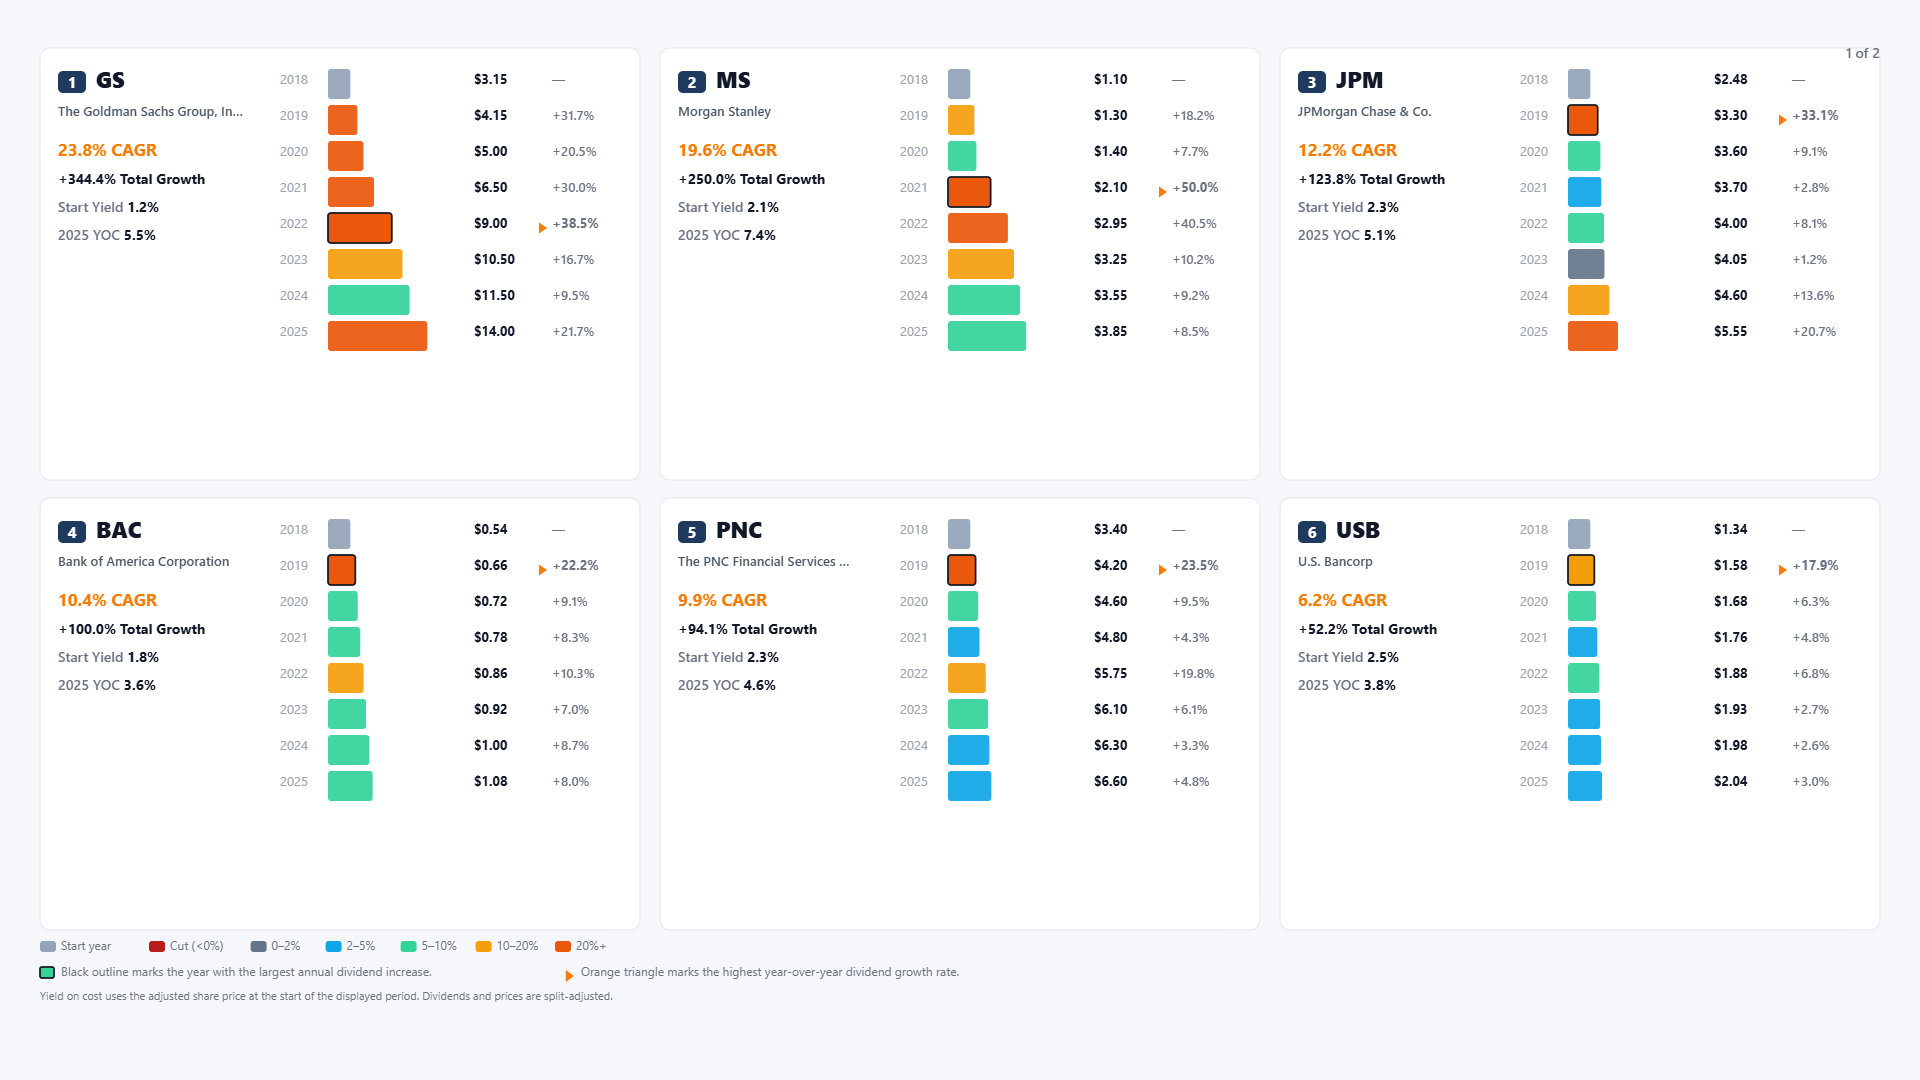
Goldman Sachs leads the eight-bank comparison with an annualized dividend growth rate of approximately 23.8% between 2018 and 2025.
Its annual dividend increased from $3.15 per share in 2018 to $14.00 in 2025, representing cumulative growth of more than 340%.
For an investor who purchased shares at the beginning of 2018, the annual yield on cost increased from approximately 1.2% to 5.5%.
Notably, Goldman Sachs continued increasing its annual dividend through the pandemic period, with particularly strong growth in 2022.
Morgan Stanley ranks second, delivering approximately 19.6% annualized dividend growth and a cumulative increase of 250%.
Its largest dividend increases occurred in 2021 and 2022. Despite finishing second in dividend growth, Morgan Stanley achieved the highest ending yield on cost in the comparison, at approximately 7.4%.
This highlights an important distinction: dividend growth measures how quickly payments increased, while yield on cost measures annual dividend income relative to an investor's original purchase price.
JPMorgan Chase ranks third, with approximately 12.2% annualized dividend growth. Its annual dividend more than doubled, increasing from $2.48 in 2018 to $5.55 in 2025.
Bank of America follows in fourth place, with approximately 10.4% annualized growth and a doubling of its annual dividend over the period.
PNC Financial and U.S. Bancorp complete the top six, delivering annualized growth rates of approximately 9.9% and 6.2%, respectively.
Their dividend growth was generally more moderate, with slower increases toward the end of the period.
Together, these six banks demonstrate that even within the same industry, long-term dividend growth can vary substantially.
The final two banks reveal why looking beyond a single dividend growth percentage is so important.
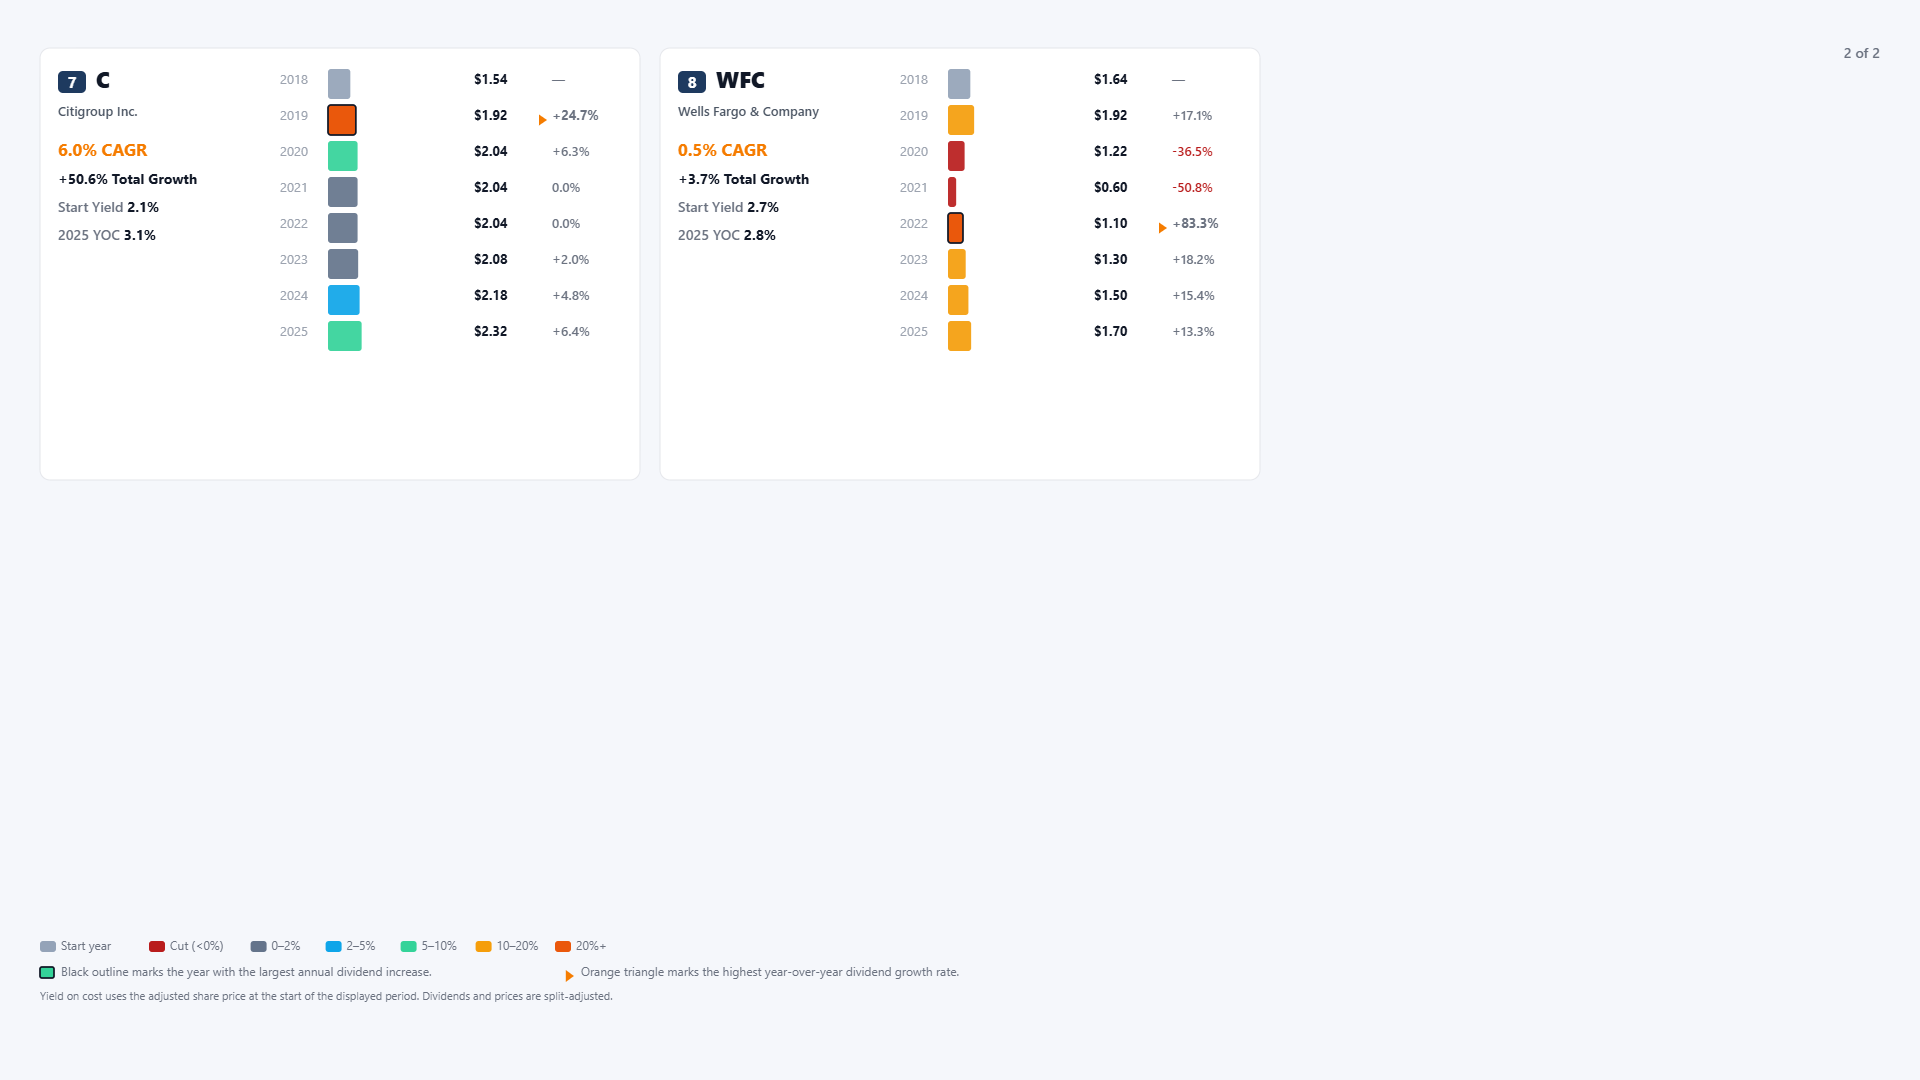
Citigroup ranks seventh, with approximately 6% annualized dividend growth.
Although its dividend increased over the full eight-year period, its annual payment remained unchanged at $2.04 per share from 2020 through 2022.
For income investors, this represents three consecutive years without an increase in annual dividend income.
Wells Fargo ranks eighth, with approximately 0.5% annualized dividend growth across the full period.
Its dividend history is particularly notable because of the sharp reduction during the pandemic.
After paying $1.92 per share in annual dividends in 2019, Wells Fargo reduced its payments significantly during 2020 and 2021. By 2021, shareholders received just $0.60 per share.
Although the bank subsequently rebuilt its dividend, its 2025 annual payment of $1.70 remained below the amount distributed in 2019.
This illustrates an important risk for dividend investors: a company can resume dividend increases after a cut without fully restoring the income shareholders previously received.
It also shows why the path of dividend growth matters, not just the starting and ending figures.
Final Takeaway
The eight-bank comparison highlights three important lessons for long-term dividend investors.
First, dividend growth rates can differ dramatically, even among established companies operating in the same industry.
Second, yield on cost and dividend growth are not interchangeable. Morgan Stanley finished with the highest yield on cost despite Goldman Sachs delivering the fastest annualized dividend growth.
Finally, dividend consistency matters. Periods of stagnant payments and dividend cuts can have lasting effects on an investor's income, even when payments eventually recover.
When evaluating dividend stocks, it is worth examining the complete payment history rather than relying only on the current yield or a single growth statistic.
For more visual comparisons of dividend growth, income history, and yield on cost, explore DividendXray.
This analysis is for educational purposes only and is not investment advice. Historical dividend performance does not guarantee future payments or growth.