Visa vs Mastercard vs CME vs S&P Global: 10-Year Dividend Battle
Portfolio Overview
In this DividendXray battle, we compare four major financial companies — Visa (V), Mastercard (MA), CME Group (CME), and S&P Global (SPGI) — across dividend growth, yield-on-cost expansion, and price return performance over a ten-year period.
Each company operates in a different part of the financial industry:
- Visa (V) operates one of the world's largest global payment networks, facilitating electronic transactions between consumers, merchants, and financial institutions.
- Mastercard (MA) connects consumers, businesses, and banks through its worldwide payments network, benefiting from the continued adoption of digital payments.
- CME Group (CME) operates major derivatives exchanges, offering futures and options across multiple asset classes. Its dividend policy combines regular quarterly payments with variable annual distributions.
- S&P Global (SPGI) provides credit ratings, financial data, and market intelligence, serving investors and financial institutions worldwide.
Although all four companies operate within the broader financial sector, their business models and dividend characteristics differ significantly.
Visa and Mastercard offer exposure to global payment activity, CME generates revenue through derivatives markets, and S&P Global operates across financial information, analytics, and credit ratings.
These differences make the comparison particularly interesting for dividend investors. A company delivering strong price appreciation may not necessarily provide the highest dividend income, while a higher-yielding stock may offer a different balance between current income and future growth.
The goal of this battle is to examine those tradeoffs across three perspectives: historical performance, today's income potential, and projected future dividend growth.
Category Winners
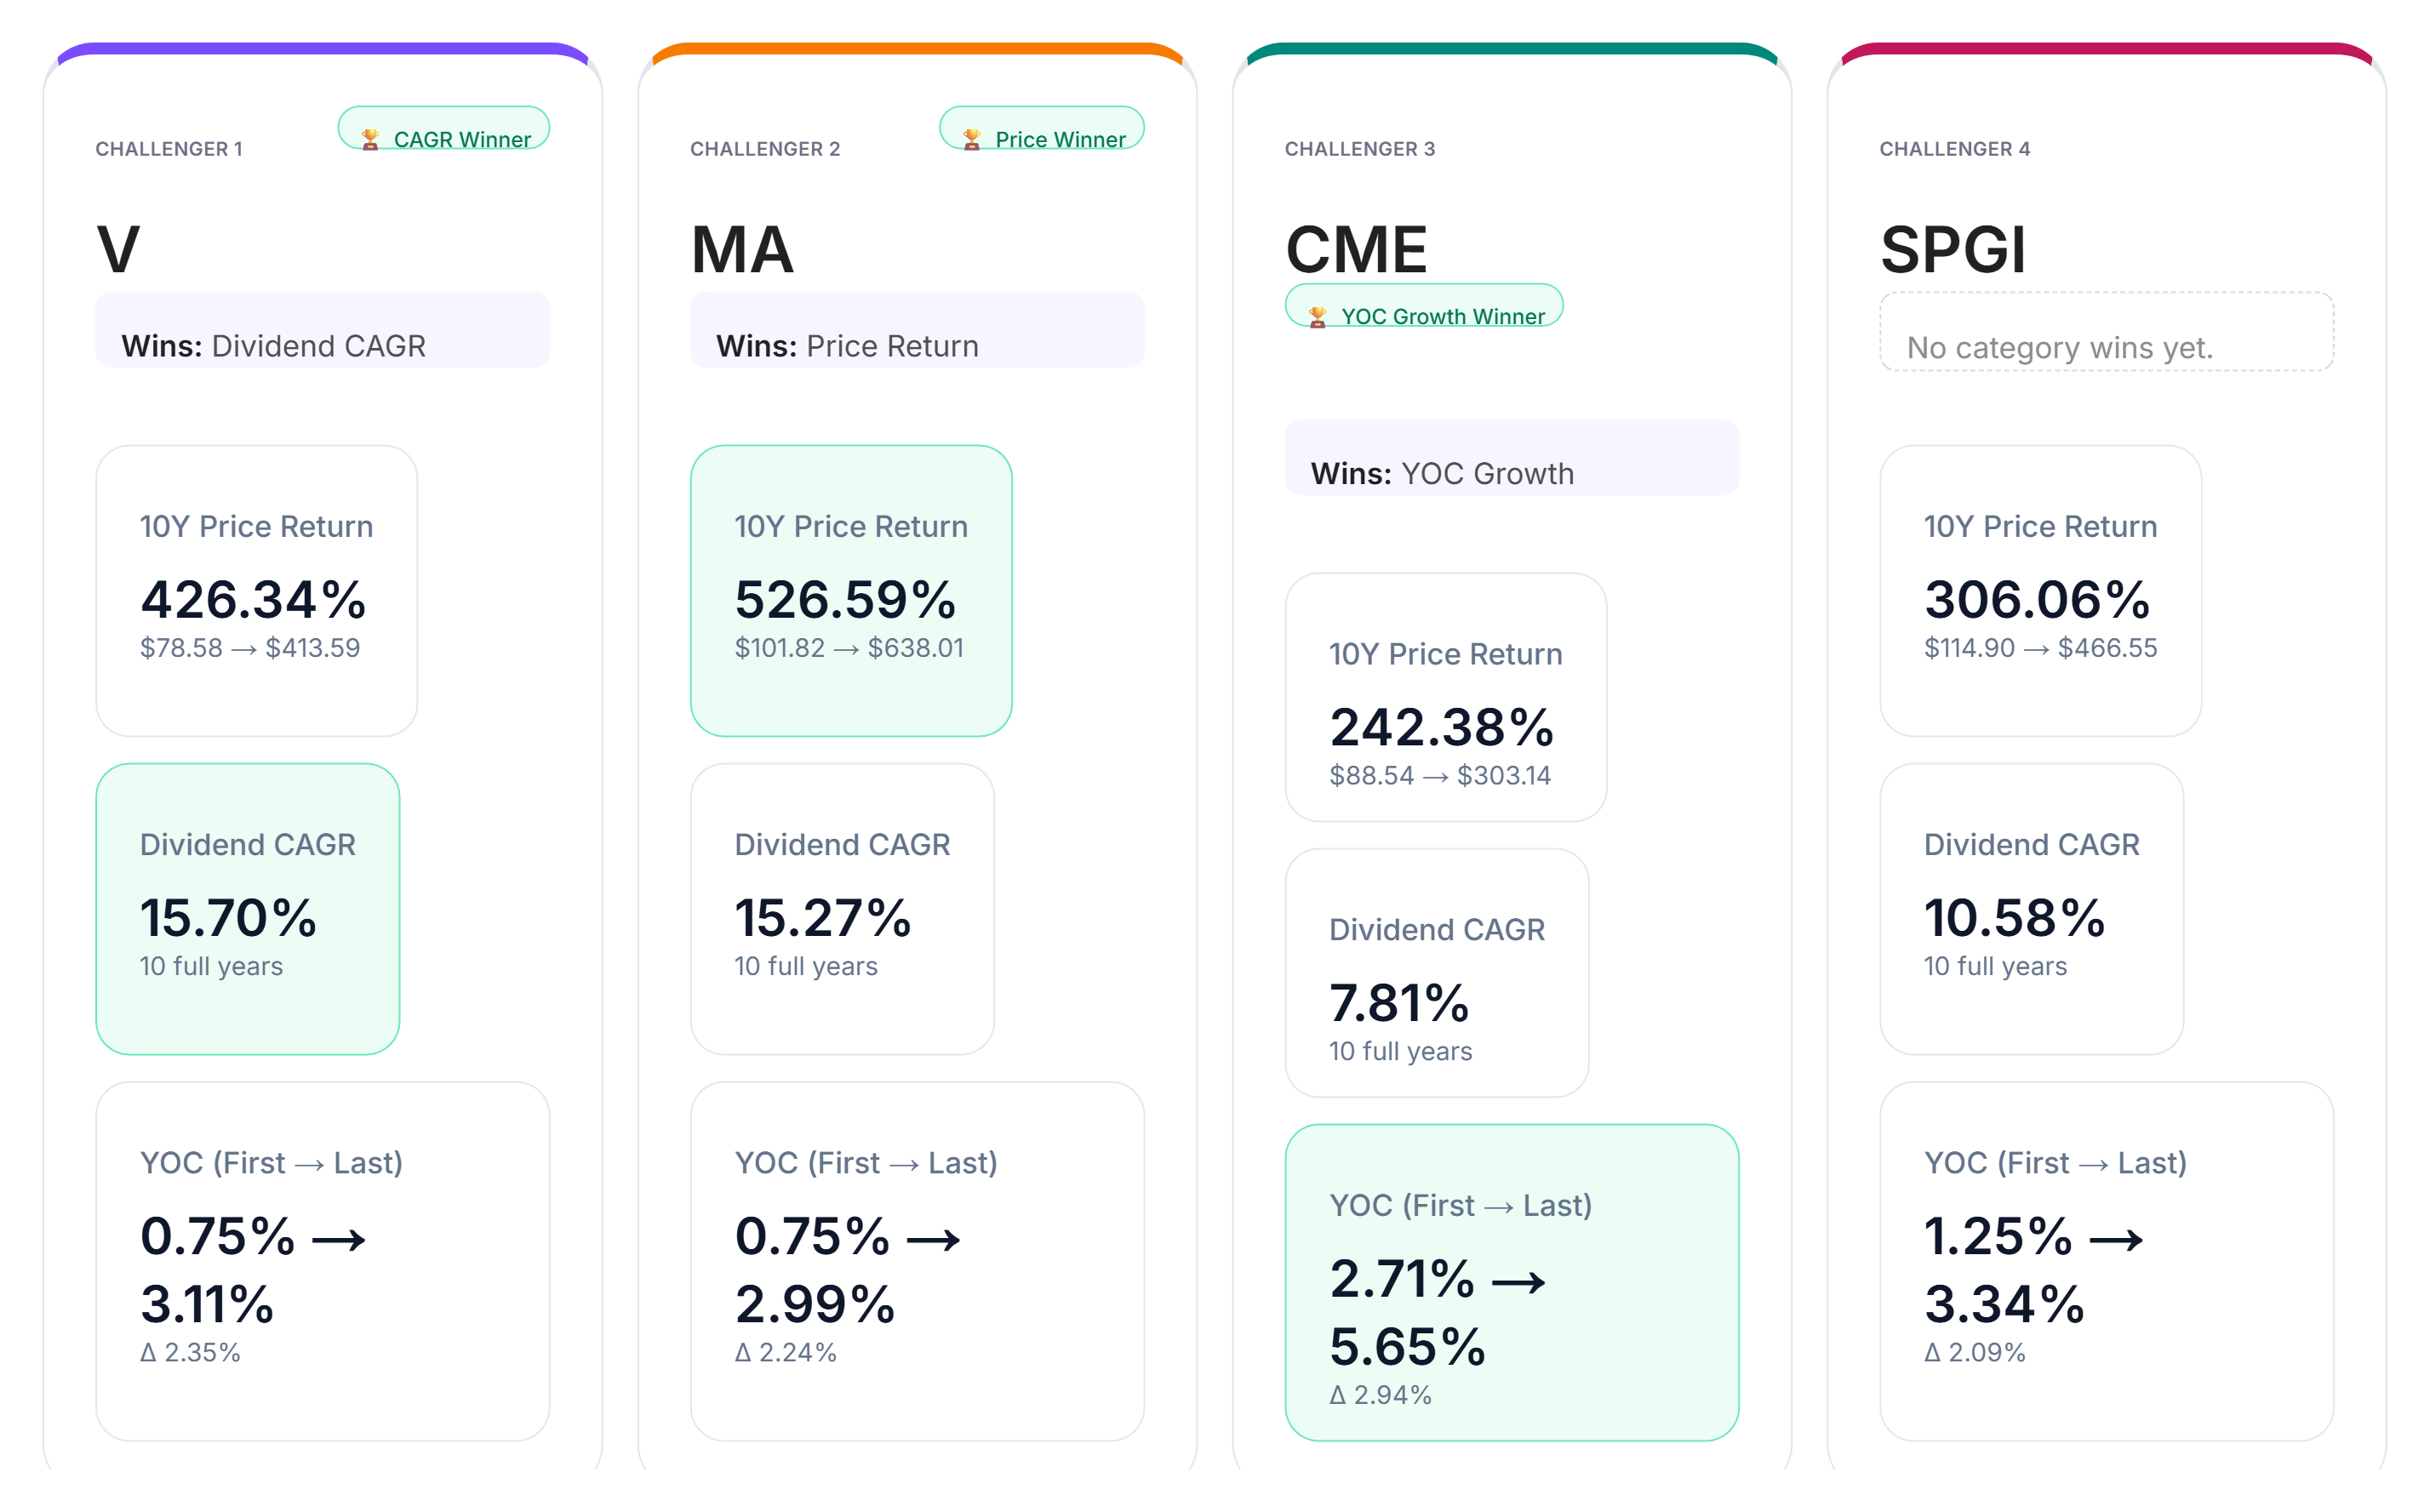
Looking at the ten-year results across dividend CAGR, yield-on-cost growth, and price return, three different category winners emerge.
In dividend growth, Visa leads the group with a ten-year dividend CAGR of 15.70%.
This reflects substantial historical growth in Visa's dividend payments, demonstrating how a relatively low-yielding company can still deliver meaningful income growth over time.
For yield-on-cost growth, CME Group shows the strongest improvement from the first year to the last.
CME's results reflect its combination of regular quarterly dividends and variable annual payments. These additional distributions contribute to its historical income advantage, although they should not be confused with guaranteed recurring income.
In price return, Mastercard takes the lead with an impressive 526.59% gain over the ten-year period.
This highlights a different dimension of shareholder returns. Mastercard's strongest result comes from share price appreciation rather than current dividend income.
S&P Global delivers solid results across the comparison but does not secure an individual category win.
The results reveal an important distinction: the strongest dividend grower, the strongest yield-on-cost performer, and the strongest price performer are three different companies.
For dividend investors, this illustrates why evaluating a stock through a single metric can provide an incomplete picture.
Yield-on-Cost by Year
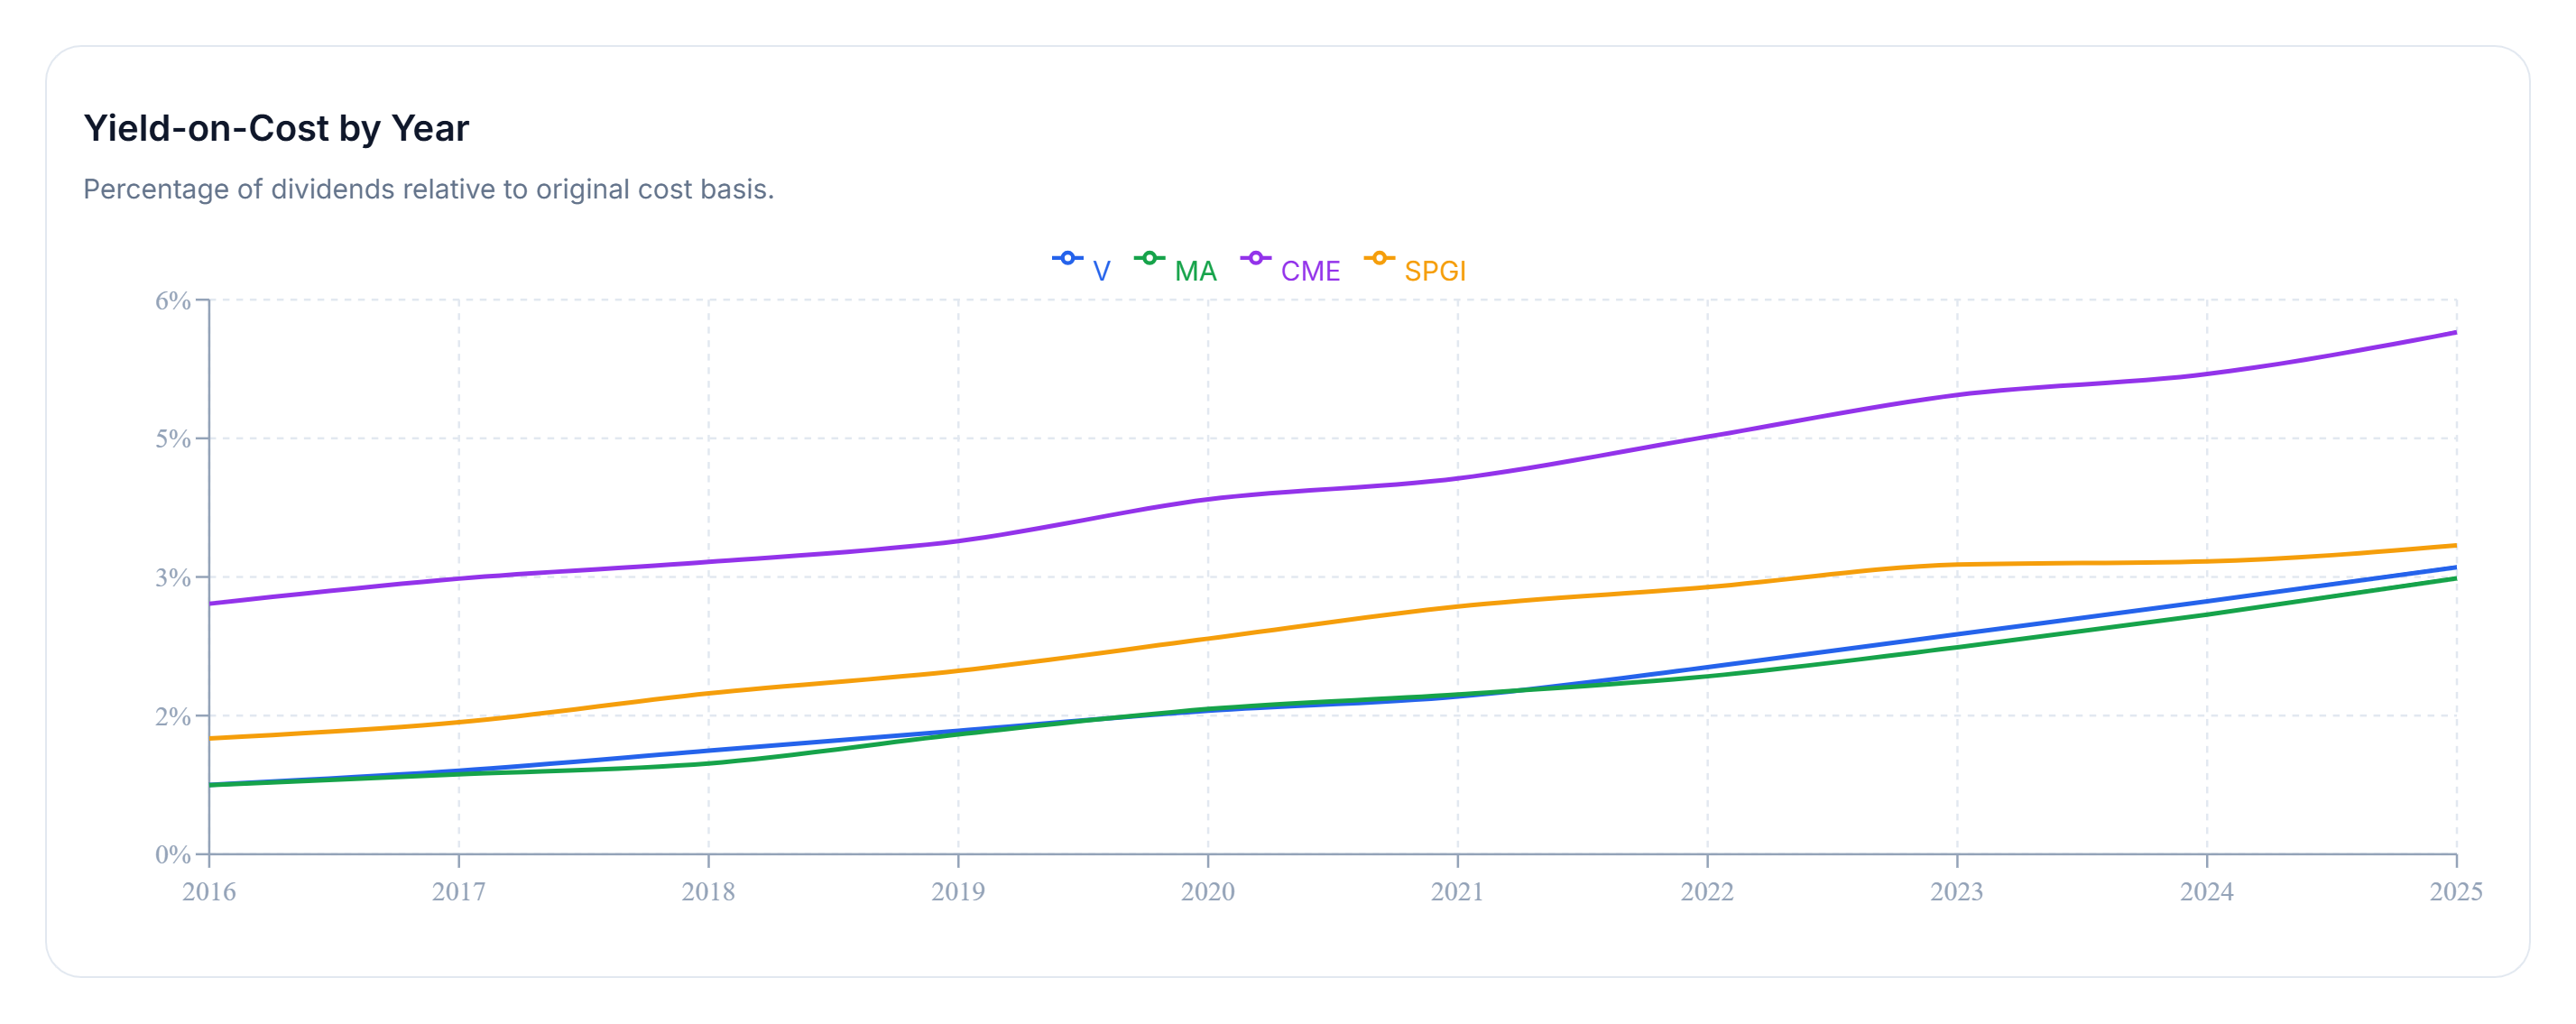
Yield on cost measures annual dividend income relative to the original investment amount. Unlike current dividend yield, it tracks how much income an investment generates compared with its original purchase cost.
This makes it particularly useful when evaluating dividend growth over longer periods.
Across the ten-year window, CME Group stands out with the strongest income efficiency, reaching approximately 5.65% yield on cost by the final year.
However, there is an important distinction behind CME's results.
Unlike companies that rely primarily on regular quarterly dividends, CME also distributes variable annual dividends. These payments contribute to the historical yield-on-cost figures and can significantly increase the income received in a particular year.
As a result, CME's historical income advantage does not necessarily represent a stable or predictable future income stream.
Visa, Mastercard, and S&P Global demonstrate more gradual upward income trends over the same period.
Their trajectories illustrate how dividend growth can steadily increase income relative to the original investment, even when starting yields are comparatively low.
For long-term investors, these differences matter.
A higher starting yield can provide an immediate income advantage, while faster dividend growth can gradually improve income efficiency over time.
But historical yield on cost is only one part of the picture. Investors planning to fund living expenses with dividends also need to understand how much capital each investment requires at today's yields.
Now let's shift from ten years of historical performance to today's income picture — and examine what it would take to generate a specific monthly dividend income target.
Income Goal Comparison
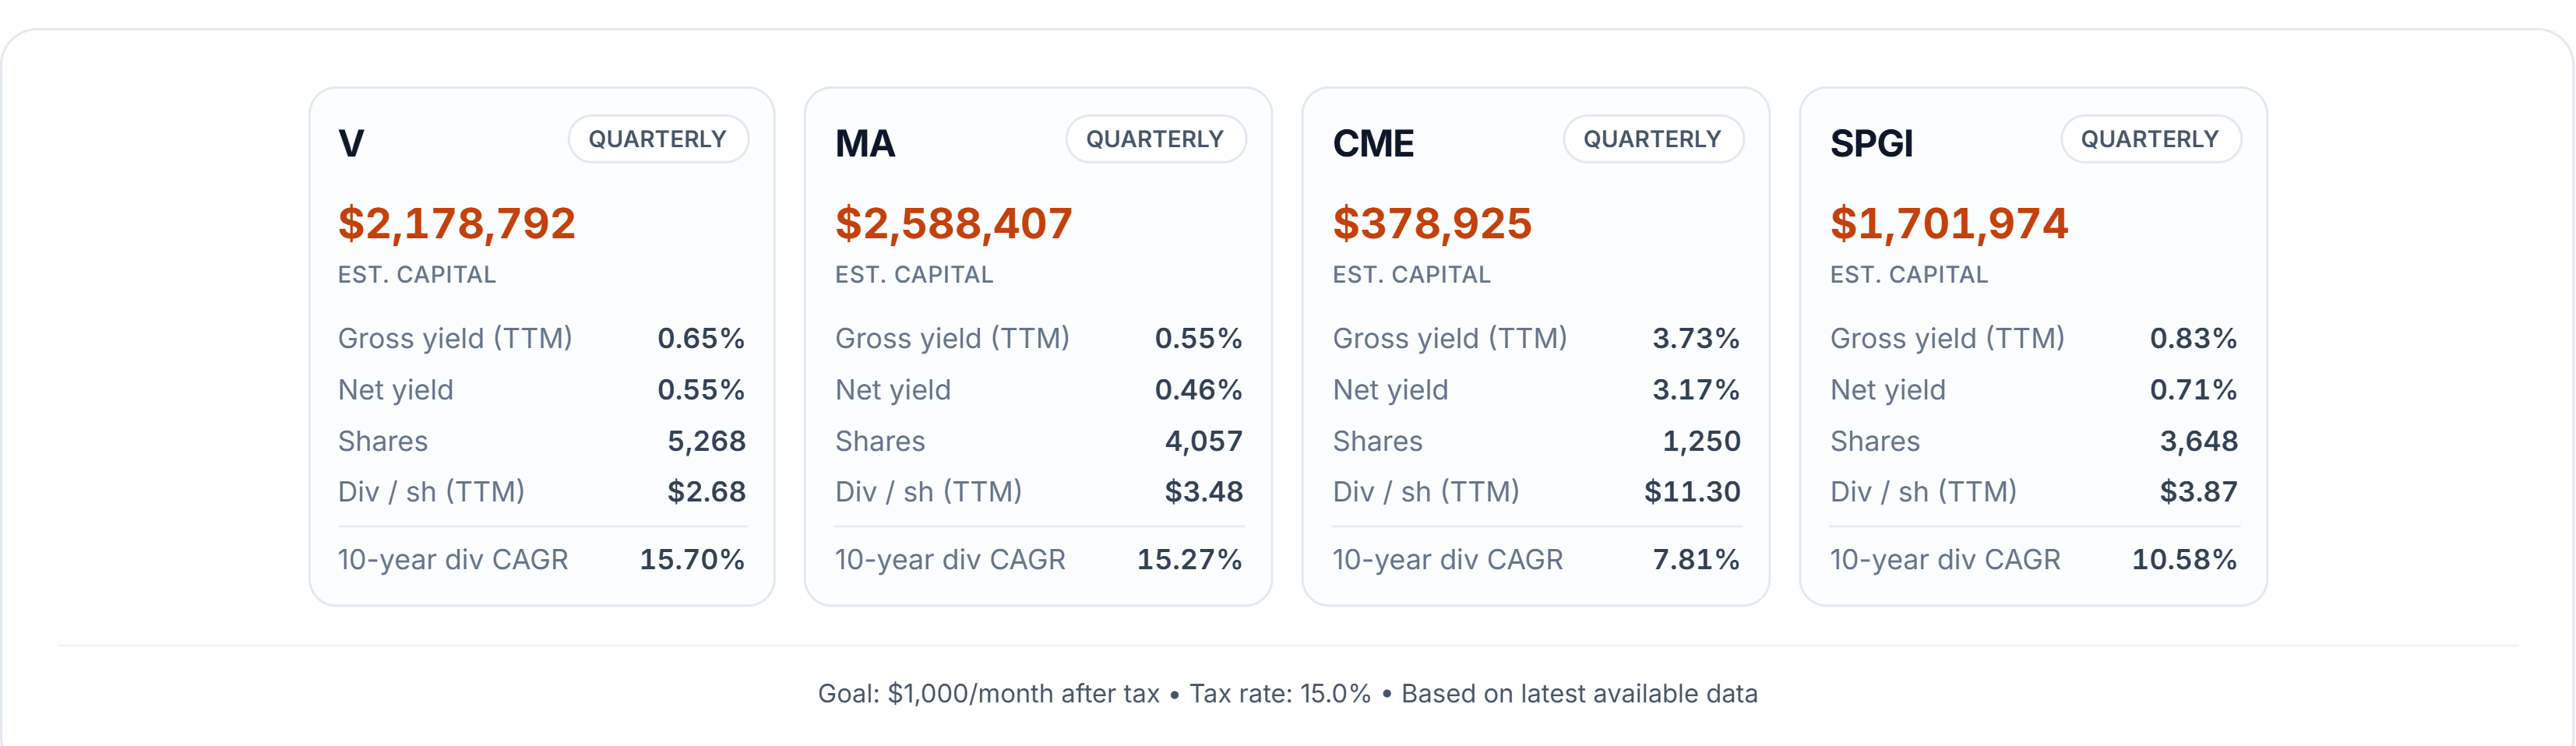
How much capital would you need to generate $1,000 per month in after-tax dividend income from each of these four financial companies?
The answer depends heavily on current dividend yields and the tax assumptions applied to those payments.
Using a 15% dividend tax assumption, the comparison reveals a substantial difference between the highest-yielding and lowest-yielding holdings.
CME Group requires the least capital, at approximately $379,000, based on its trailing dividend yield of around 3.7%.
At the other extreme, Mastercard requires nearly $2.6 million, reflecting its much lower starting dividend yield.
Visa and S&P Global fall between these two extremes in the capital required to achieve the same monthly income goal.
The contrast demonstrates how dramatically current dividend yield can influence the amount of invested capital needed to support an income target.
Understanding CME's Variable Dividend
There is an especially important detail behind CME's apparent income advantage.
CME's approximately 3.7% trailing twelve-month dividend yield includes a $6.15 annual variable dividend.
Its regular quarterly dividend of $1.30, by comparison, represents an annualized yield of approximately 1.7%.
This distinction matters because the variable annual dividend is not guaranteed to repeat at the same amount.
Consequently, CME's approximately $379,000 capital requirement is based on its total trailing dividend yield, not solely on its regular recurring quarterly payments.
Investors relying on dividends to cover ongoing expenses should distinguish between income received historically and income that may be more dependable going forward.
Current Income vs. Dividend Growth
The comparison presents two very different approaches to dividend investing.
A higher-yielding company such as CME may provide substantially more dividend income relative to the capital invested today, particularly when variable distributions are included.
Lower-yielding companies such as Visa and Mastercard may appeal more to investors prioritizing historical dividend growth and capital appreciation.
Neither approach is automatically superior.
For someone seeking immediate income, starting yield can be a critical consideration.
For an investor with a much longer time horizon, the rate at which dividends grow may become increasingly important.
That raises the next question: Can faster dividend growth eventually overcome the advantage of a higher starting yield?
Yield Catch-Up Timeline
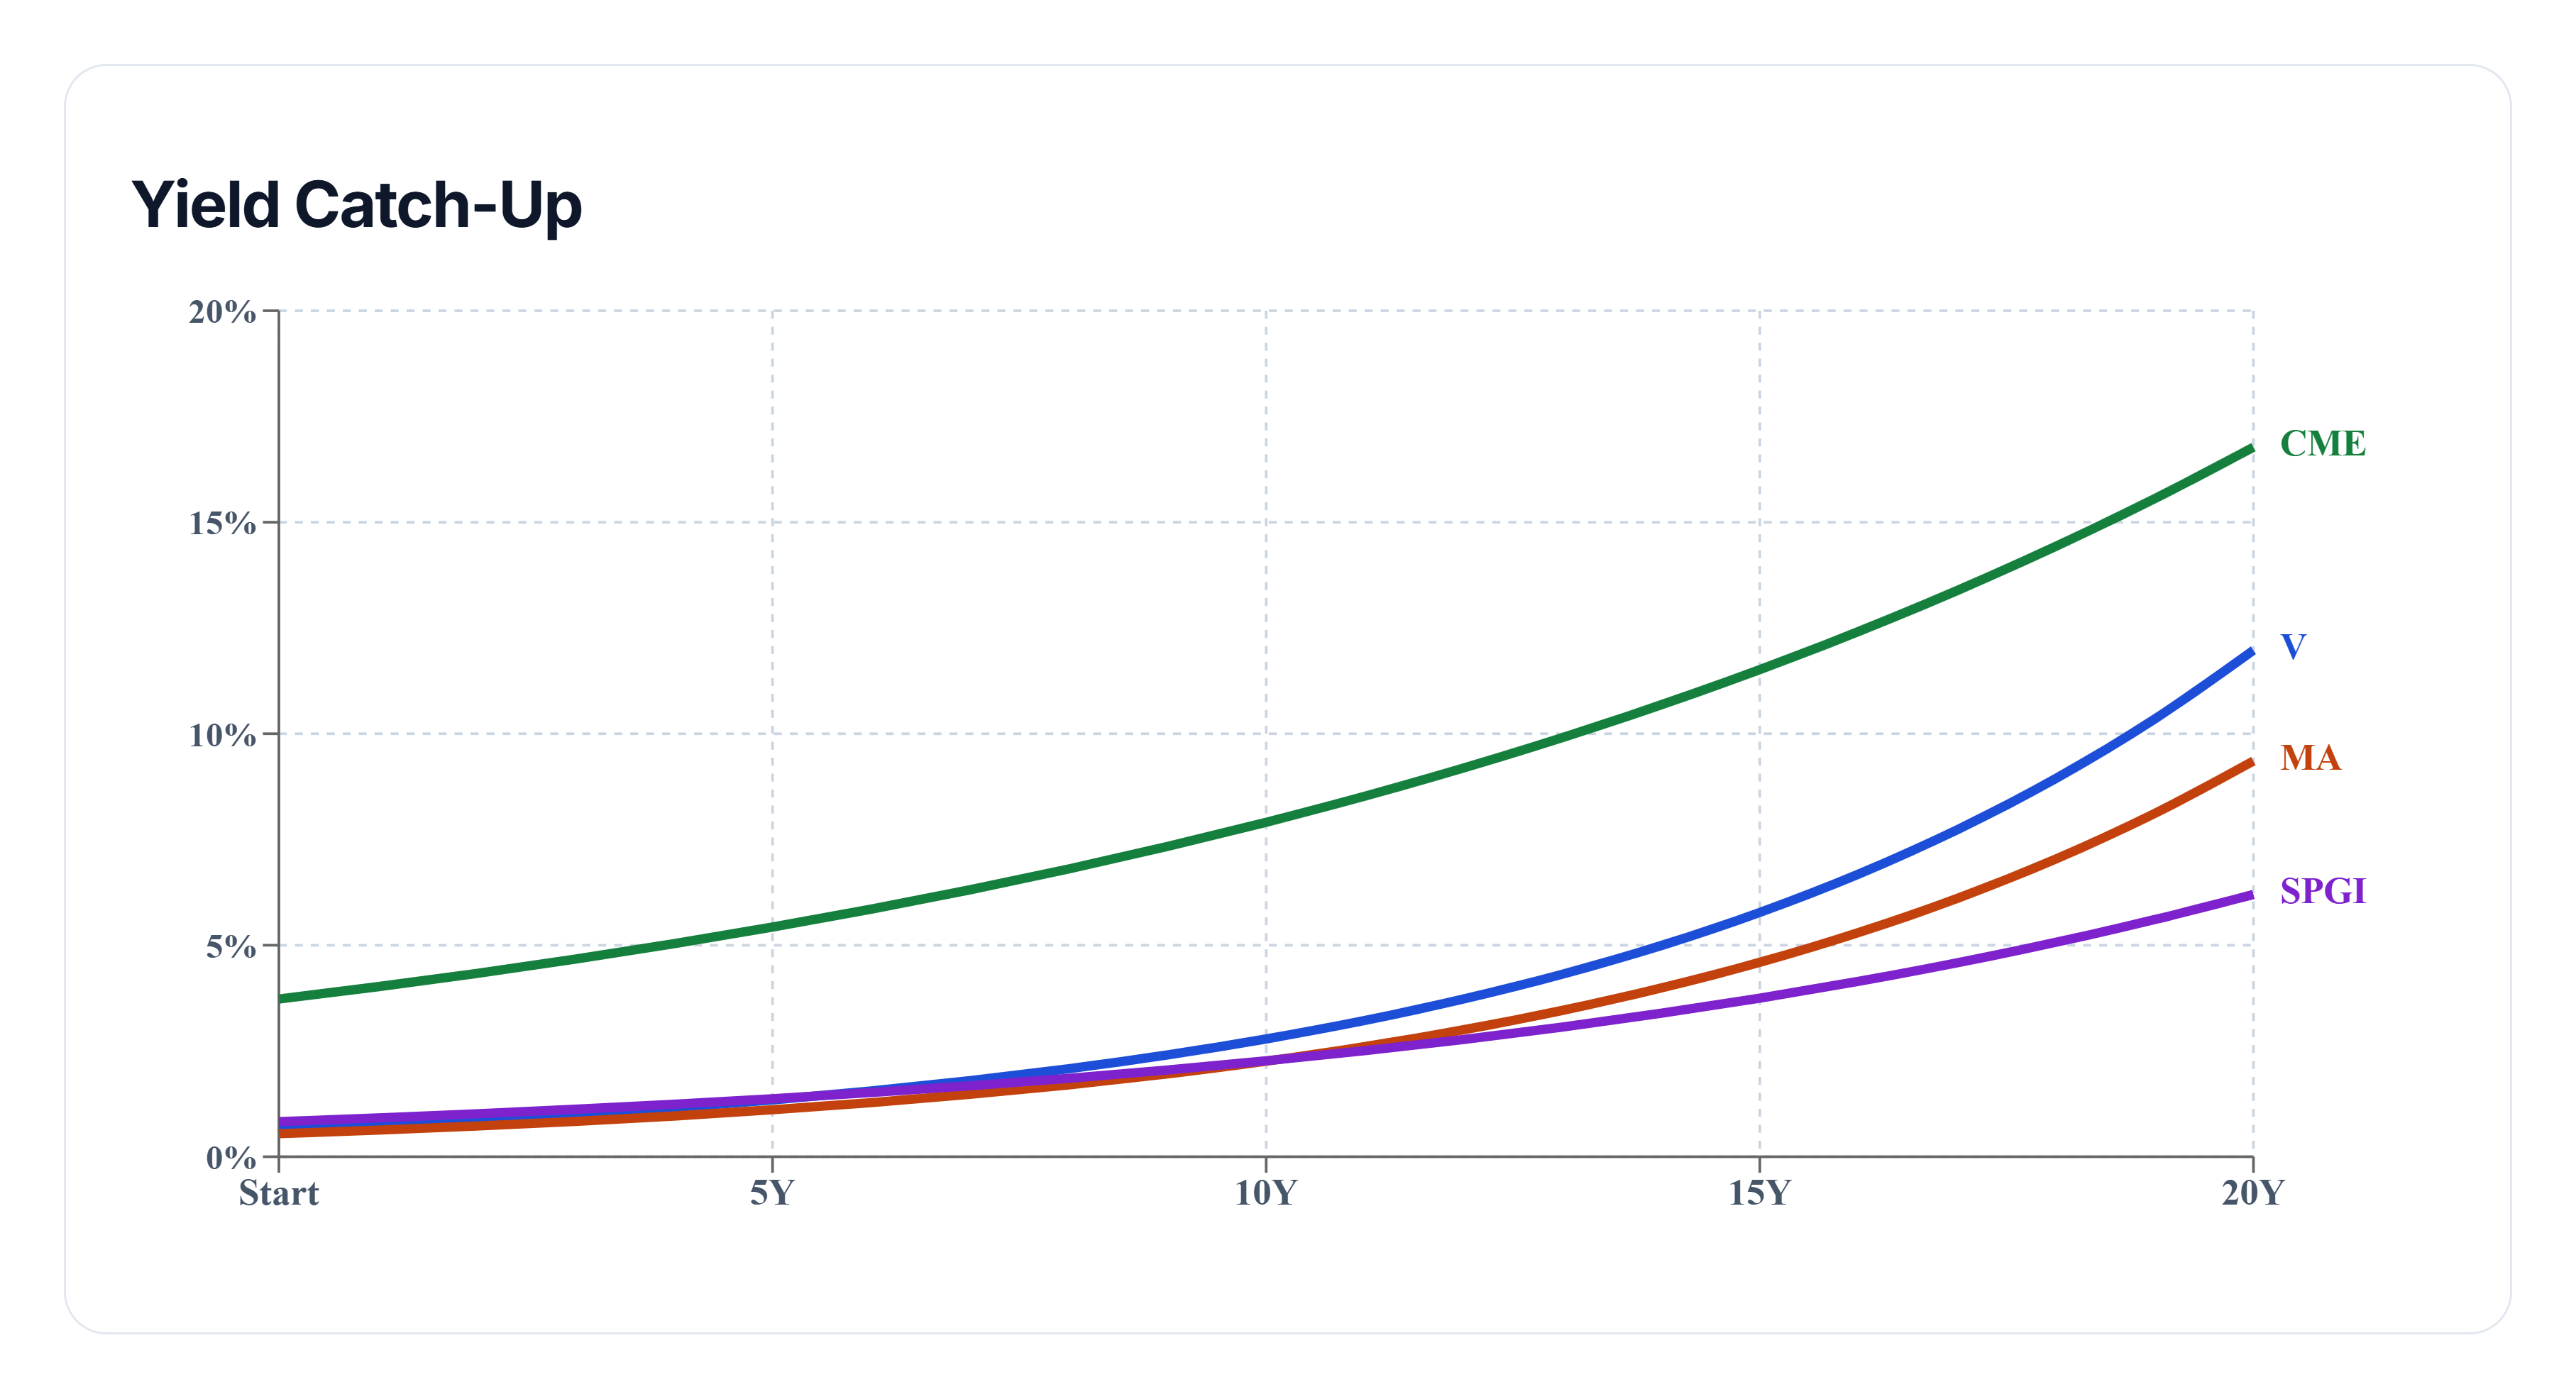
The yield catch-up projection explores how dividend income could evolve if each company's future dividend growth continued at a rate similar to its historical ten-year dividend CAGR.
Rather than predicting actual future payouts, the model illustrates the mathematical relationship between starting yield and dividend growth.
Visa leads in modeled dividend growth, using its historical rate of approximately 15.7%.
CME, meanwhile, begins with the highest trailing dividend yield at approximately 3.7%, including its variable annual dividend.
Mastercard starts considerably lower, with a yield near 0.5%.
The difference in starting yields creates a substantial initial income gap.
Even when a lower-yielding company grows its dividend rapidly, it can take many years for that growth to overcome a higher initial yield.
In this particular projection, Mastercard's yield on cost still does not catch CME's after 20 years.
This is an important result because it demonstrates that strong dividend growth does not automatically translate into higher dividend income within a particular investment horizon.
However, the projection also has limitations.
It assumes historical dividend growth rates continue into the future, which may not happen.
CME's variable annual distributions introduce additional uncertainty. If those payments decline or change substantially, the projected income advantage could look very different.
Similarly, Visa, Mastercard, and S&P Global may experience changes in their future dividend growth rates.
The catch-up timeline should therefore be understood as an illustration of possible income trajectories under fixed assumptions, rather than a prediction of future results.
For dividend investors, the key question is not simply which company grows its dividend fastest, but whether that growth is sufficient to meet their income objectives within their intended time horizon.
Final Takeaway
This DividendXray battle demonstrates that even within the same broad financial sector, companies can deliver very different investment outcomes.
Visa leads in dividend growth, with a ten-year dividend CAGR of 15.70%.
Mastercard leads in price appreciation, delivering a ten-year price return of 526.59%.
CME Group leads in historical yield-on-cost growth, reaching approximately 5.65% by the end of the comparison period.
S&P Global remains a solid participant in the comparison without taking an individual category win.
When today's income requirements are added to the analysis, the differences become even more significant.
CME requires considerably less capital to achieve the modeled $1,000 monthly after-tax dividend target, but its trailing yield includes variable annual distributions that may not be repeated.
Mastercard requires substantially more capital today, despite its impressive historical price performance.
And when future dividend growth is modeled over 20 years, the starting yield advantage remains important: Mastercard still does not catch CME's projected yield on cost under the assumptions used.
The broader lesson is that dividend growth, current income, and price appreciation are related but distinct investment objectives.
A company can excel in one area without leading in the others.
Ultimately, the most appropriate choice depends on whether an investor prioritizes generating income today, growing that income over time, maximizing capital appreciation, or combining these objectives within a diversified portfolio.
Historical performance and modeled projections are not guarantees of future results.