$100K Financial Dividend Portfolio: JPM, BLK, TROW & MS

Portfolio Overview
This portfolio is built around established financial institutions with a focus on dividend growth, asset management, and capital markets income. It combines JPMorgan Chase (JPM), BlackRock (BLK), T. Rowe Price (TROW), and Morgan Stanley (MS) to create a diversified financial-sector dividend portfolio designed for long-term cash flow generation.
JPM provides diversified banking and financial exposure supported by one of the largest financial institutions in the world. BLK contributes global asset management strength through its dominant investment platform and ETF ecosystem. TROW enhances the portfolio with long-term investment management income and shareholder distributions, while MS adds wealth management and capital markets exposure with strong recent dividend growth.
Dividend Growth Trend
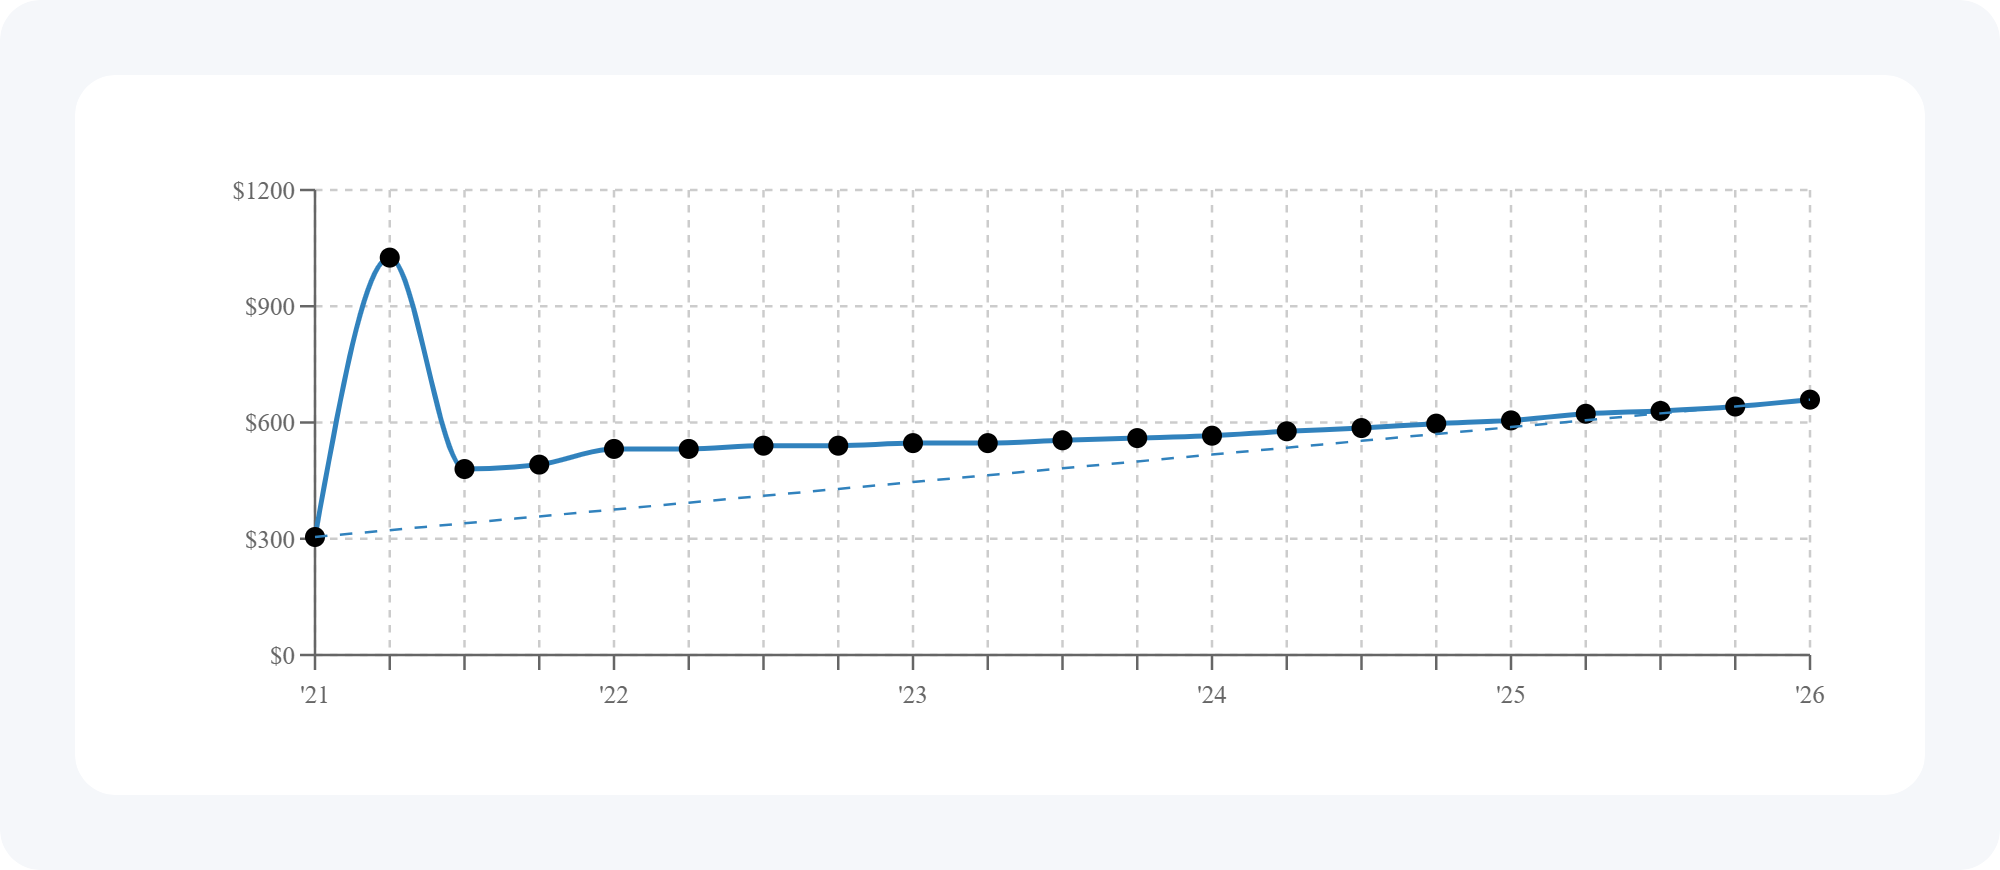
Here's the dividend growth trend for these holdings over the last five years.
One important detail in this portfolio is the temporary spike caused by a large special dividend paid by T. Rowe Price in 2021. Because that one-time payout is included in the historical comparison period, the portfolio’s reported dividend growth rate appears materially lower than the underlying regular dividend trend would otherwise suggest.
Excluding that temporary payout, the portfolio’s long-term dividend growth profile would likely appear significantly stronger.
Portfolio Snapshot
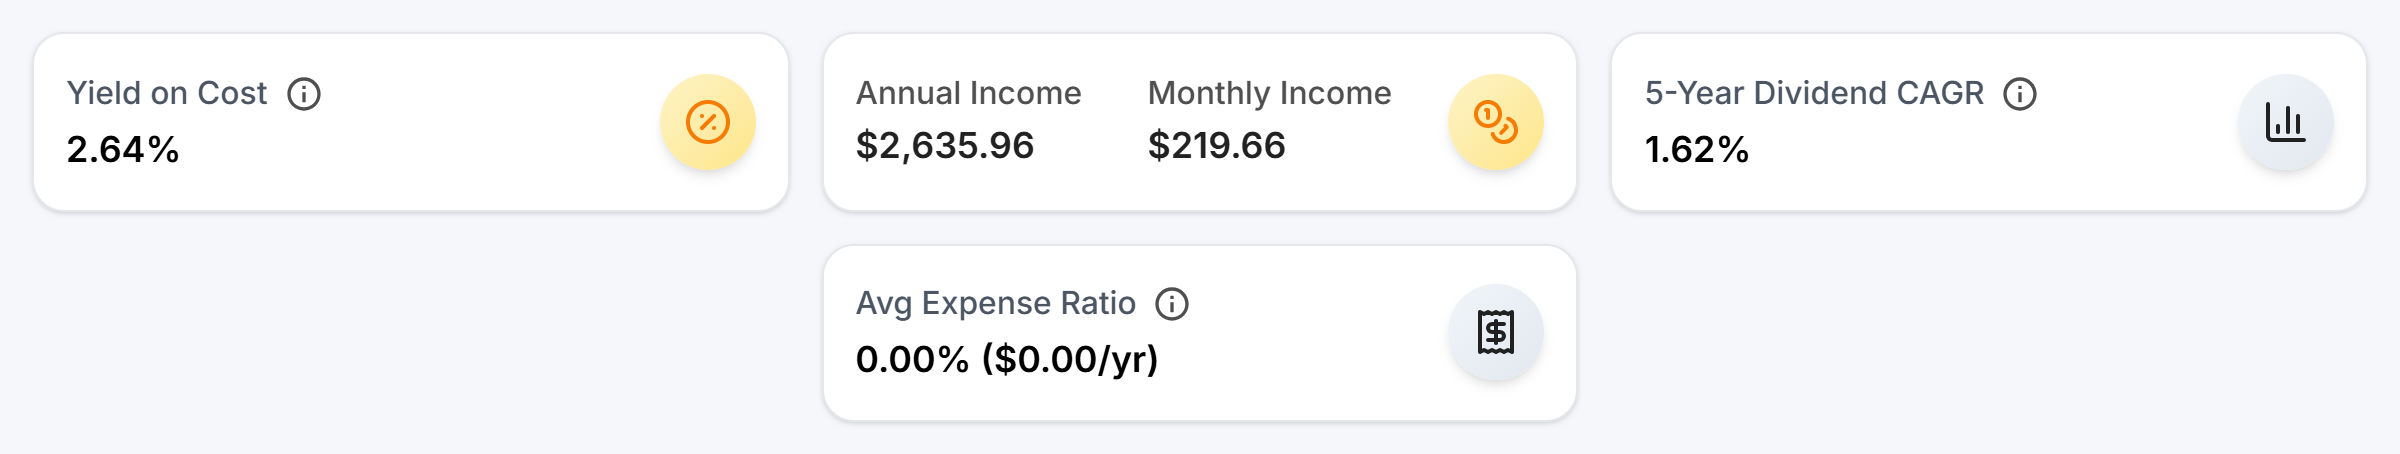
Here's the quick snapshot for this portfolio:
- Yield on cost: 2.6%
- Annual dividend income: $2,636 per year
- Monthly dividend income: about $220 per month
- Dividend income growth: roughly 1.6% per year over five years
- Average ETF expense ratio: 0% (no ETF'S)
This portfolio emphasizes dividend-paying financial companies with exposure to banking, wealth management, and asset management businesses that can potentially grow cash flow over time.
Income Breakdown by Holding
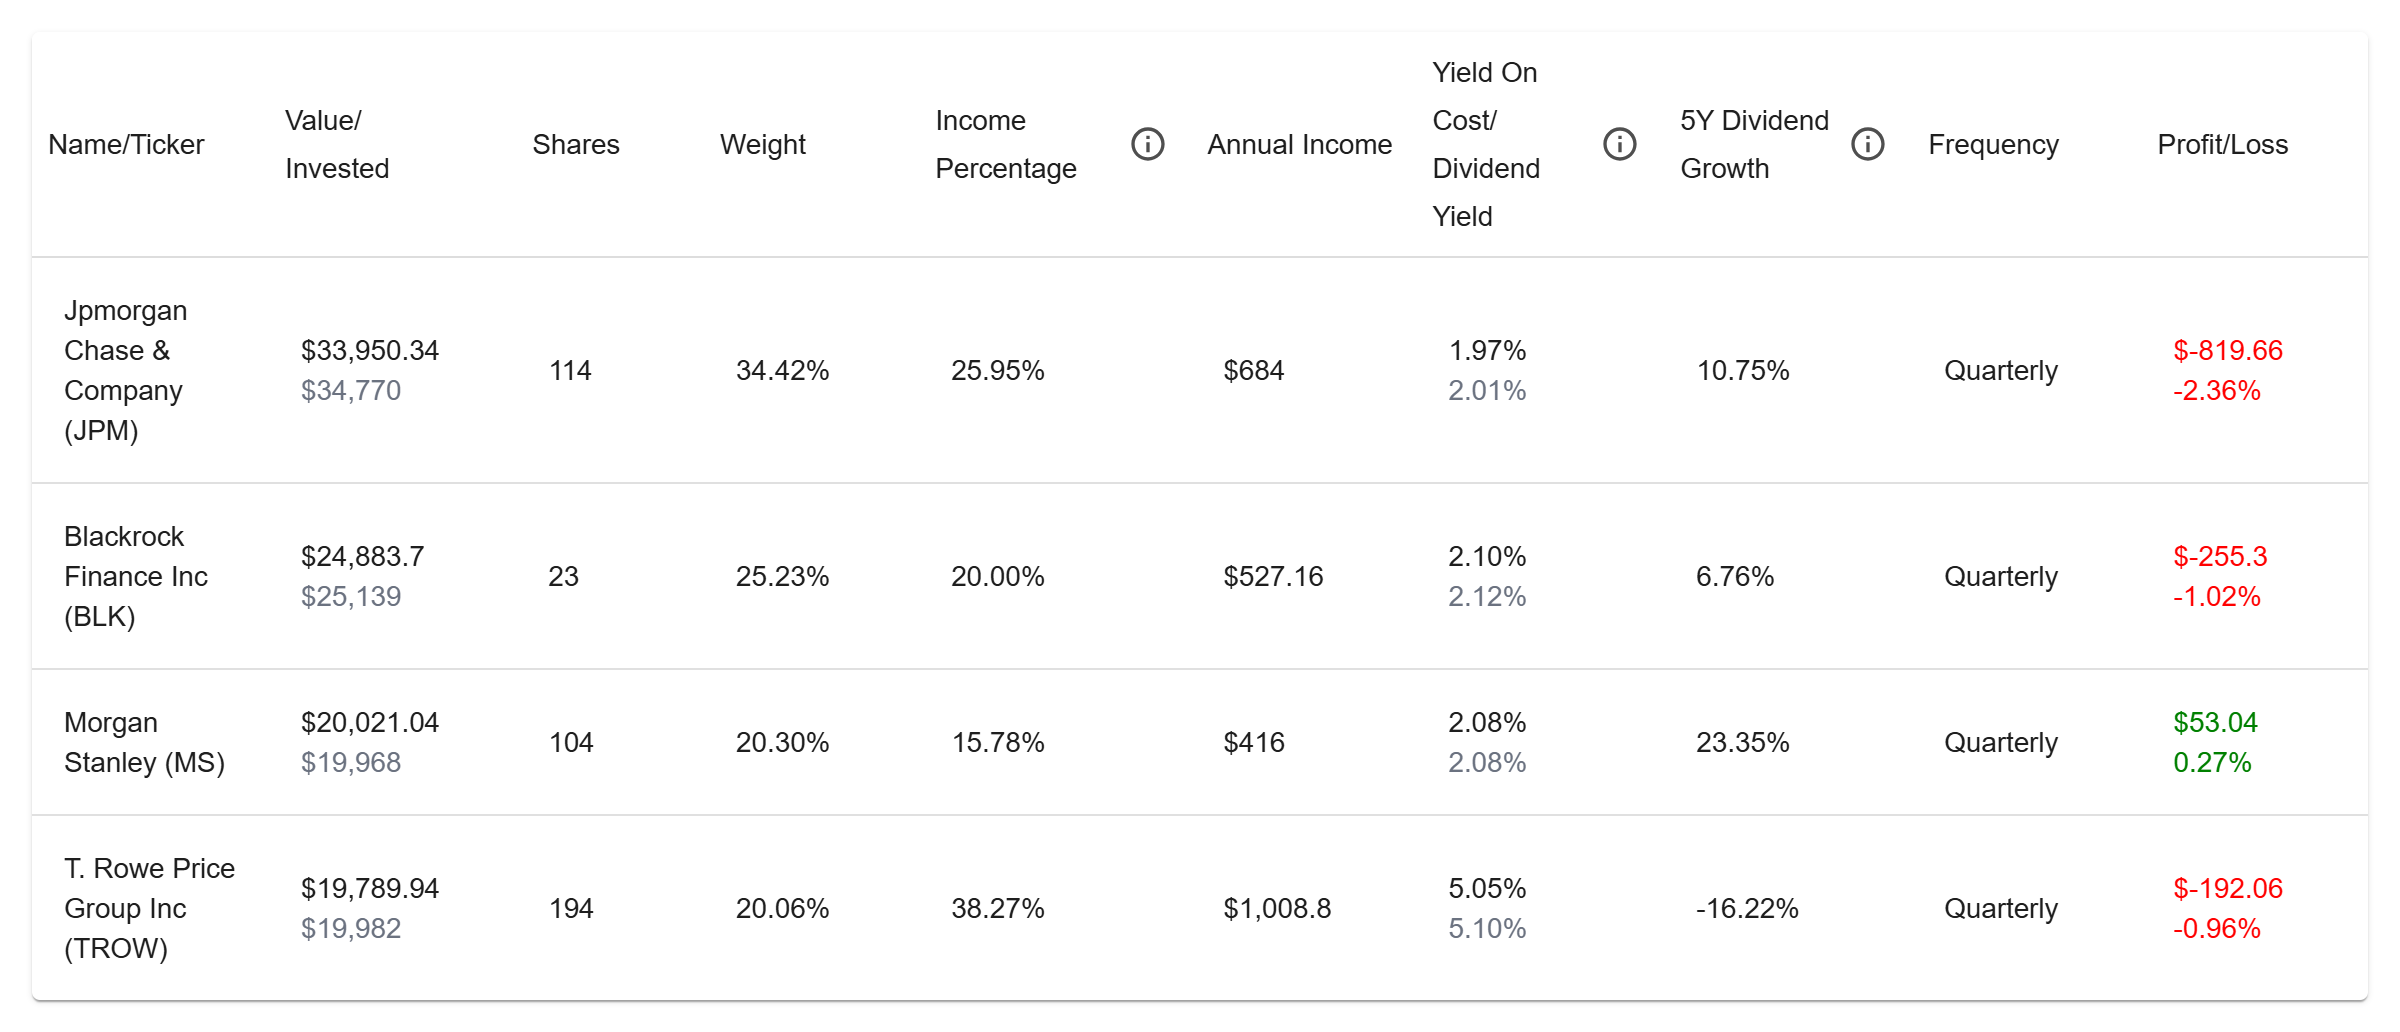
Here's how the portfolio's dividend income is split between the holdings:
- TROW: about 38.3% of the income (roughly $1,009 per year)
- JPM: about 25.9% (about $684 per year)
- BLK: about 20.0% (about $527 per year)
- MS: about 15.8% (about $416 per year)
All holdings pay quarterly.
Reported 5-year dividend growth rates included in this portfolio:
- TROW: -16.22% affected by the 2021 special dividend distortion
- JPM: 10.8%
- BLK: 6.8%
- MS: 23.4%
T. Rowe Price appears to show negative long-term dividend growth primarily because the starting comparison year included a very large special dividend payment. Excluding that one-time distribution, the company’s regular dividend trend has remained considerably more stable.
Forward Income Outlook
If income growth continues in line with the portfolio’s underlying dividend trends, cash flow could rise steadily over time.
- Yield on cost may grow from 2.6% today to roughly 4.0%–4.3% in five years
- Annual income could increase from $2,636 to approximately $4,000–$4,300
- Monthly income could rise from about $220 to roughly $360
- And this projection is described as happening without adding new capital or reinvesting dividends
This illustrates the long-term potential of dividend growth investing within the financial sector: when underlying business cash flow and shareholder distributions continue to expand over time, portfolio income may rise meaningfully even without additional contributions.