ALL vs AFL vs CB vs PRU: 10 Years of Dividend Growth & Income

Portfolio Overview
In this DividendXray battle, we compare four major insurance companies across dividend growth, yield-on-cost expansion, and price return performance over a ten-year period.
- ALL (Allstate) specializes in property and casualty insurance, including auto and home coverage.
- AFL (Aflac) focuses on supplemental insurance, particularly accident, health, and cancer coverage.
- CB (Chubb) is a global insurer offering commercial and personal property and casualty insurance.
- PRU (Prudential Financial) provides life insurance, retirement solutions, and investment management services.
Although all four operate within the insurance industry, their business models and dividend profiles differ. Some offer higher starting income, while others emphasize dividend growth and long-term capital appreciation.
The comparison explores how these differences translate into historical performance, current income potential, and projected dividend growth.
Category Winners
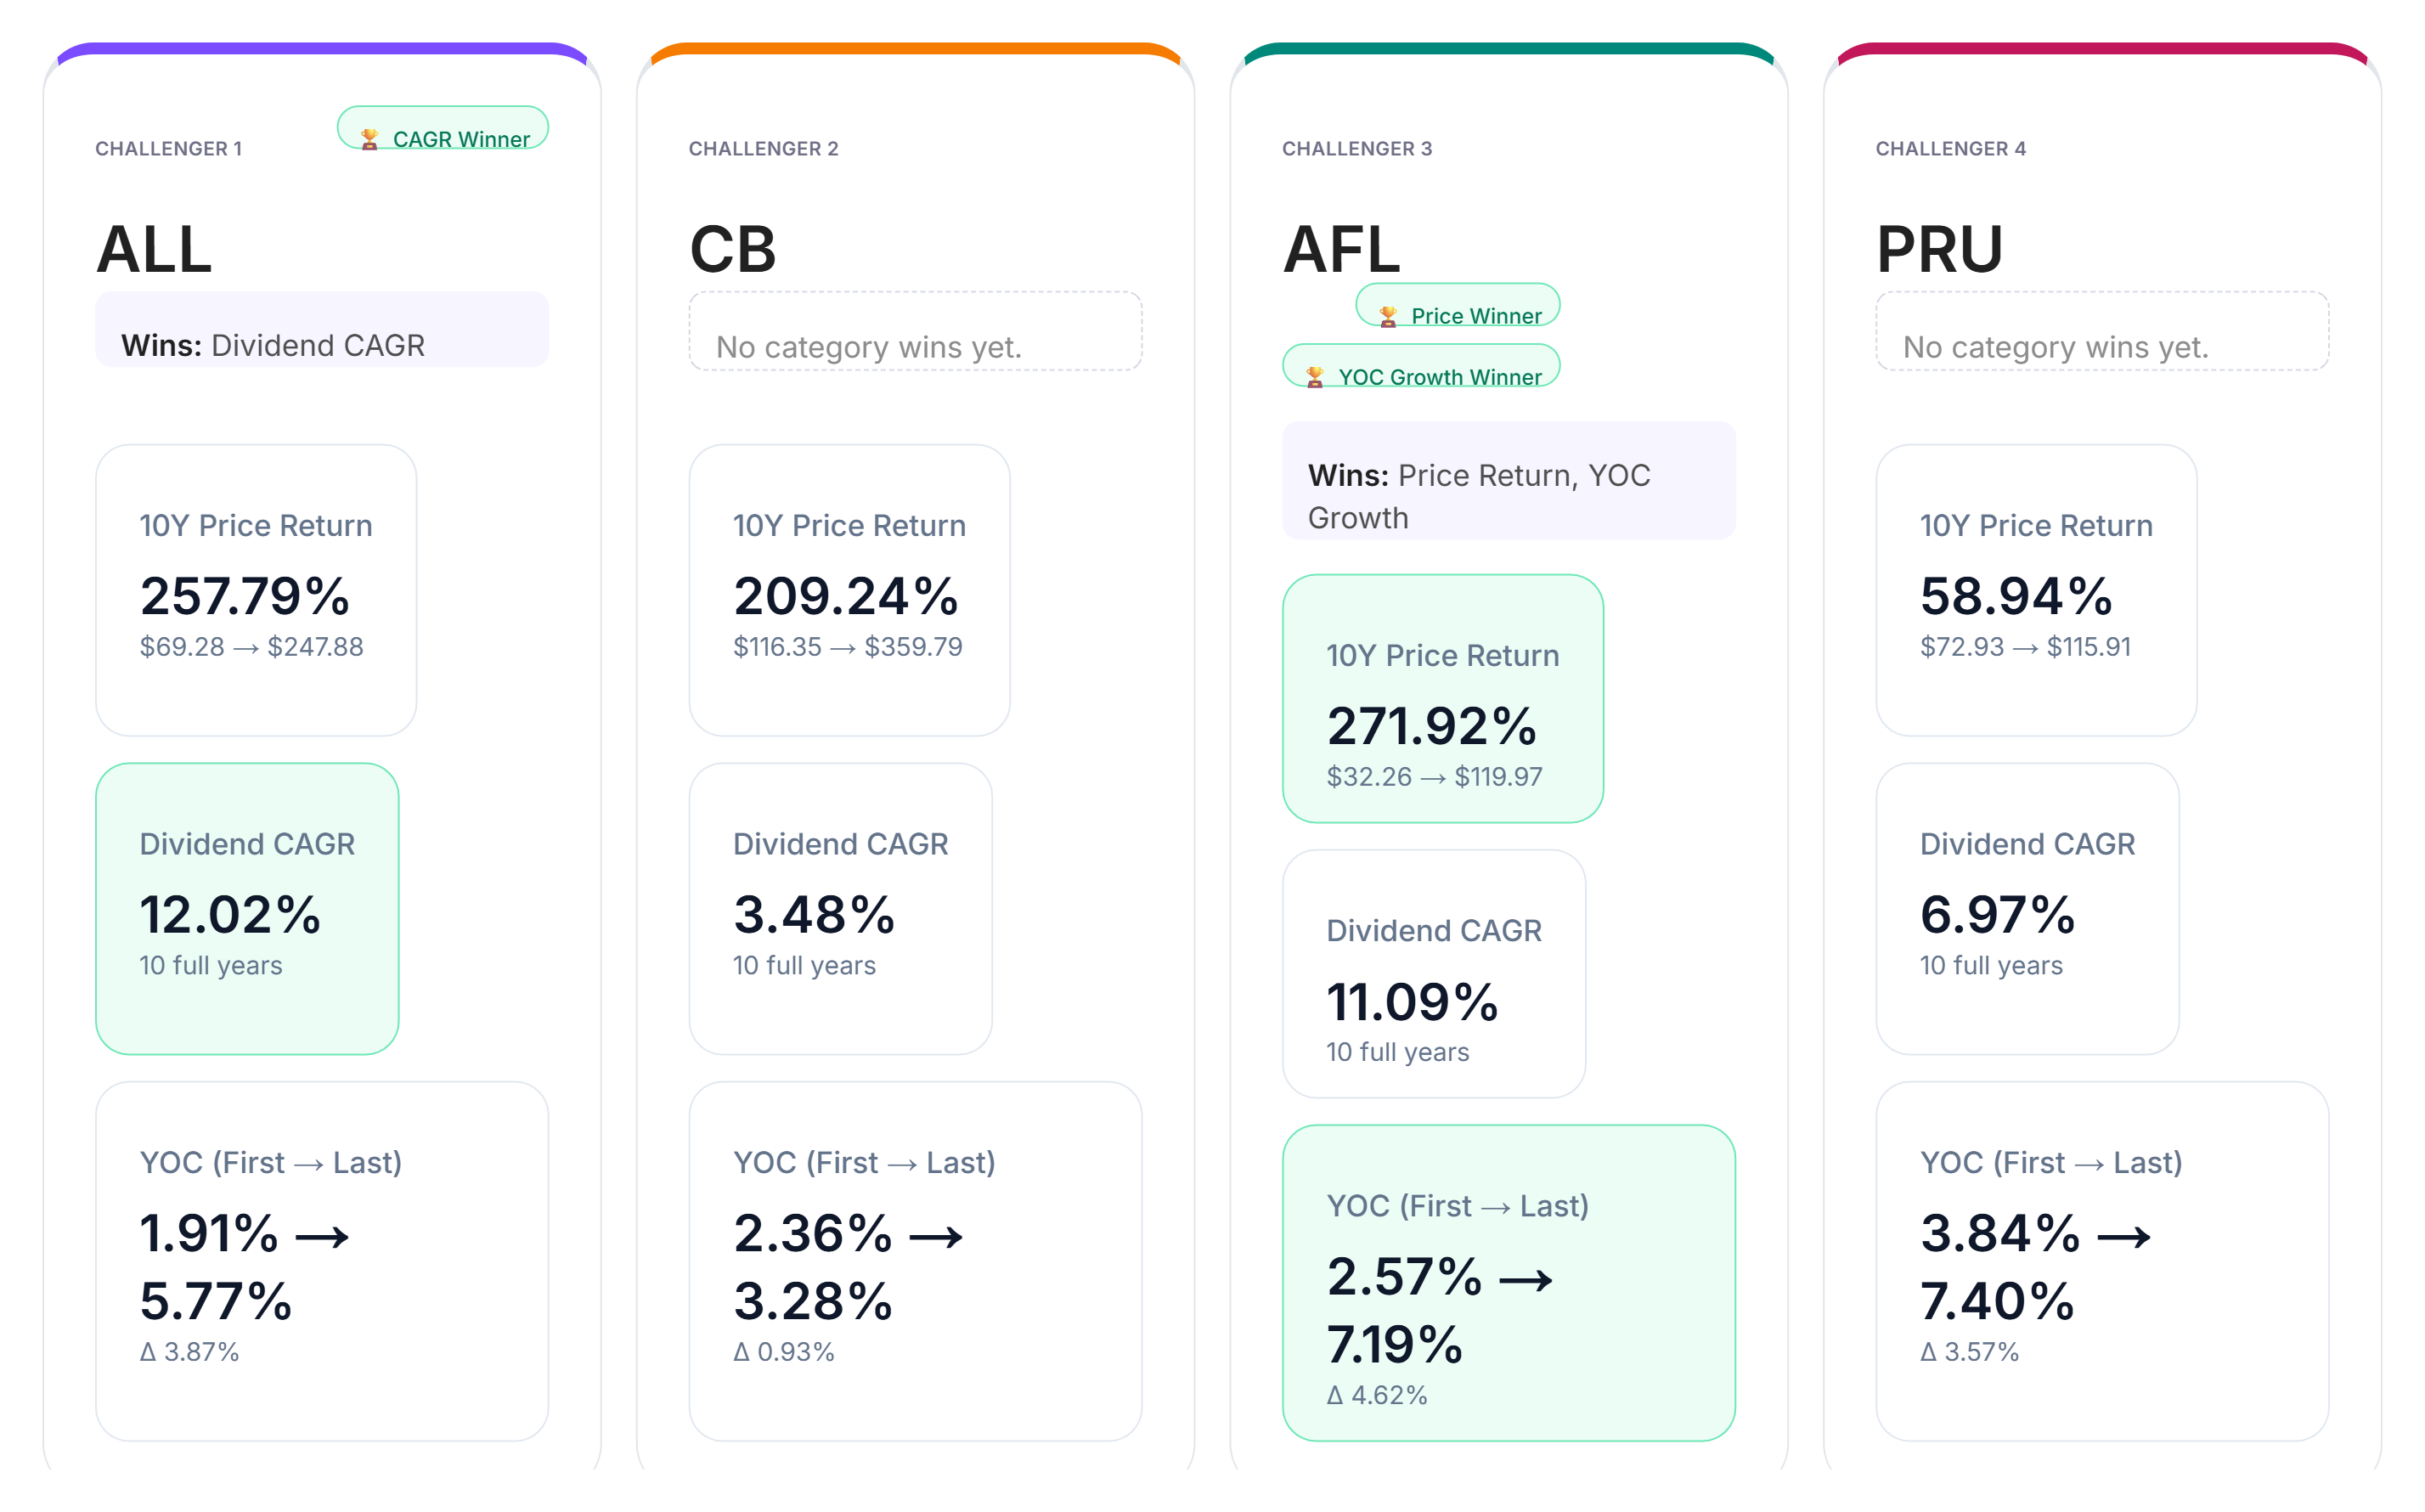
Looking at the ten-year results across dividend CAGR, yield-on-cost growth, and price return, two companies emerge as category leaders.
In dividend growth, Allstate (ALL) leads the group with a ten-year dividend CAGR of 12.02%, demonstrating the strongest historical pace of dividend increases among the four insurers.
For yield-on-cost growth, Aflac (AFL) shows the greatest improvement from the first year to the last. This reflects the strongest expansion in dividend income relative to the original investment over the comparison period.
In price return, Aflac claims another victory, delivering a ten-year return of 271.92%.
Chubb and Prudential do not secure a category win in this comparison, although their income characteristics become more relevant when examining yield on cost and current dividend yields.
The results highlight an important distinction: the fastest dividend grower is not necessarily the strongest performer in price appreciation or yield-on-cost expansion.
Yield-on-Cost by Year
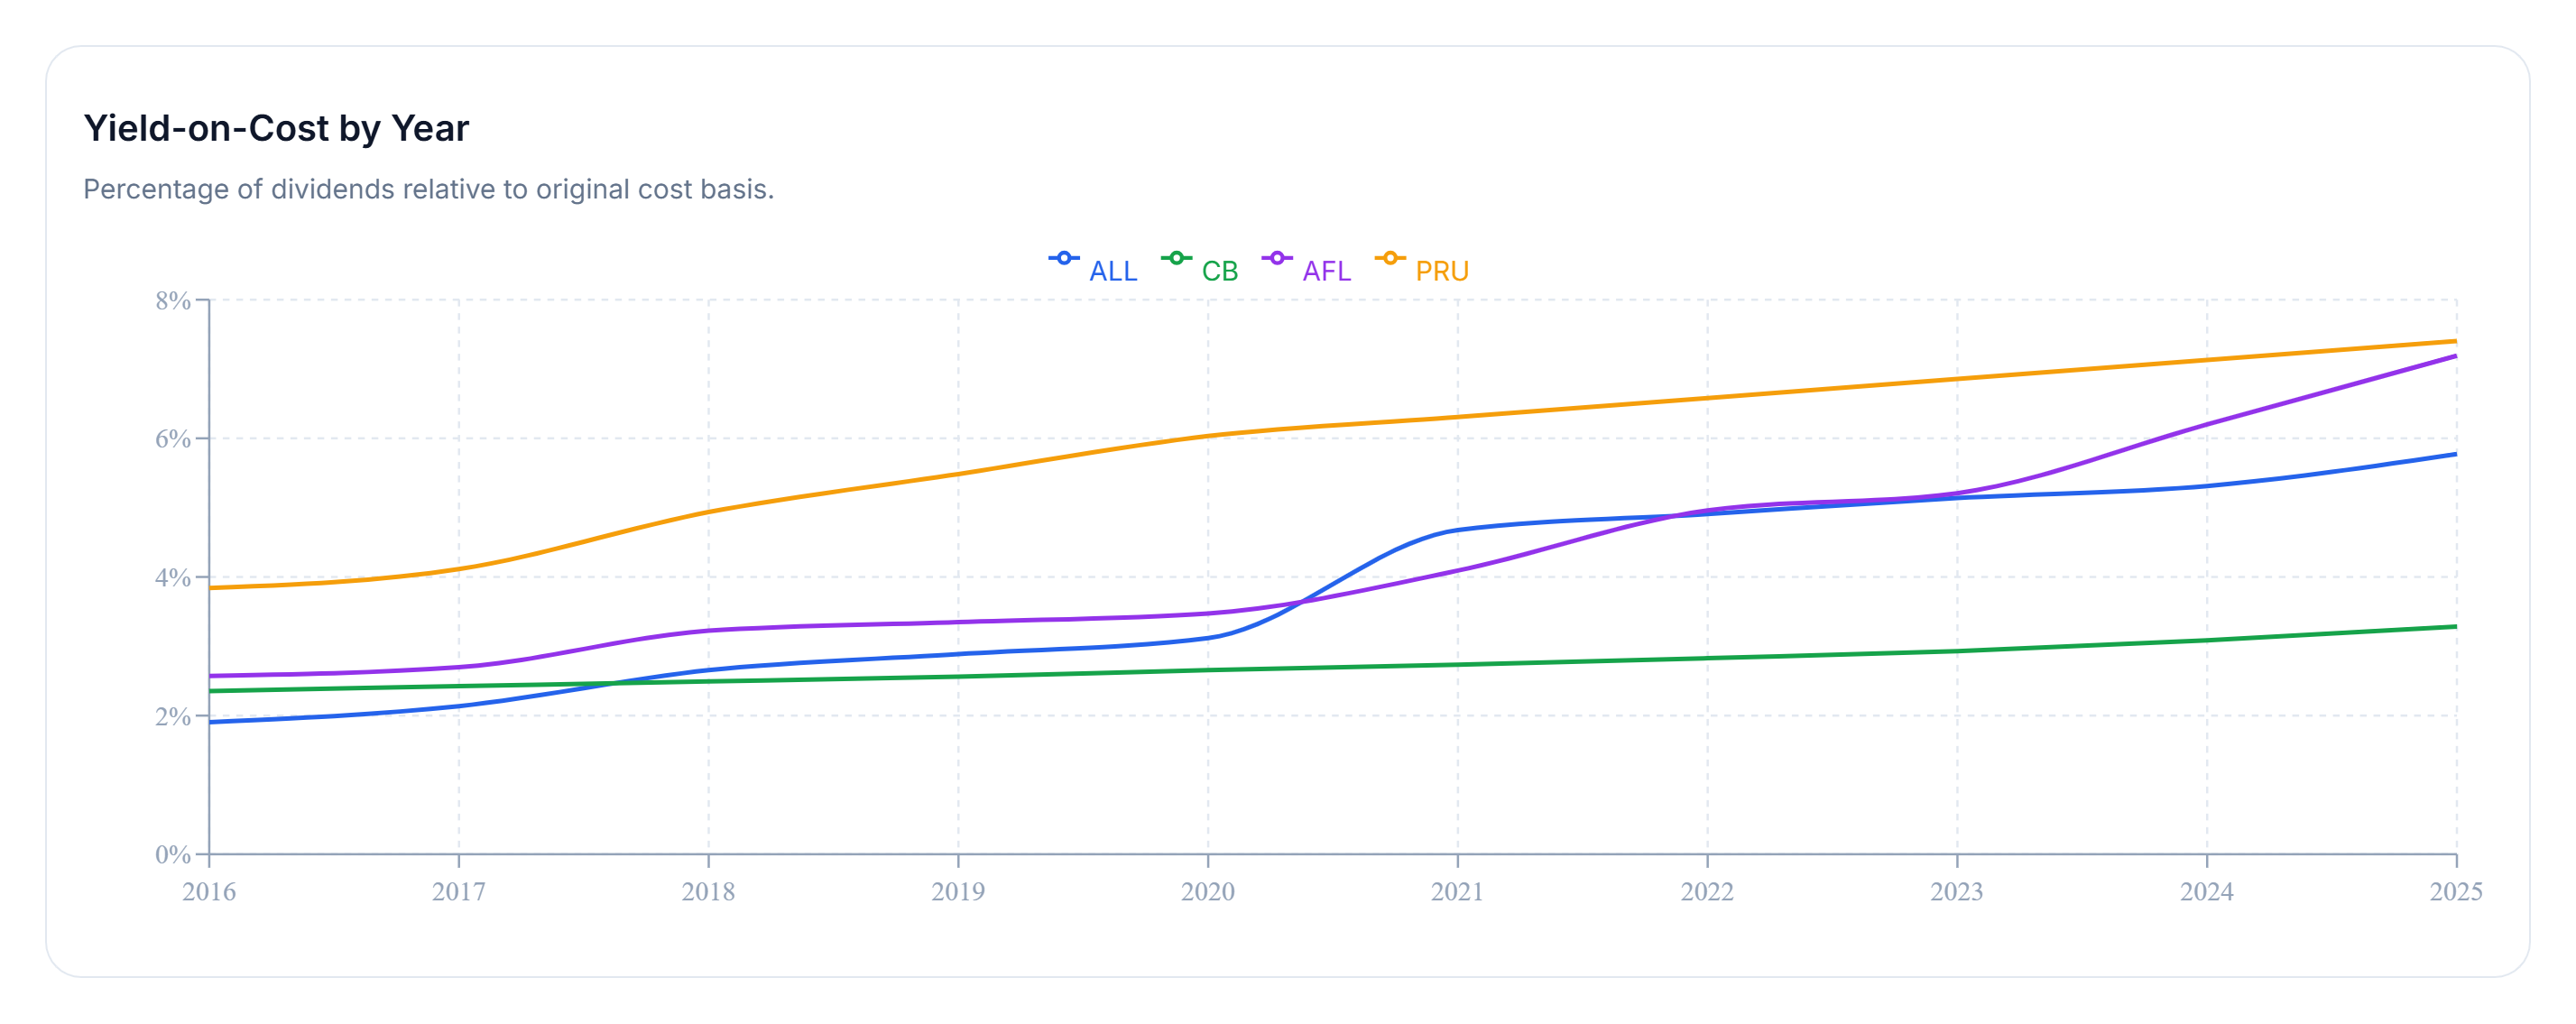
Yield on cost measures annual dividend income relative to the original investment. Unlike current dividend yield, which changes with market prices, yield on cost tracks how much income an investment generates compared with its initial purchase cost.
Over the ten-year period, Prudential (PRU) stands out with the highest ending yield on cost, reaching approximately 7.40%.
Allstate, Aflac, and Chubb show more gradual upward income trends over the same period. However, Aflac records the strongest improvement in yield on cost from the first year to the last, even though Prudential finishes with the highest absolute level.
This distinction matters for dividend investors. A holding can achieve the highest ending income yield without necessarily delivering the fastest income growth.
For investors focused on long-term cash flow, both starting yield and the pace of dividend increases influence how efficiently invested capital generates income over time.
Now let's shift from historical performance to today's income picture, where the focus changes from past dividend growth to the capital required to achieve a specific monthly income target.
Income Goal Comparison
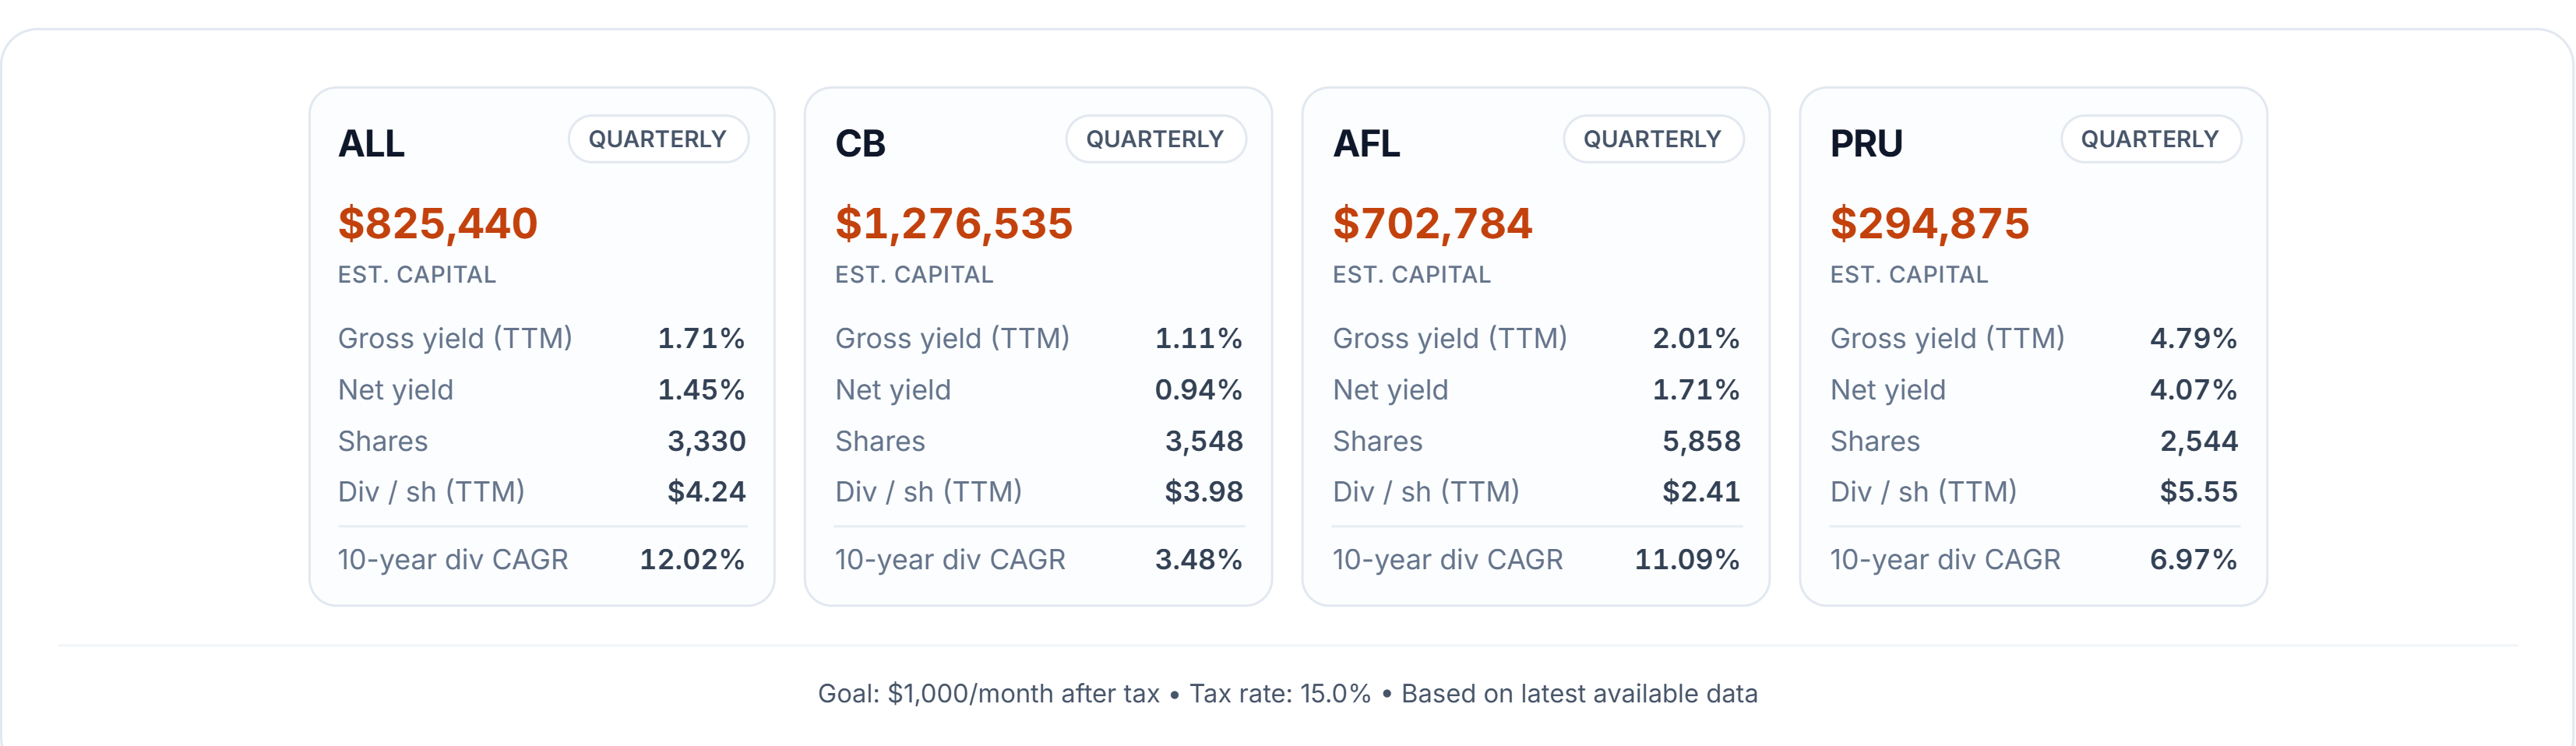
How much capital would you need to generate $1,000 per month in after-tax dividend income from each insurance stock?
Using current dividend yields and an assumed 15% dividend tax rate, the comparison reveals substantial differences in the initial investment required.
Prudential (PRU) requires the least capital, at approximately $294,875, supported by a current dividend yield near 4.8%.
At the opposite extreme, Chubb (CB) requires approximately $1,276,535, reflecting its considerably lower current yield of around 1.1%.
Allstate and Aflac fall between these two extremes, offering different balances of current income and historical dividend growth.
The contrast between Prudential and Chubb illustrates the importance of starting yield when building a portfolio around a specific income goal. A higher dividend yield can significantly reduce the capital required to generate the same amount of cash flow today.
However, the lowest capital requirement does not automatically identify the strongest long-term investment. Dividend growth, share-price performance, payout sustainability, and future business conditions all influence the eventual outcome.
The income comparison captures a snapshot based on current yields, rather than a prediction of future returns or dividend payments.
Yield Catch-Up Timeline
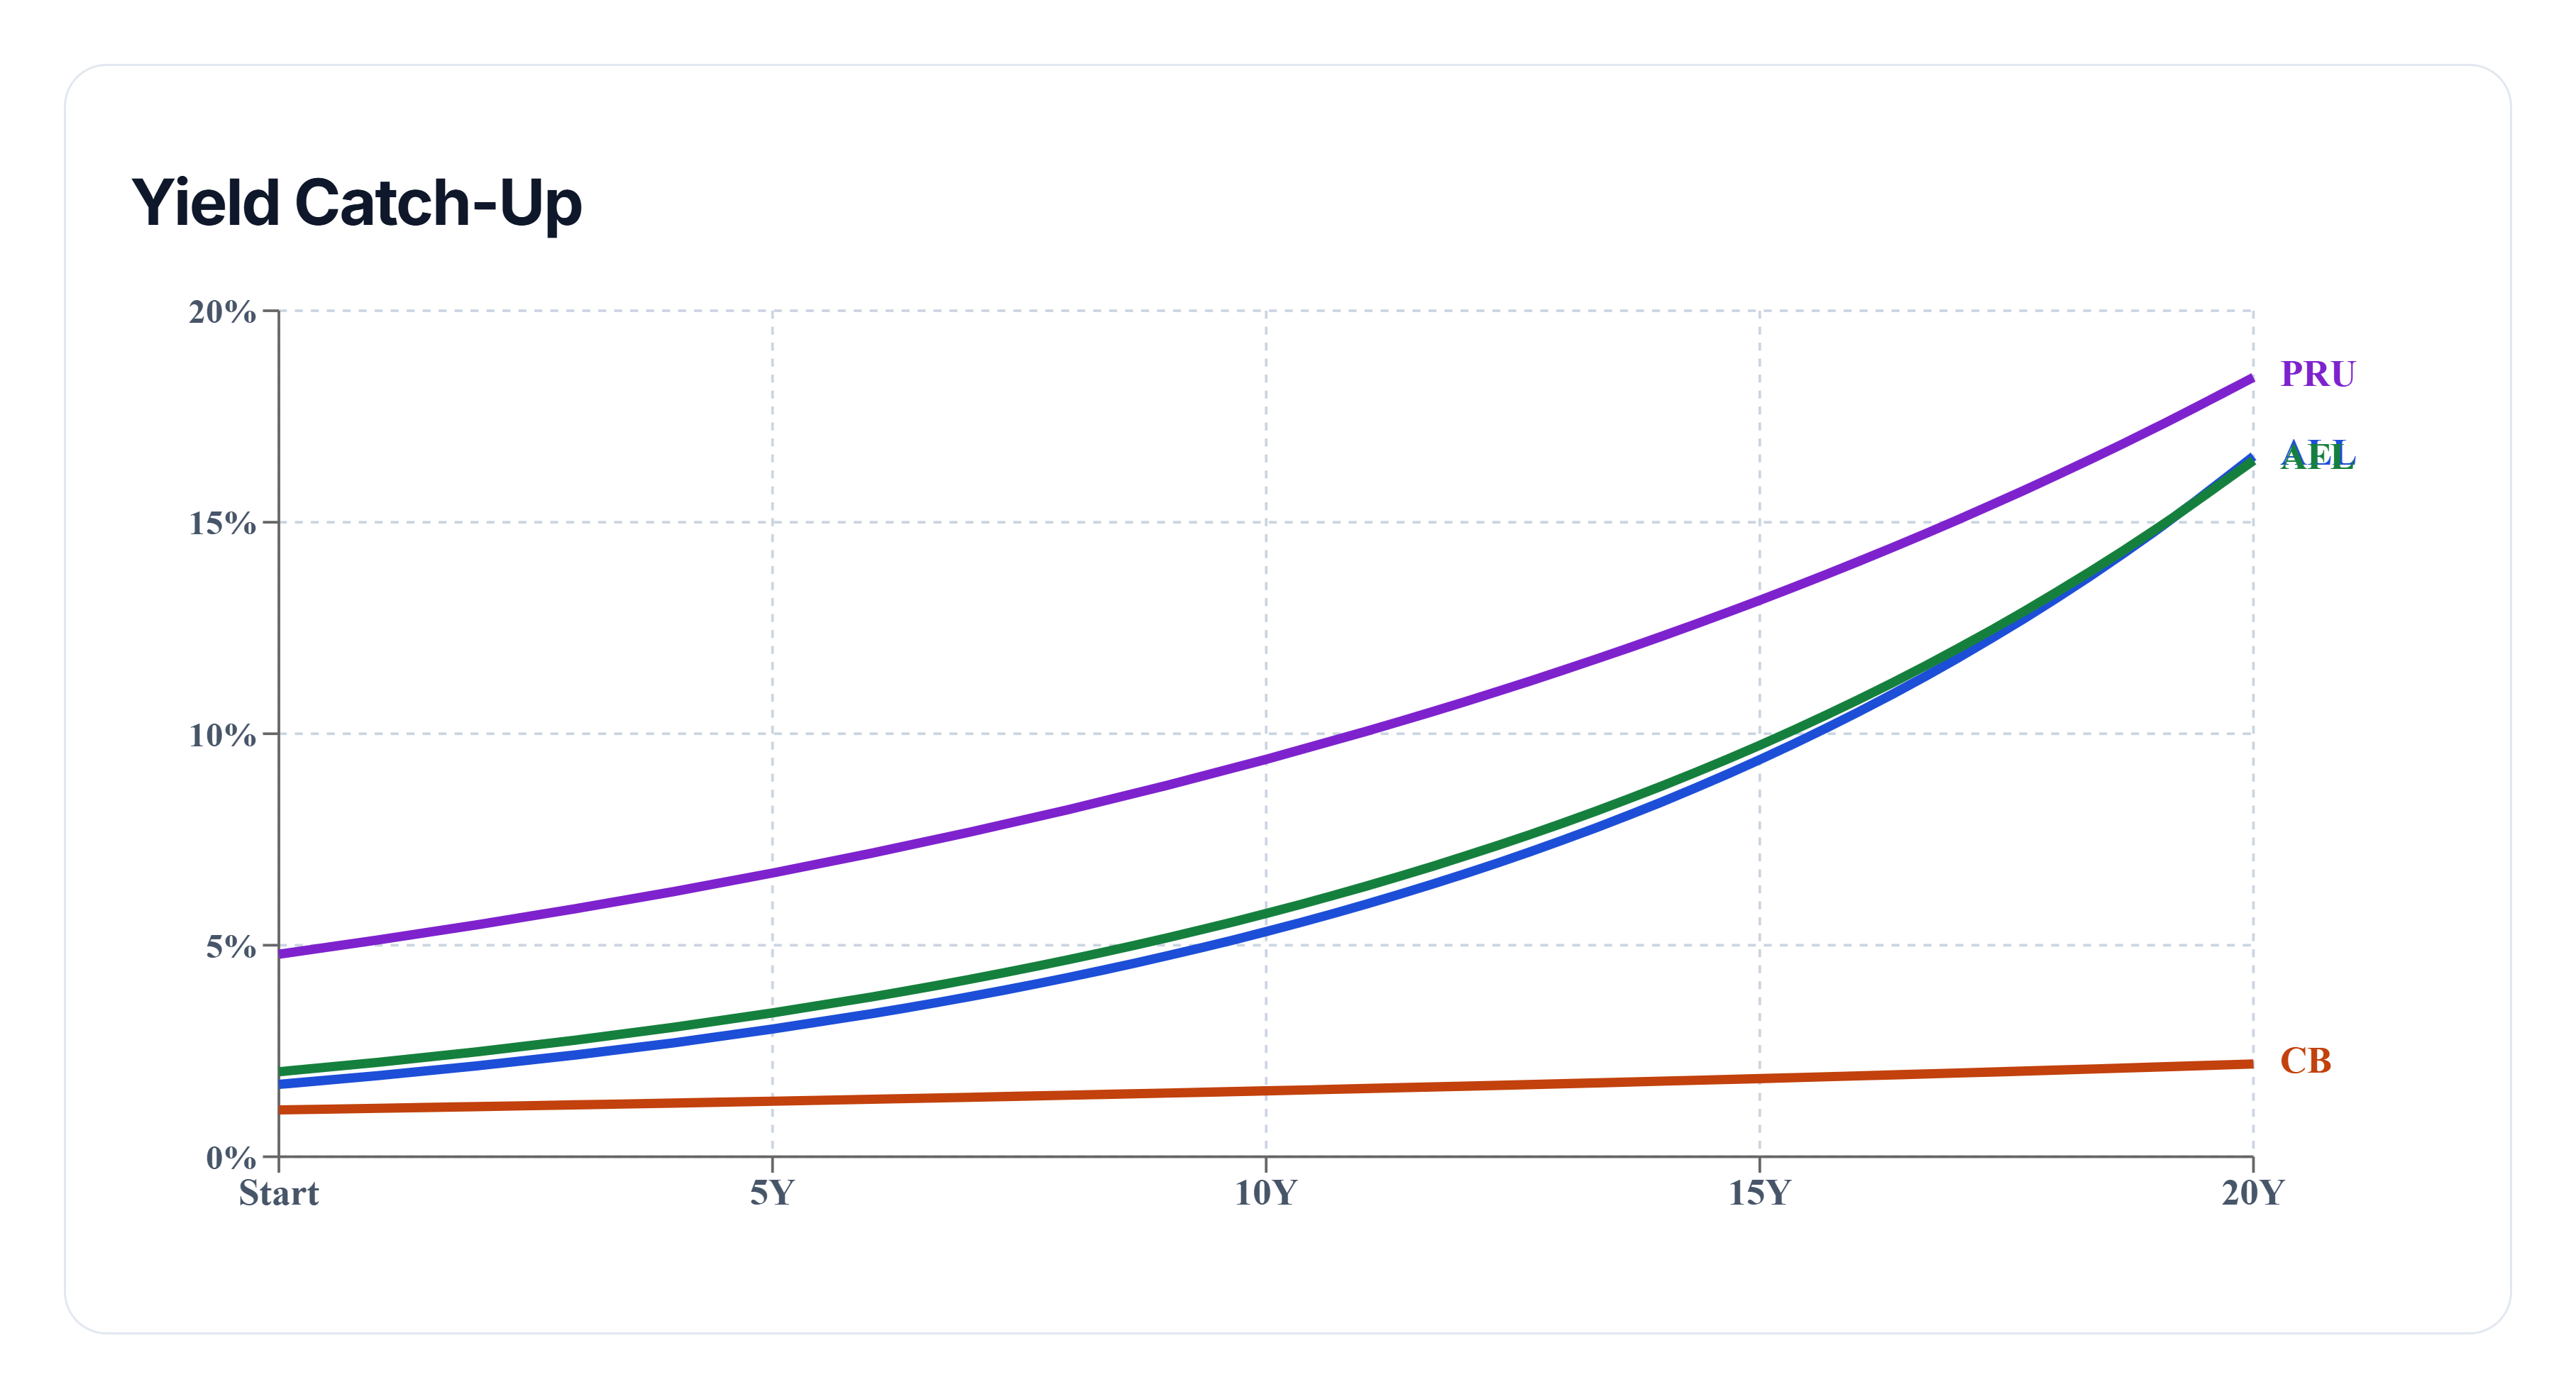
A higher starting dividend yield provides an immediate income advantage, but faster dividend growth can potentially narrow that gap over time.
The yield catch-up projection explores this tradeoff by modeling future dividend income using each company's historical ten-year dividend CAGR.
Under these assumptions, Allstate (ALL) leads in projected dividend growth at approximately 12% annually, while Prudential begins with the highest current yield, near 4.8%.
Chubb starts considerably lower, with a current dividend yield around 1.1%.
Despite the potential benefits of compounding dividend growth, Chubb does not catch Prudential's projected yield on cost within the 20-year modeling period.
This illustrates how difficult it can be for a lower-yielding investment to overcome a substantial starting income disadvantage, even when dividends continue growing.
For income-focused investors, the timing of a potential catch-up matters. A stock that may eventually produce higher income could require many years before matching the cash flow available from a higher-yielding alternative today.
These projections assume historical dividend growth rates continue into the future. Actual dividend policies, earnings growth, and economic conditions may produce very different outcomes.
Final Takeaway
There is no single winner across every dimension of this insurance dividend stock comparison.
Allstate (ALL) leads historical dividend growth with a ten-year CAGR of 12.02%, making it the strongest dividend growth performer in this group.
Aflac (AFL) wins both yield-on-cost growth and price return, with a ten-year price gain of 271.92%.
Prudential (PRU) stands out for income generation, finishing with the highest historical yield on cost at approximately 7.40% and requiring the least capital to reach the $1,000 monthly after-tax income target.
Chubb (CB) has the lowest current yield among the four and requires the most capital to achieve that same income goal. Its projected yield on cost also remains below Prudential's throughout the 20-year modeling period.
Together, these results demonstrate the tradeoff between higher income today, faster dividend growth, and historical price appreciation.
For dividend investors, the best choice ultimately depends on whether the priority is generating immediate cash flow, growing future income, or balancing dividend growth with long-term capital appreciation.