Inside SPYD: Where Does Its 4.35% Dividend Yield Really Come From?
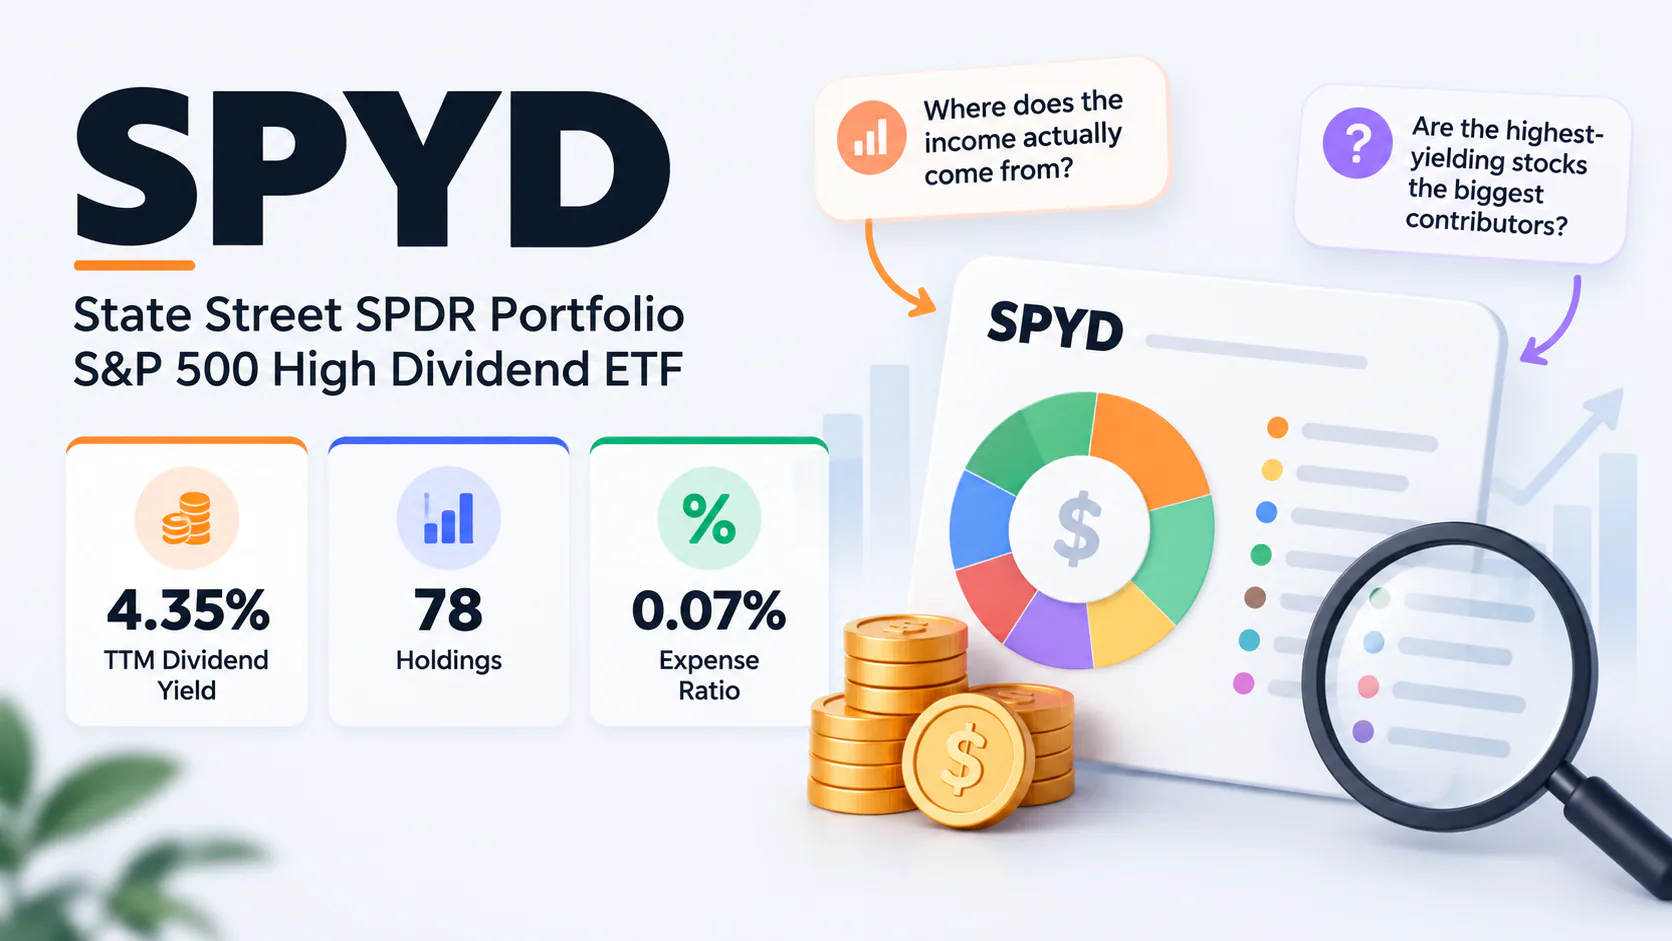
SPYD, the State Street SPDR Portfolio S&P 500 High Dividend ETF, offers a trailing dividend yield of 4.35%, with 78 holdings and an expense ratio of just 0.07%.
For income-focused investors, those headline numbers are attractive. But they only tell part of the story.
Where does SPYD's dividend income actually come from? Do the highest-yielding stocks contribute the most income? And how closely does a company's portfolio weight match its contribution to the ETF's distributions?
This visual analysis looks beneath SPYD's headline yield, examining 20 selected holdings across nine sectors to understand how portfolio allocation translates into estimated dividend income.
The distinction matters because a stock's dividend yield, its portfolio weight, and its contribution to total ETF income are three different measurements.
Explore the Interactive Chart
Want to explore the data behind the images below? Load the interactive version here.
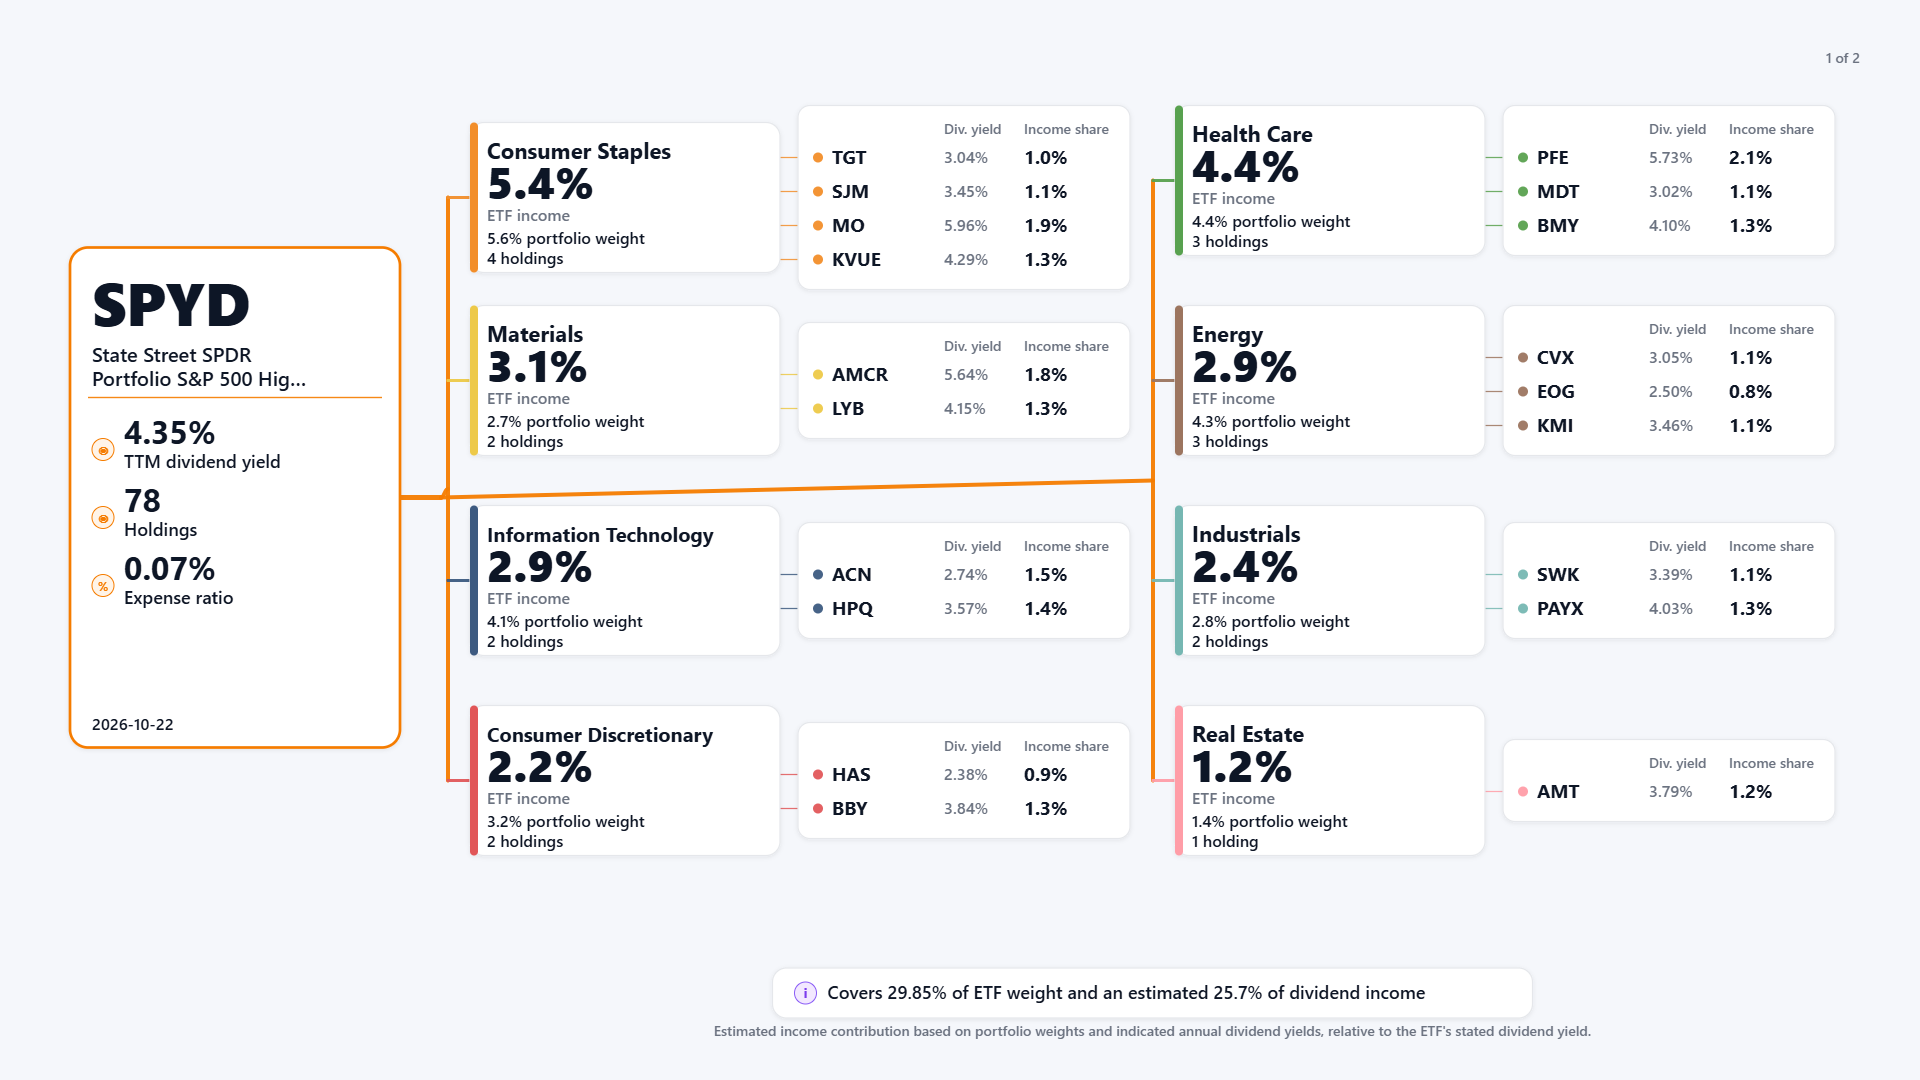
The first allocation tree breaks down selected SPYD holdings across eight sectors, comparing their portfolio weights, individual dividend yields, and estimated contributions to the ETF's overall dividend income.
Consumer staples leads the displayed sectors, accounting for approximately 5.6% of SPYD's portfolio weight and contributing an estimated 5.4% of total ETF dividend income.
Within this group, Altria (MO) stands out. With an indicated dividend yield of 5.96%, it contributes approximately 1.9% of SPYD's estimated dividend income despite representing only 1.36% of the portfolio.
Other consumer staples holdings include Target (TGT), J.M. Smucker (SJM), and Kenvue (KVUE), each contributing differently based on the combination of its portfolio allocation and dividend yield.
But the more interesting comparison appears when looking across sectors.
Healthcare vs. Energy: Similar Exposure, Different Income
The displayed healthcare holdings account for approximately 4.4% of portfolio weight and contribute an estimated 4.4% of SPYD's dividend income.
Pfizer (PFE), yielding 5.73%, contributes approximately 2.1% of the ETF's estimated income. Medtronic (MDT) and Bristol Myers Squibb (BMY) provide additional contributions.
Energy tells a different story.
Chevron (CVX), EOG Resources (EOG), and Kinder Morgan (KMI) collectively represent approximately 4.3% of SPYD's portfolio weight, yet contribute only an estimated 2.9% of its dividend income.
The difference illustrates an important principle:
Portfolio weight does not automatically translate into an equivalent share of dividend income.
A company's contribution depends on both how much of the ETF it represents and how much dividend income it generates relative to its market value.
High Yield Doesn't Always Mean High Income Contribution
Consider Pfizer and EOG Resources.
Pfizer has a dividend yield of 5.73%, compared with EOG Resources at 2.50%. Their portfolio weights are relatively close, at 1.58% and 1.41%, respectively.
Yet Pfizer contributes an estimated 2.1% of SPYD's dividend income, while EOG contributes approximately 0.8%.
Accenture (ACN) provides another example. Despite representing 2.37% of the portfolio, its 2.74% dividend yield translates into an estimated 1.5% share of ETF income.
These examples demonstrate why evaluating an income ETF requires more than simply identifying its largest positions or highest-yielding stocks.
The relationship between position size and dividend yield determines how much each holding contributes to the overall income stream.
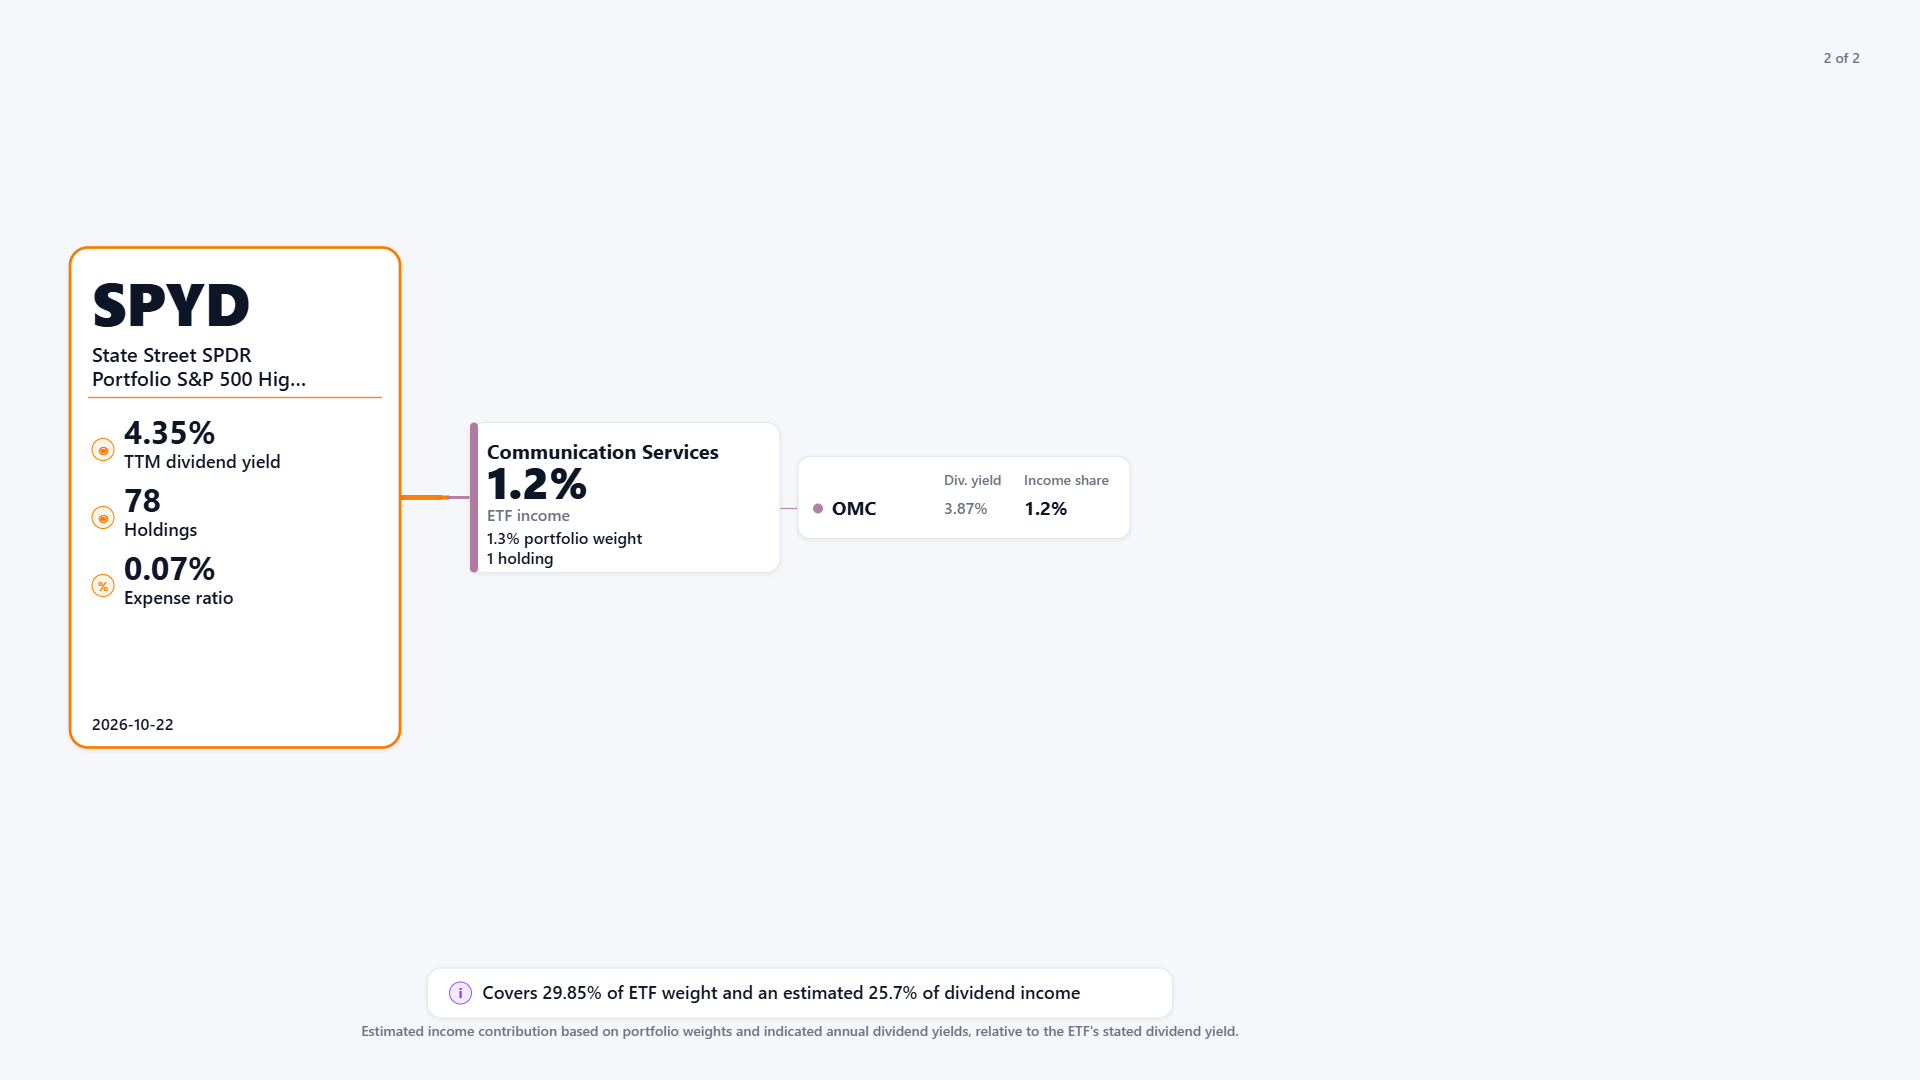
The second allocation tree completes the selected holdings breakdown with communication services, represented by Omnicom Group (OMC).
Omnicom accounts for approximately 1.3% of SPYD's portfolio weight, carries an indicated dividend yield of 3.87%, and contributes an estimated 1.2% of total ETF dividend income.
Although this final sector contains only one displayed holding, it helps complete a broader picture of the ETF's income distribution.
What the 20 Selected Holdings Reveal
Across both charts, the 20 highlighted holdings represent:
- 29.85% of SPYD's portfolio weight
- Approximately 25.7% of its estimated dividend income
- Nine sectors represented among the selected holdings
This means the remaining 58 holdings account for approximately 70.15% of portfolio weight and 74.3% of estimated dividend income.
The selected holdings therefore contribute a somewhat smaller share of income than their combined portfolio weight might suggest.
That observation is useful, but it should not be mistaken for a complete picture of SPYD's sector allocations. The charts display selected holdings rather than every company in the ETF.
More importantly, these figures highlight the difference between evaluating an ETF by its holdings and evaluating it by the income those holdings generate.
A portfolio can contain numerous established dividend-paying companies while still exhibiting meaningful differences in how income is distributed among individual positions.
Why Income Composition Matters
SPYD's 4.35% trailing yield provides a useful snapshot of its recent distributions relative to its price.
However, the underlying income composition offers additional context.
A high dividend yield may reflect generous shareholder distributions, lower stock valuations, or businesses facing financial and operational challenges.
Likewise, a lower-yielding company may contribute less immediate income while potentially offering different dividend growth characteristics.
Neither outcome is automatically superior.
For long-term dividend investors, understanding the underlying businesses, their dividend sustainability, and their capacity to maintain or grow distributions can be just as important as the ETF's current yield.
Final Takeaway
SPYD demonstrates why looking beyond an ETF's headline dividend yield can provide a more complete understanding of its income profile.
Its 4.35% trailing yield, 78 holdings, and low expense ratio describe the fund at a high level. But the allocation tree reveals how individual stocks and sectors contribute differently to estimated dividend income.
The central lesson is straightforward:
Dividend yield tells you what a fund has recently paid relative to its price. Income composition helps explain where that cash flow comes from.
Neither metric alone establishes whether future distributions will be sustainable or whether an ETF will deliver attractive long-term returns.
For dividend investors comparing income-focused ETFs, examining both portfolio allocation and income contribution can help reveal differences that headline yields might otherwise hide.
Explore more ETF comparisons, dividend research, and interactive visualizations at DividendXray.
Data snapshot: October 22, 2026. Dividend income contributions are estimates based on portfolio weights and indicated annual dividend yields relative to the ETF's stated yield. Actual ETF distributions may differ. Educational content only. Not financial advice.