VYM vs DVY vs HDV vs SPYD: Dividend ETF Battle for Income Growth

Portfolio Overview
In this DividendXray battle, we compare four high-yield dividend ETFs across income growth, yield-on-cost expansion, and total return performance over a five-year period.
- VYM provides broad exposure to large-cap U.S. companies with above-average dividend yields.
- DVY focuses on high-yielding U.S. dividend stocks with a strong emphasis on income generation.
- HDV targets financially strong companies with durable dividends, emphasizing stability and quality.
- SPYD selects the highest-yielding stocks from the S&P 500, prioritizing income efficiency and yield.
While all four ETFs focus on dividend income, their portfolio construction methods differ — creating meaningful variations in income growth, yield efficiency, and overall return.
Category Winners
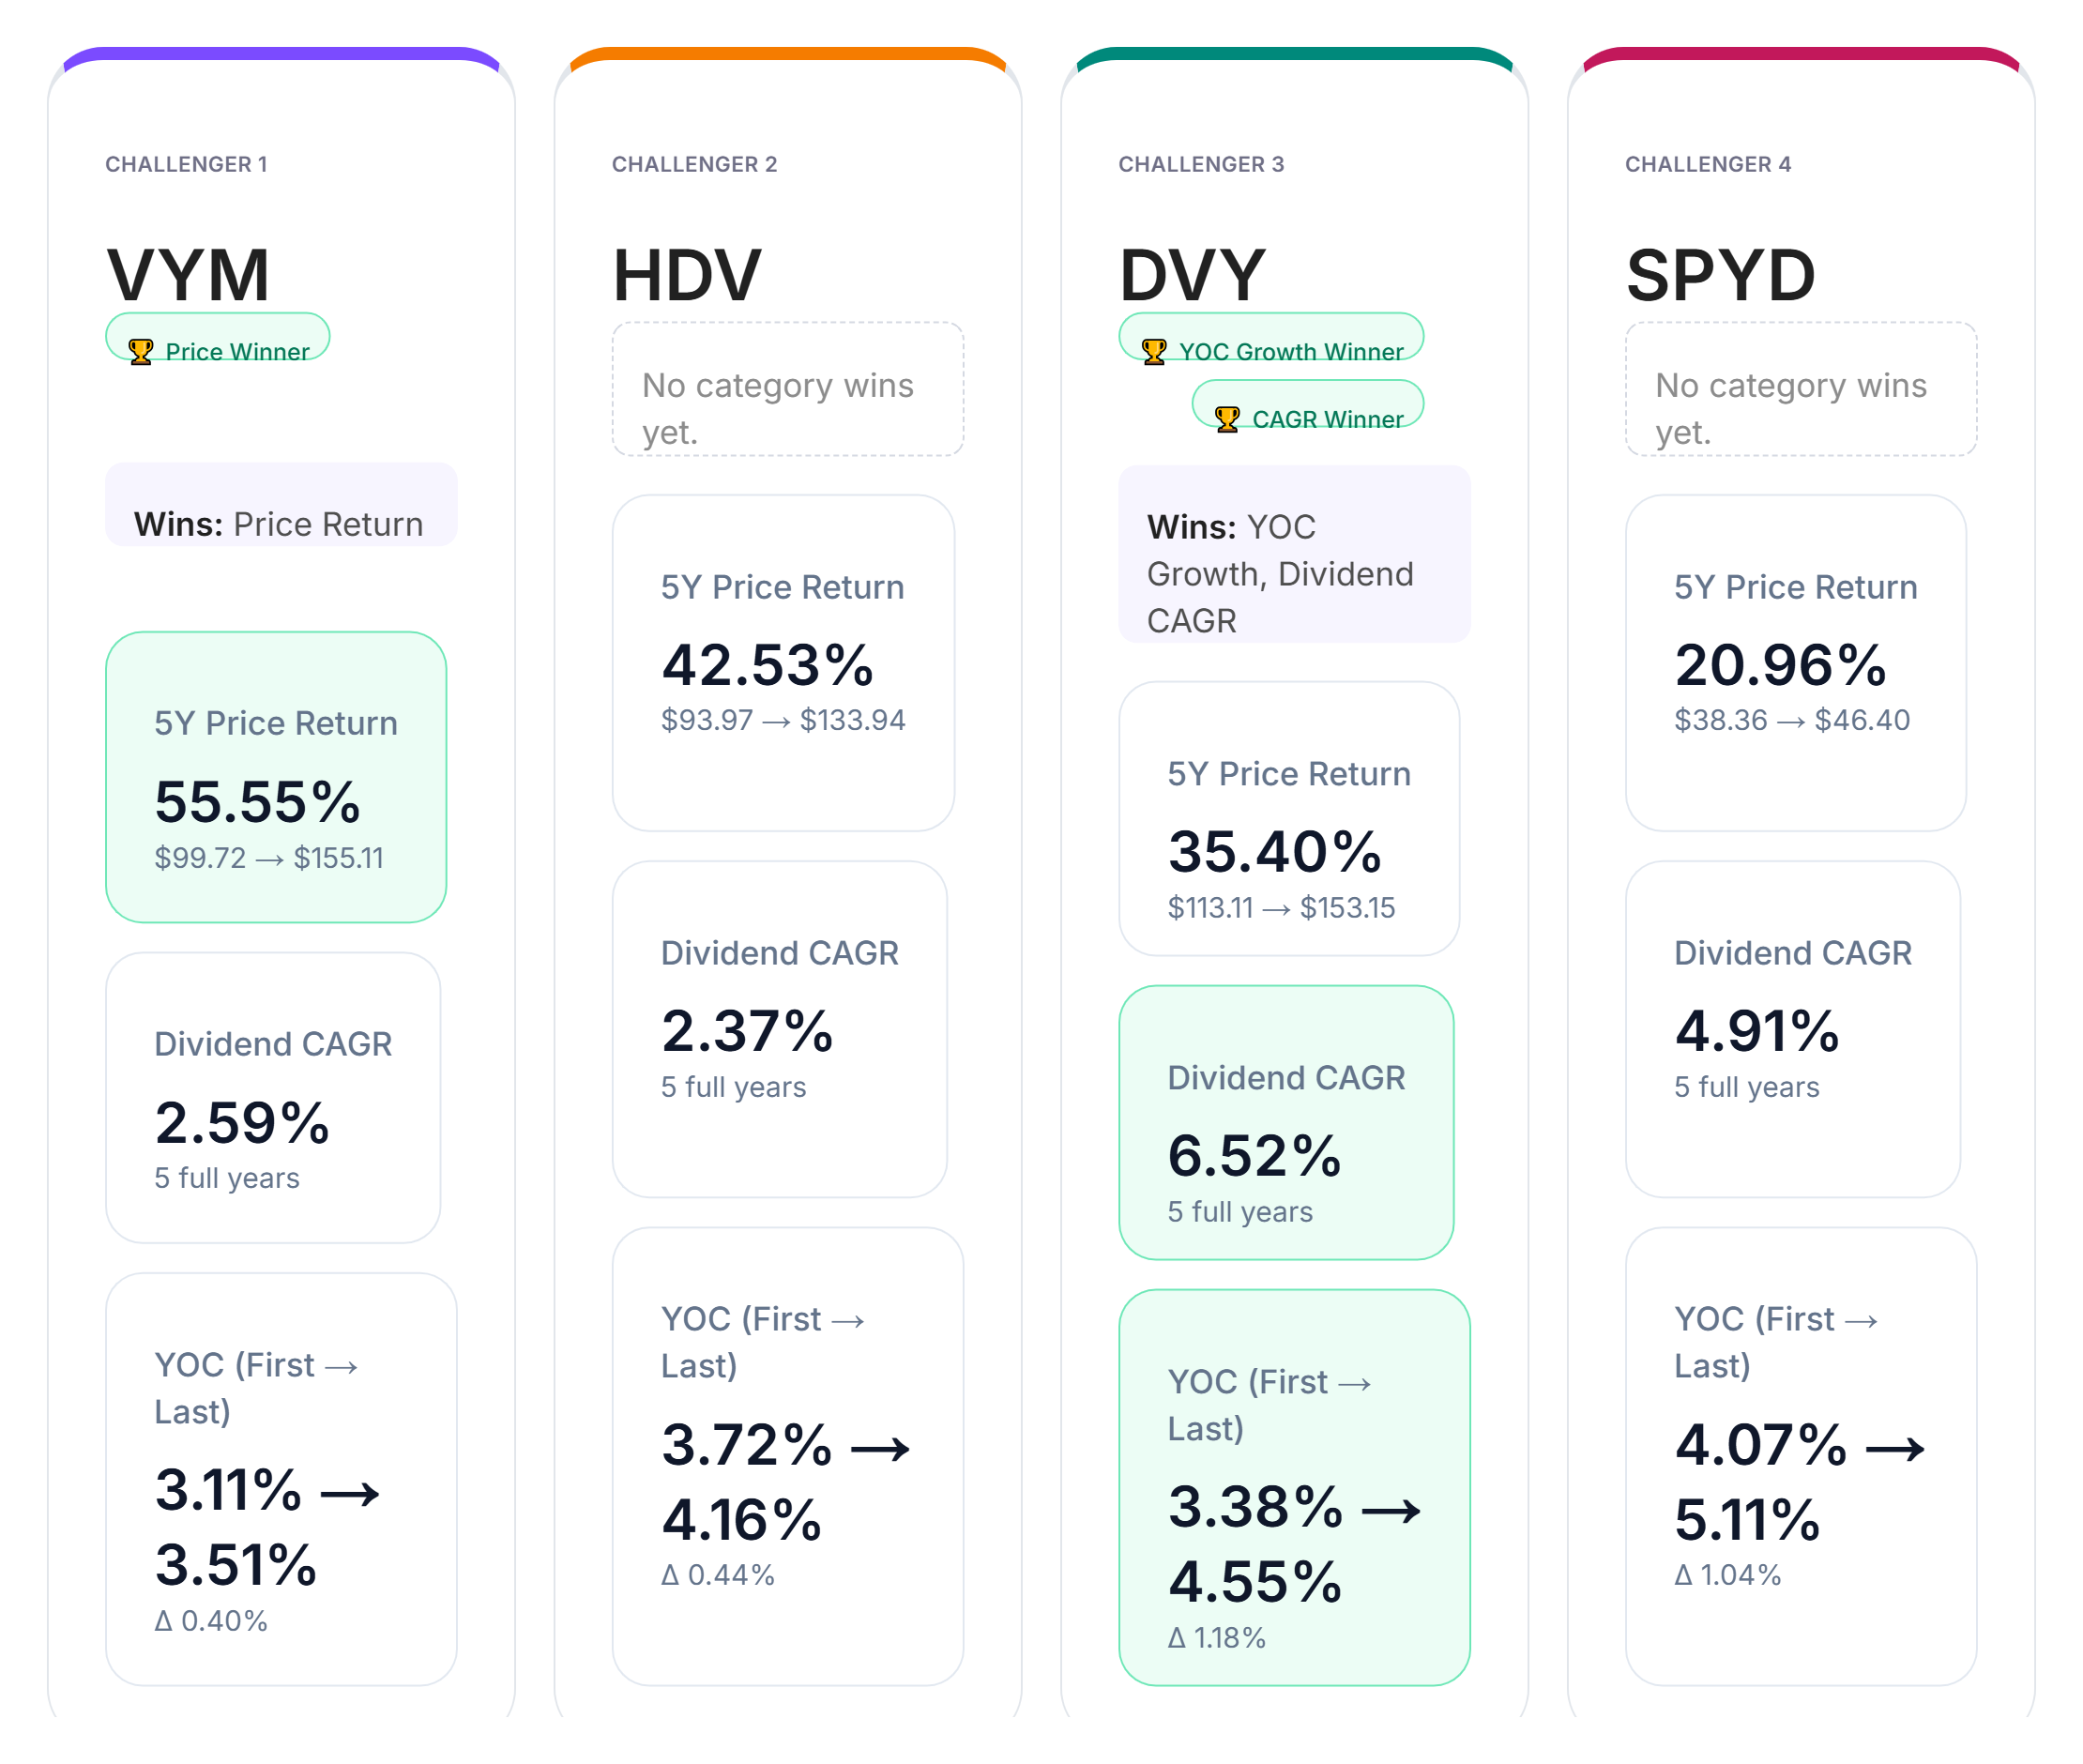
Looking at the data across dividend CAGR, yield-on-cost growth, and price return, clear category leaders emerge.
In dividend growth, DVY leads the group with a five-year dividend CAGR of 6.52%.
For yield-on-cost growth, DVY again shows the strongest improvement from the first year to the last, reflecting efficient income compounding relative to the original investment.
In price return, however, VYM takes the lead with a five-year return of 55.55%, outperforming the other challengers in total appreciation.
HDV and SPYD both deliver solid performance across the metrics but do not secure a category win in this comparison. The results highlight how strategy differences — yield prioritization versus dividend growth orientation — shape long-term outcomes.
Yield-on-Cost by Year
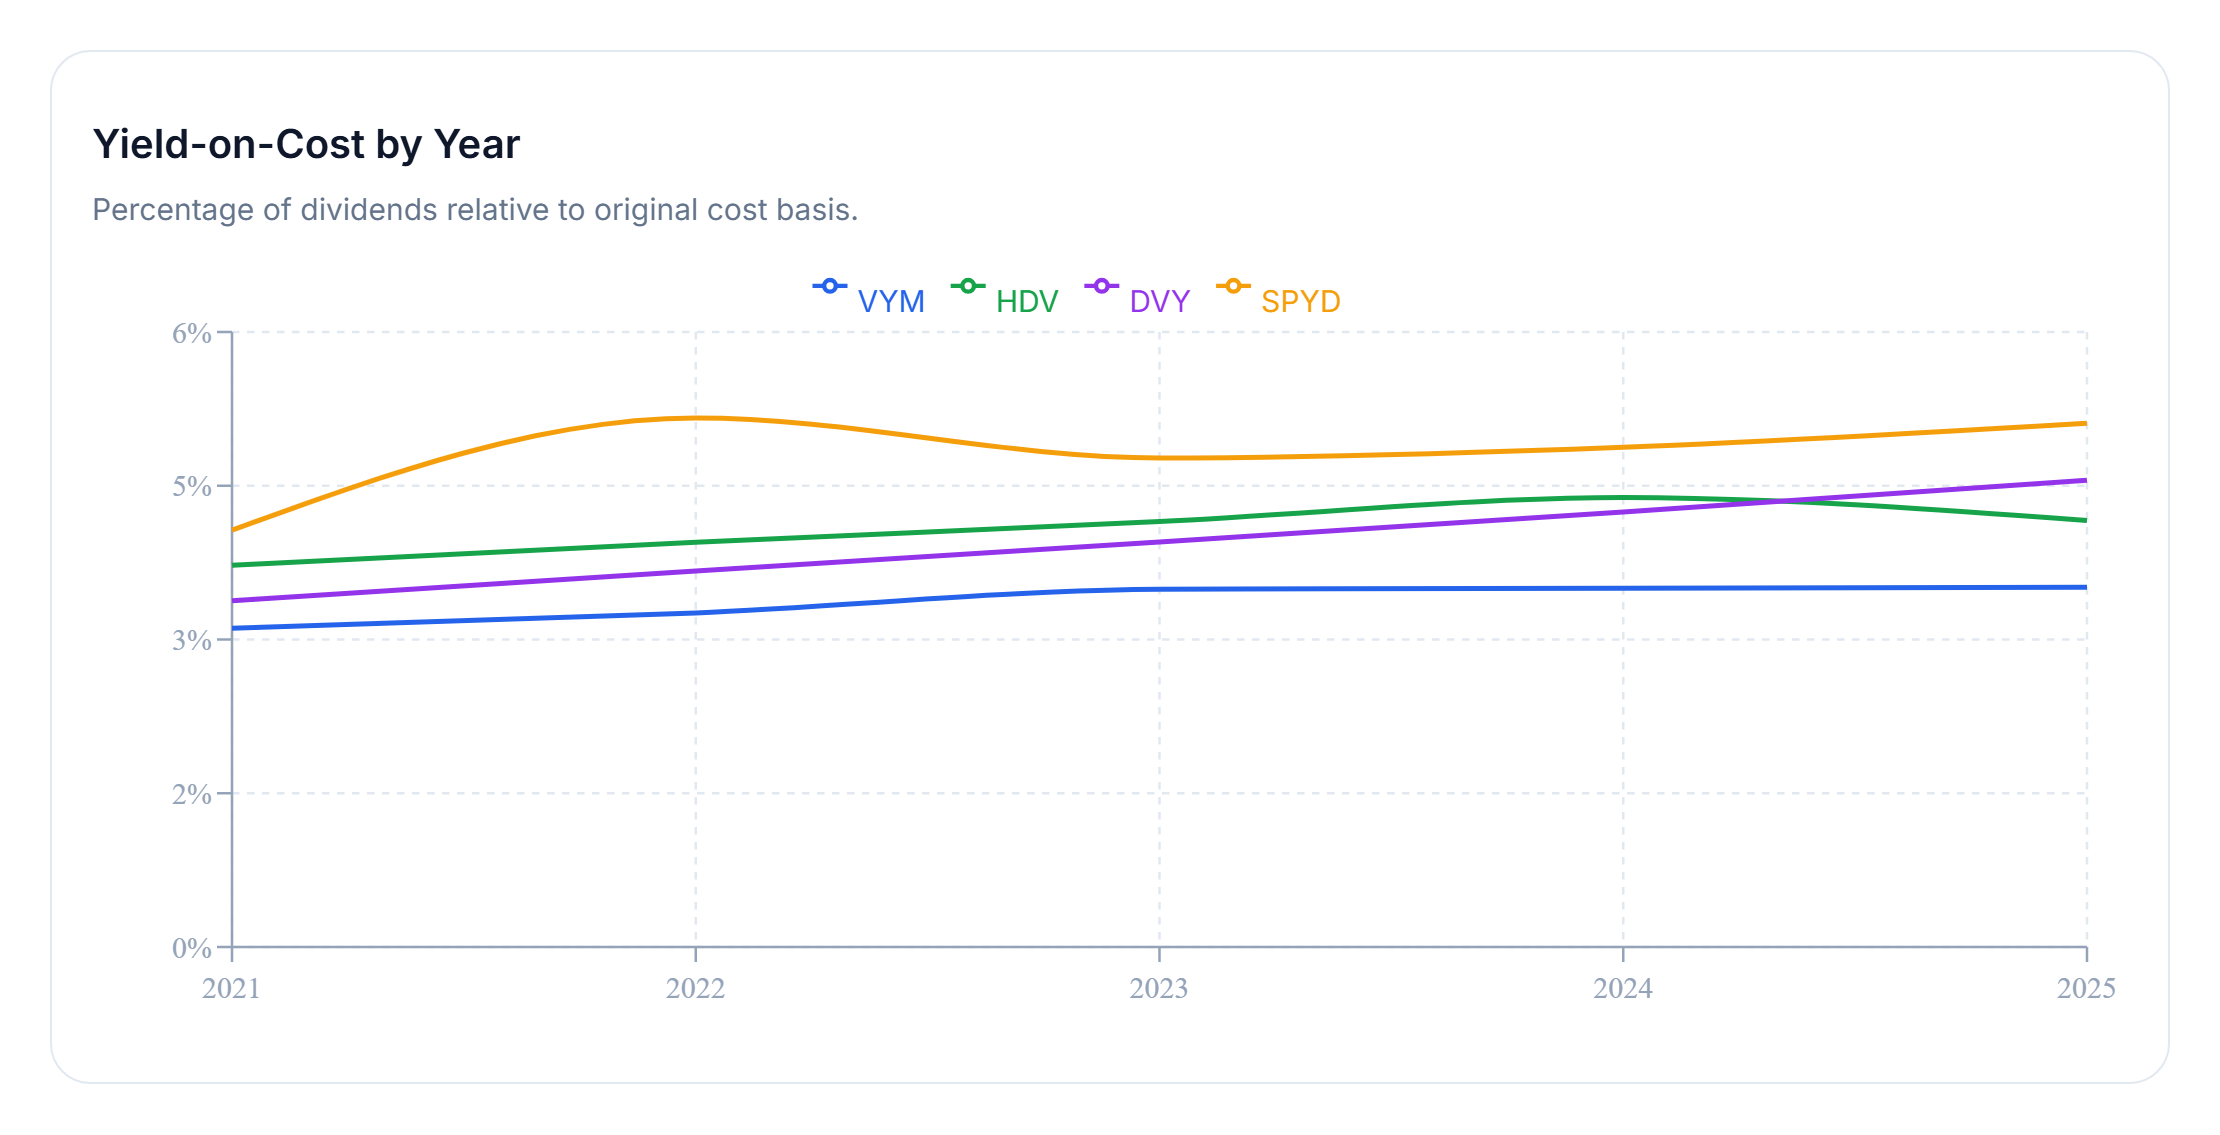
Yield-on-cost measures dividend income relative to the original capital invested. Unlike current yield, it illustrates how efficiently a holding grows income over time.
Over the five-year window, SPYD stands out with the strongest income efficiency, reaching approximately 5.11% yield on cost by the end of the period.
VYM, DVY, and HDV all show steady upward income trends as well, though their growth curves are somewhat more gradual. Even modest annual increases can compound meaningfully over longer investment horizons.
For dividend-focused investors, this metric highlights how portfolio construction and dividend policy translate into long-term income generation.
Final Takeaway
There is no single "perfect" high-yield dividend ETF. Each fund reflects a different balance between yield, dividend growth, and total return.
This battle shows that DVY currently dominates income growth metrics, while VYM leads in price appreciation. Meanwhile, SPYD demonstrates strong yield-on-cost efficiency, emphasizing income generation relative to initial capital.
Investors prioritizing immediate income efficiency may gravitate toward SPYD or DVY, while those seeking broader dividend exposure with stronger price appreciation may prefer VYM.
Ultimately, the most effective strategy may involve combining multiple dividend approaches to balance income stability, growth potential, and long-term portfolio resilience.