Dividend Growth of DIVO's Largest Holdings: The Path Behind the CAGR
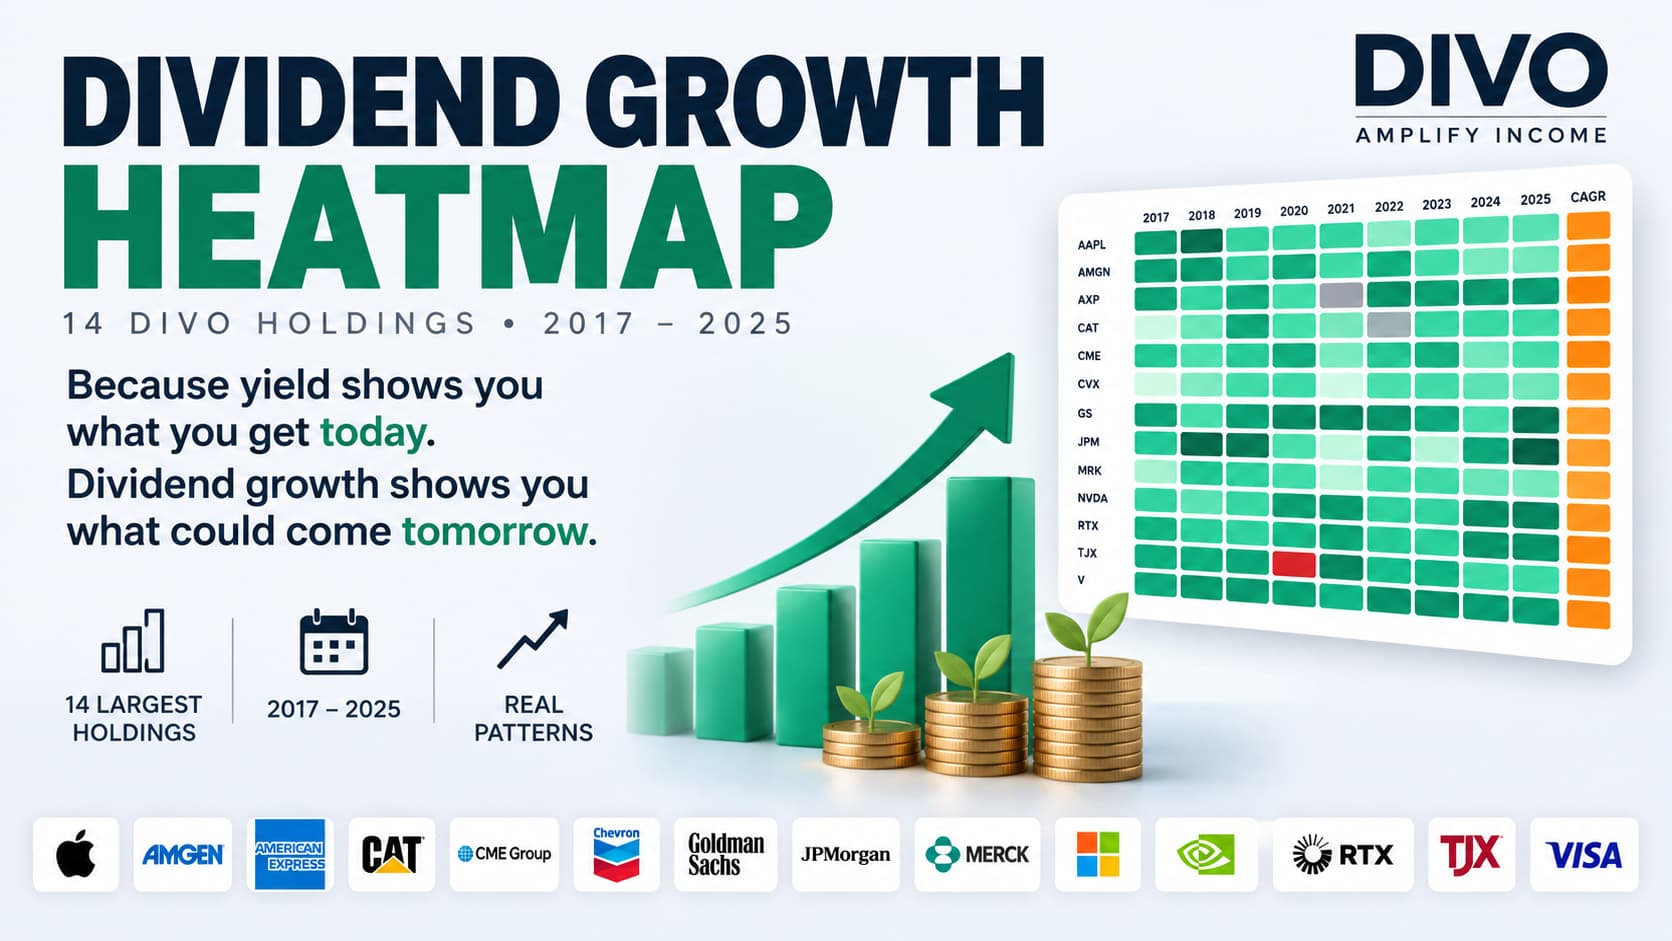
Dividend yield tells investors how much income a stock produces today. Dividend growth tells a different part of the story: how quickly that income stream has been changing over time.
For this comparison, I looked at fourteen of DIVO's largest holdings with dividend histories going back far enough to measure annual growth from 2017 through 2025.
The heatmaps reveal something that a single CAGR number cannot. Companies can arrive at similar long-term growth rates through very different paths — steady annual increases, periods of acceleration, dividend freezes, cuts, or dramatic recoveries.
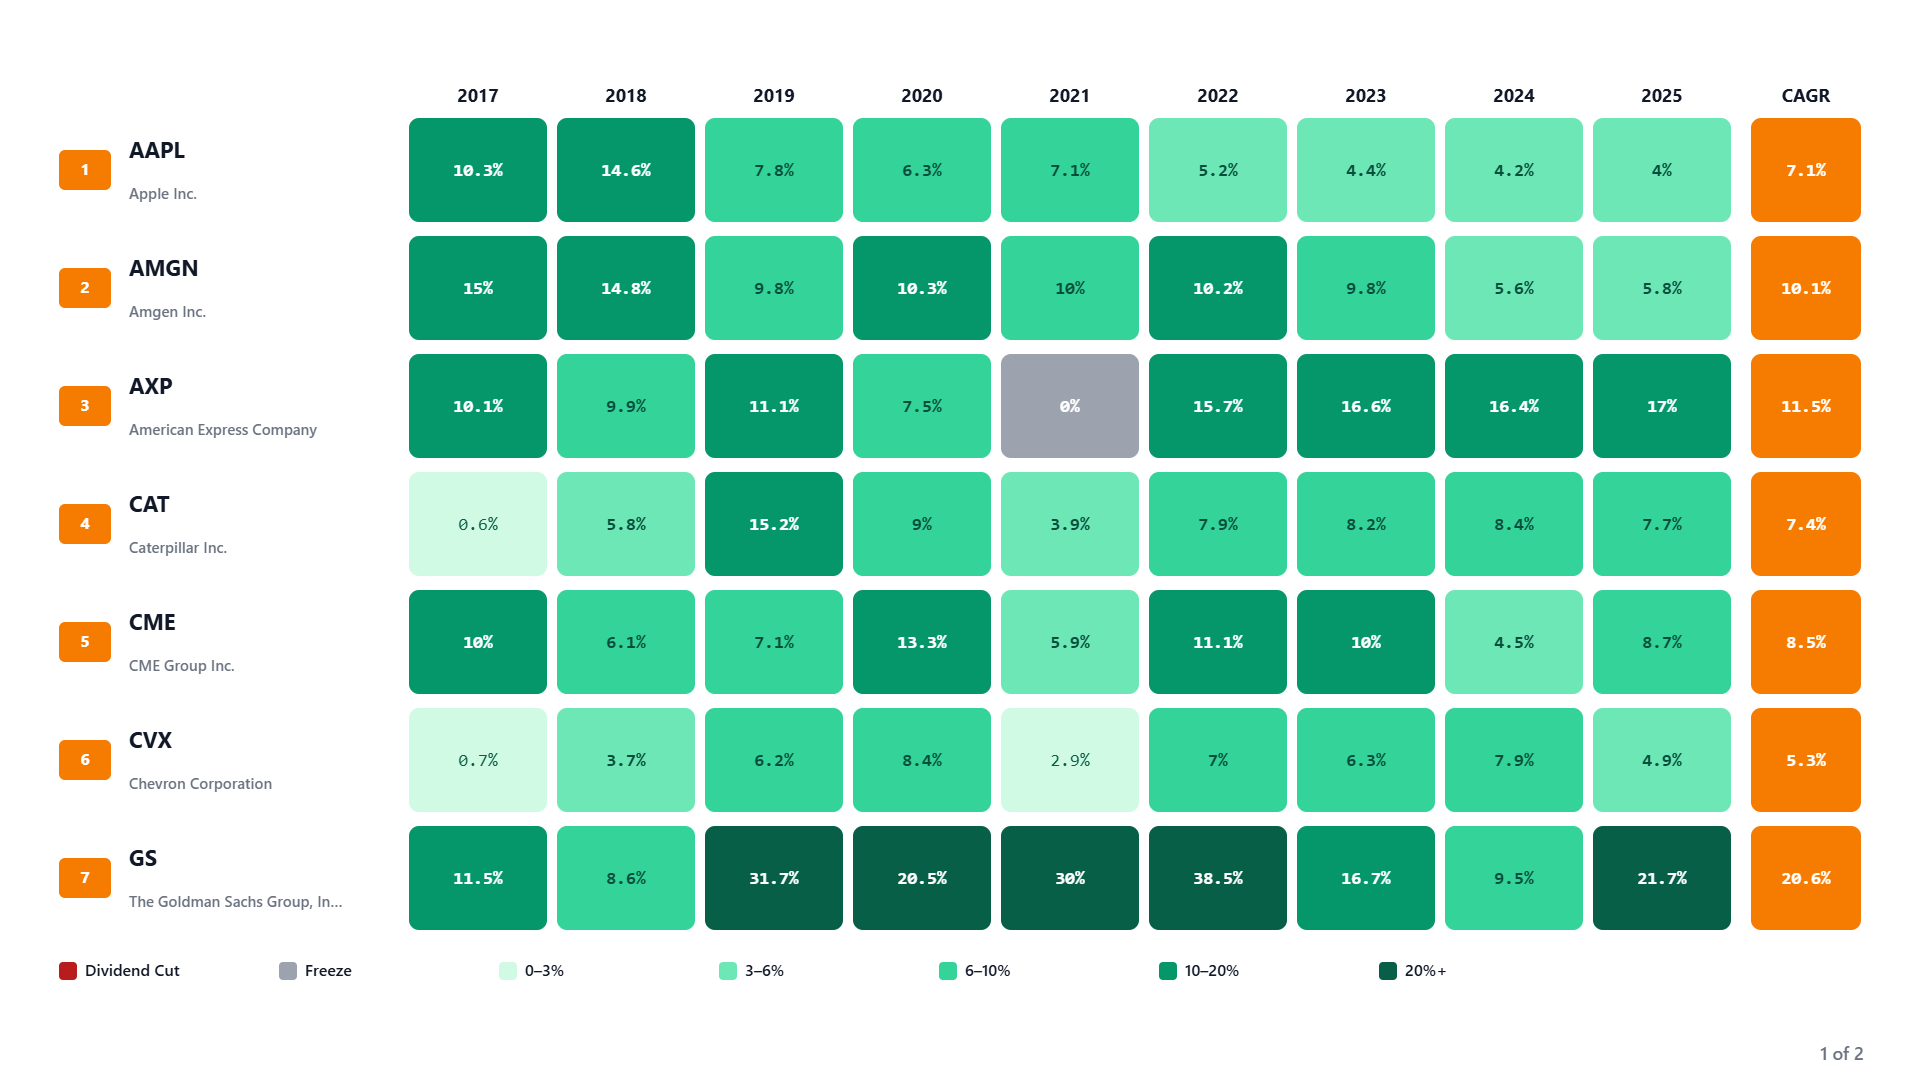
The first seven companies already show how different those paths can be.
Apple began the period with much faster dividend growth, including a 14.6% increase in 2018, but its growth rate gradually slowed to 4% by 2025. Amgen followed a somewhat similar pattern from a higher starting level, delivering roughly 10% to 15% growth through much of the earlier period before slowing to 5.8% in 2025.
American Express moved in the opposite direction. After freezing its dividend in 2021, growth returned strongly with a 15.7% increase in 2022 followed by three consecutive years above 16%.
Caterpillar and CME occupy more of the middle ground. Their annual increases varied from year to year, but both continued growing their dividends throughout the period shown.
Chevron presents a more restrained profile. Most of its increases remained in the low-to-mid single digits, producing relatively steady but slower dividend growth.
Goldman Sachs stands out at the other extreme. Its dividend increased 31.7% in 2019, 30% in 2021, 38.5% in 2022 and another 21.7% in 2025. That resulted in a 20.6% CAGR for the period, the highest on this chart.
The important distinction is not simply which company finished with the highest CAGR. The annual data shows whether that growth came steadily or through much larger swings.
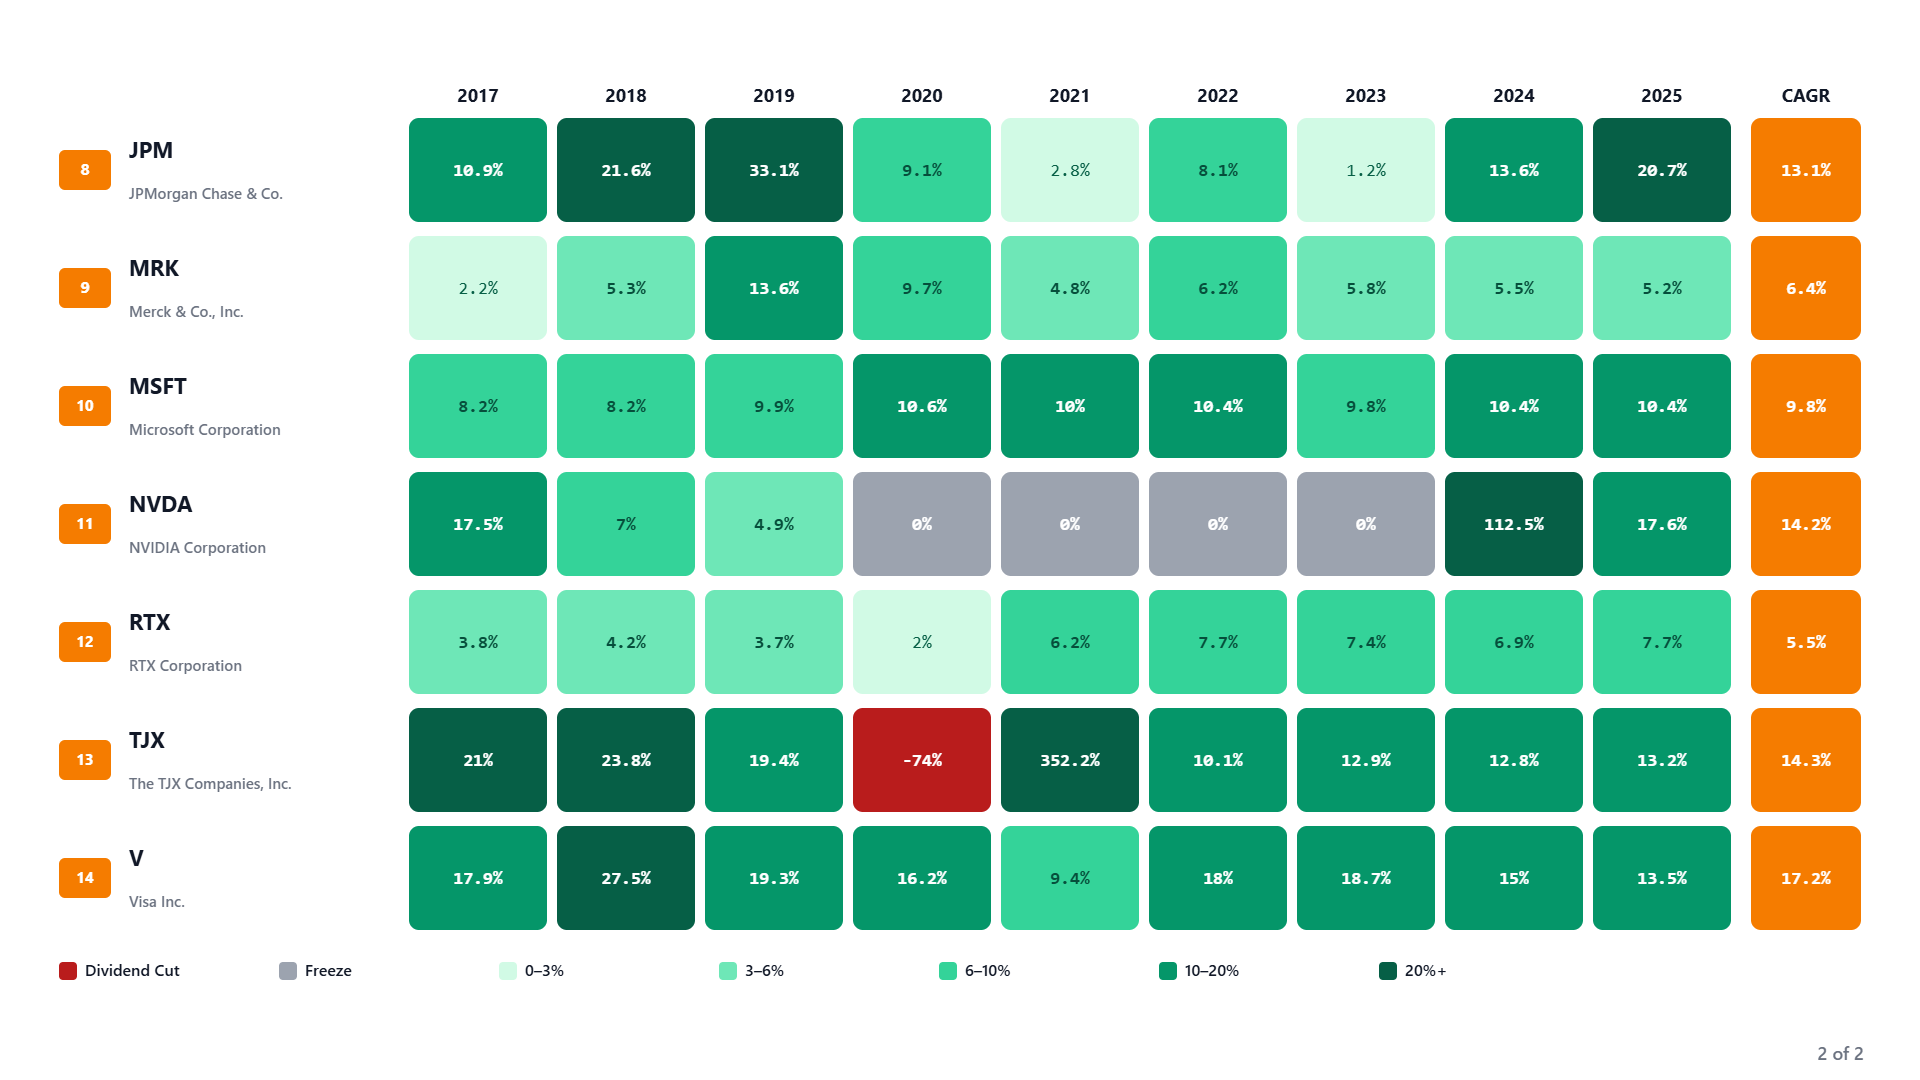
The second group makes that distinction even clearer.
JPMorgan's dividend growth was volatile, ranging from just 1.2% in 2023 to more than 33% in 2019. More recently, growth accelerated again, reaching 13.6% in 2024 and 20.7% in 2025.
Microsoft offers a very different pattern. Its individual increases are less dramatic, but their consistency stands out. Every annual increase from 2019 through 2025 remained close to 10%.
Nvidia demonstrates why a high growth number can require additional context. Its dividend was frozen for four consecutive years before increasing 112.5% in 2024 and another 17.6% in 2025.
TJX provides an even more extreme example. Its dividend fell 74% in 2020 before rebounding by more than 350% the following year. Since that recovery, dividend growth has settled into consistent double-digit increases.
Visa stands out in another way. It combined strong dividend growth with no freeze or cut anywhere on the heatmap, finishing 2025 with 13.5% growth and a 17.2% CAGR for the period.
These histories illustrate why the same summary metric can represent very different experiences for an income investor.
Final Takeaway
CAGR is useful because it compresses years of dividend history into one comparable number. But that convenience also removes information.
A smooth series of roughly 10% annual increases is fundamentally different from a dividend that is frozen or cut and later produces an enormous rebound. Both can eventually generate attractive CAGR figures, but the paths behind those figures are not the same.
For long-term dividend investors, that path can matter just as much as the final growth rate. Looking at annual dividend changes alongside CAGR provides a clearer picture of consistency, volatility and how a company's dividend policy has evolved over time.
DividendXray is designed to make those patterns easier to see, so investors can look beyond a single yield or growth number and understand the history behind it.