MAIN vs ARCC vs HTGC vs CSWC vs TSLX: 10 Years of Dividend Income Growth
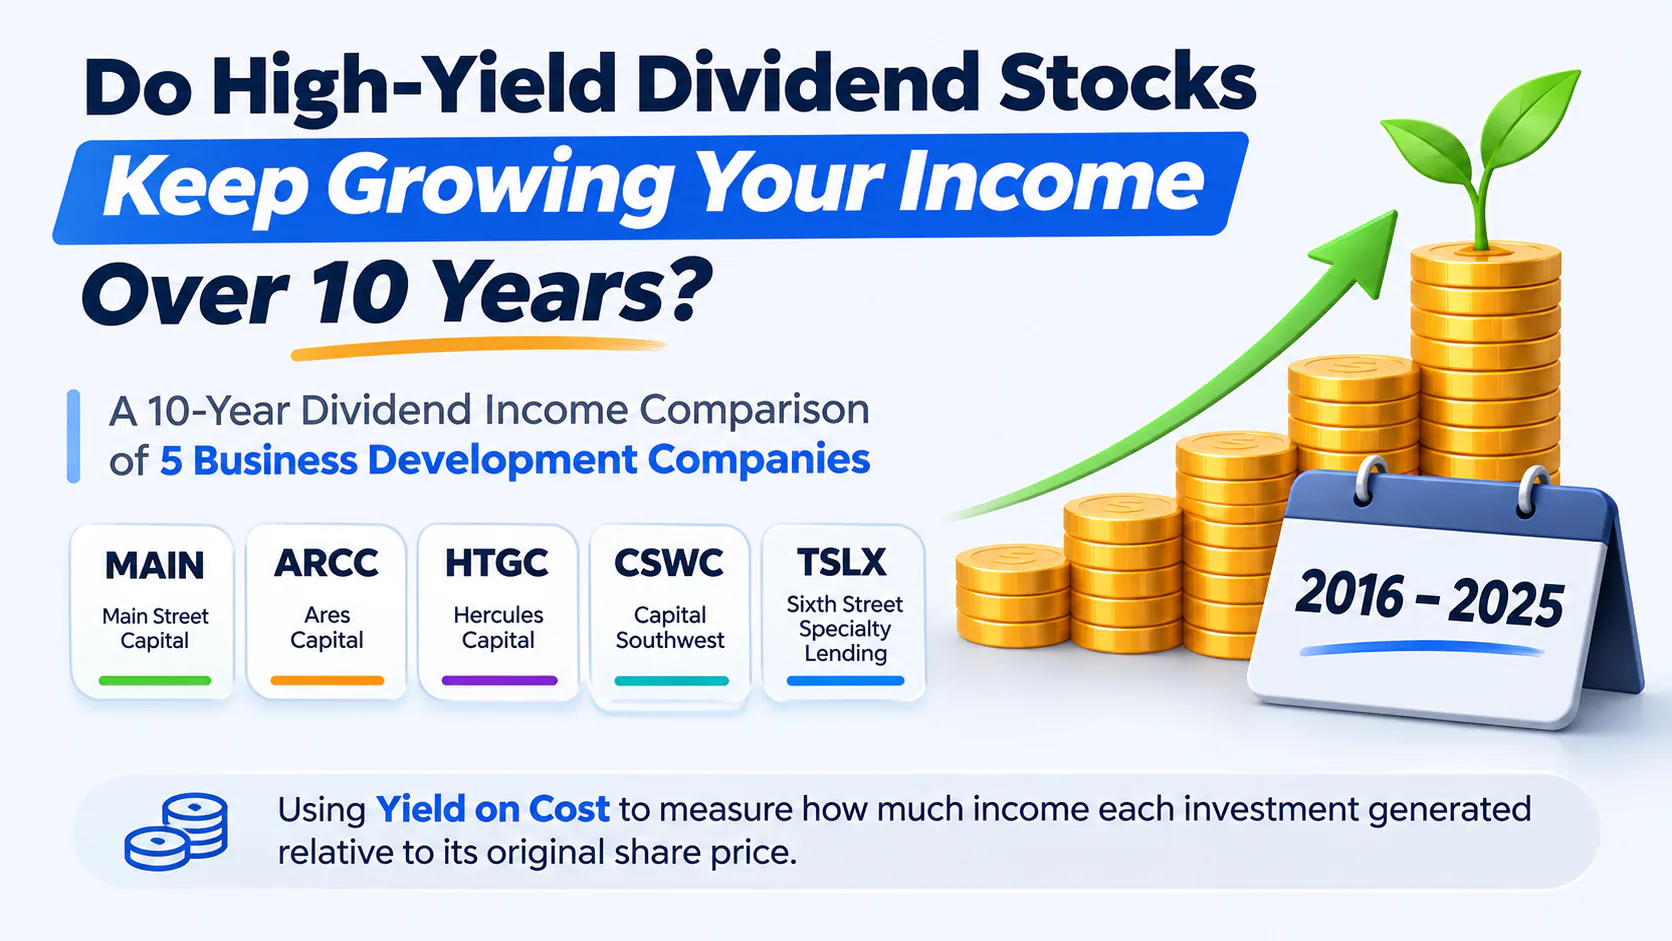
High dividend yields can be attractive, but how much does that income actually grow over time?
For investors holding business development companies (BDCs), the starting yield is only part of the story. Dividend growth, payout consistency, and supplemental distributions can all influence the income an investment generates over the years.
This DividendXray analysis compares five established BDCs: Main Street Capital (MAIN), Ares Capital (ARCC), Hercules Capital (HTGC), Capital Southwest (CSWC), and Sixth Street Specialty Lending (TSLX).
Using annual yield on cost, we track how their dividend income developed from 2016 through 2025, relative to their original 2016 share prices.
Explore the Interactive Chart
Want to explore the data behind the images below? Load the interactive version here.
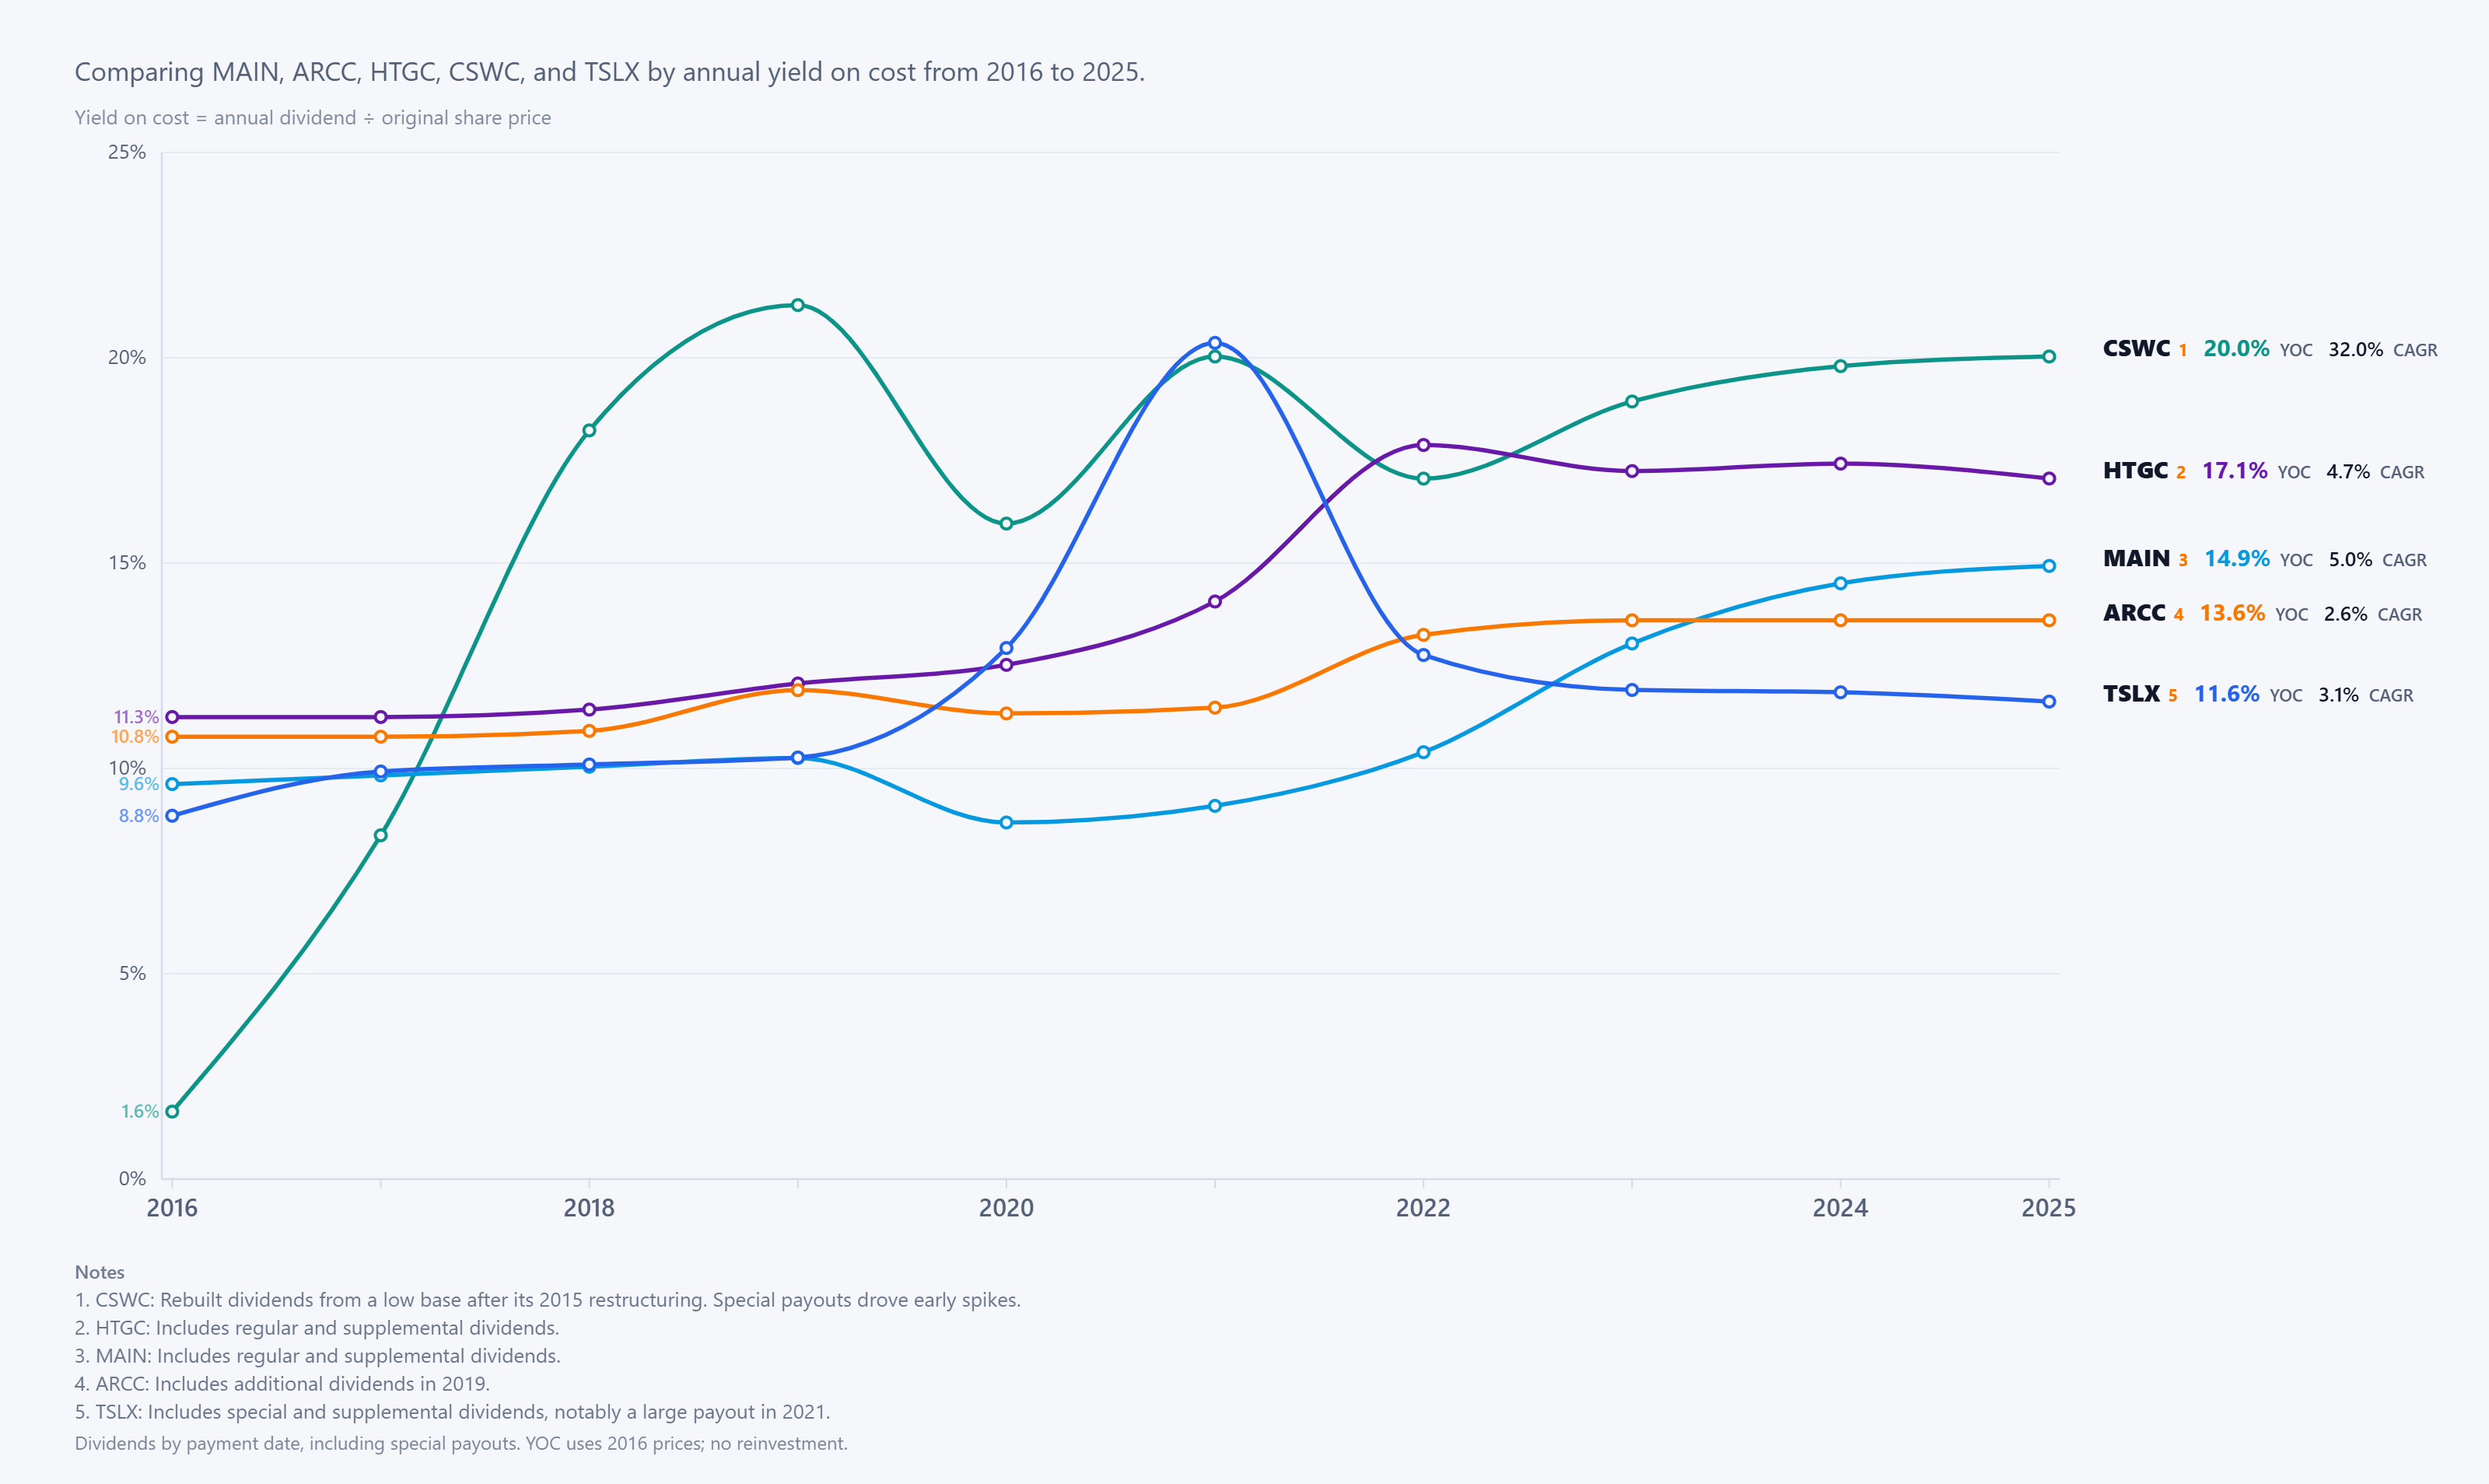
The chart reveals five very different dividend income journeys.
Capital Southwest (CSWC) delivered the strongest income expansion in this comparison. Its yield on cost climbed from just 1.6% in 2016 to 20.0% in 2025.
However, that growth needs context. CSWC was rebuilding its dividend following a 2015 restructuring, and special distributions contributed to some of its early spikes. Its impressive long-term growth did not follow a smooth path.
Hercules Capital (HTGC) followed a different trajectory. Starting with an already high yield on cost of 11.3%, it reached 17.1% by 2025. Much of that expansion occurred after 2020, although annual distributions moderated slightly from their 2022 peak.
Main Street Capital (MAIN) stands out for its relatively consistent income progression. Total annual distributions declined in 2020 when supplemental payments disappeared, but its regular monthly dividend actually increased that year.
Total income subsequently recovered and continued growing, bringing MAIN's yield on cost from 9.6% in 2016 to 14.9% in 2025.
Ares Capital (ARCC) demonstrated a steadier pattern. Its yield on cost gradually increased from 10.8% to 13.6%, with annual distributions remaining unchanged from 2023 through 2025.
While its income growth was more modest than some competitors, the chart shows fewer dramatic fluctuations.
Sixth Street Specialty Lending (TSLX) illustrates why special dividends deserve attention. Its yield on cost surged above 20% in 2021, supported by a large special distribution, before declining to 11.6% in 2025.
That peak represented substantial income for the year, but not necessarily a sustainable recurring payout.
What the Comparison Reveals
Three important distinctions emerge from the chart:
- Starting yield: A higher initial yield does not guarantee stronger long-term income growth.
- Dividend growth: Income can expand significantly over time, even from a relatively low starting point.
- Income consistency: Special and supplemental dividends can boost annual payouts, but they may also introduce volatility.
The comparison also highlights why looking at a single year's dividend yield can be misleading. A large special payment may temporarily push income higher without representing a permanent increase in the regular dividend.
Understanding the Methodology
Yield on cost is calculated by dividing each year's total dividends per share by the stock's original 2016 share price.
The analysis includes regular, supplemental, and special dividends based on payment dates.
It assumes no dividend reinvestment and excludes share price appreciation. The figures therefore describe historical dividend income relative to the original purchase price, not total investment returns or current dividend yields.
Final Takeaway
The five BDCs demonstrate that high starting yields, long-term dividend growth, and income consistency are not necessarily the same thing.
CSWC delivered the largest income expansion, HTGC achieved substantial growth from an already high starting yield, MAIN showed relatively consistent long-term progress, ARCC followed a steadier path, and TSLX demonstrated the influence of special distributions.
For dividend investors, the practical lesson is to look beyond today's yield. Understanding how regular dividends develop, how much income comes from supplemental payments, and how distributions behave across different market conditions can provide a more complete picture.
Explore more historical dividend comparisons and interactive visualizations on DividendXray.
Educational content only. Not financial advice.