High-Yield BDC Portfolio: BXSL vs OBDC vs HTGC vs ARCC Income Analysis
Portfolio Overview
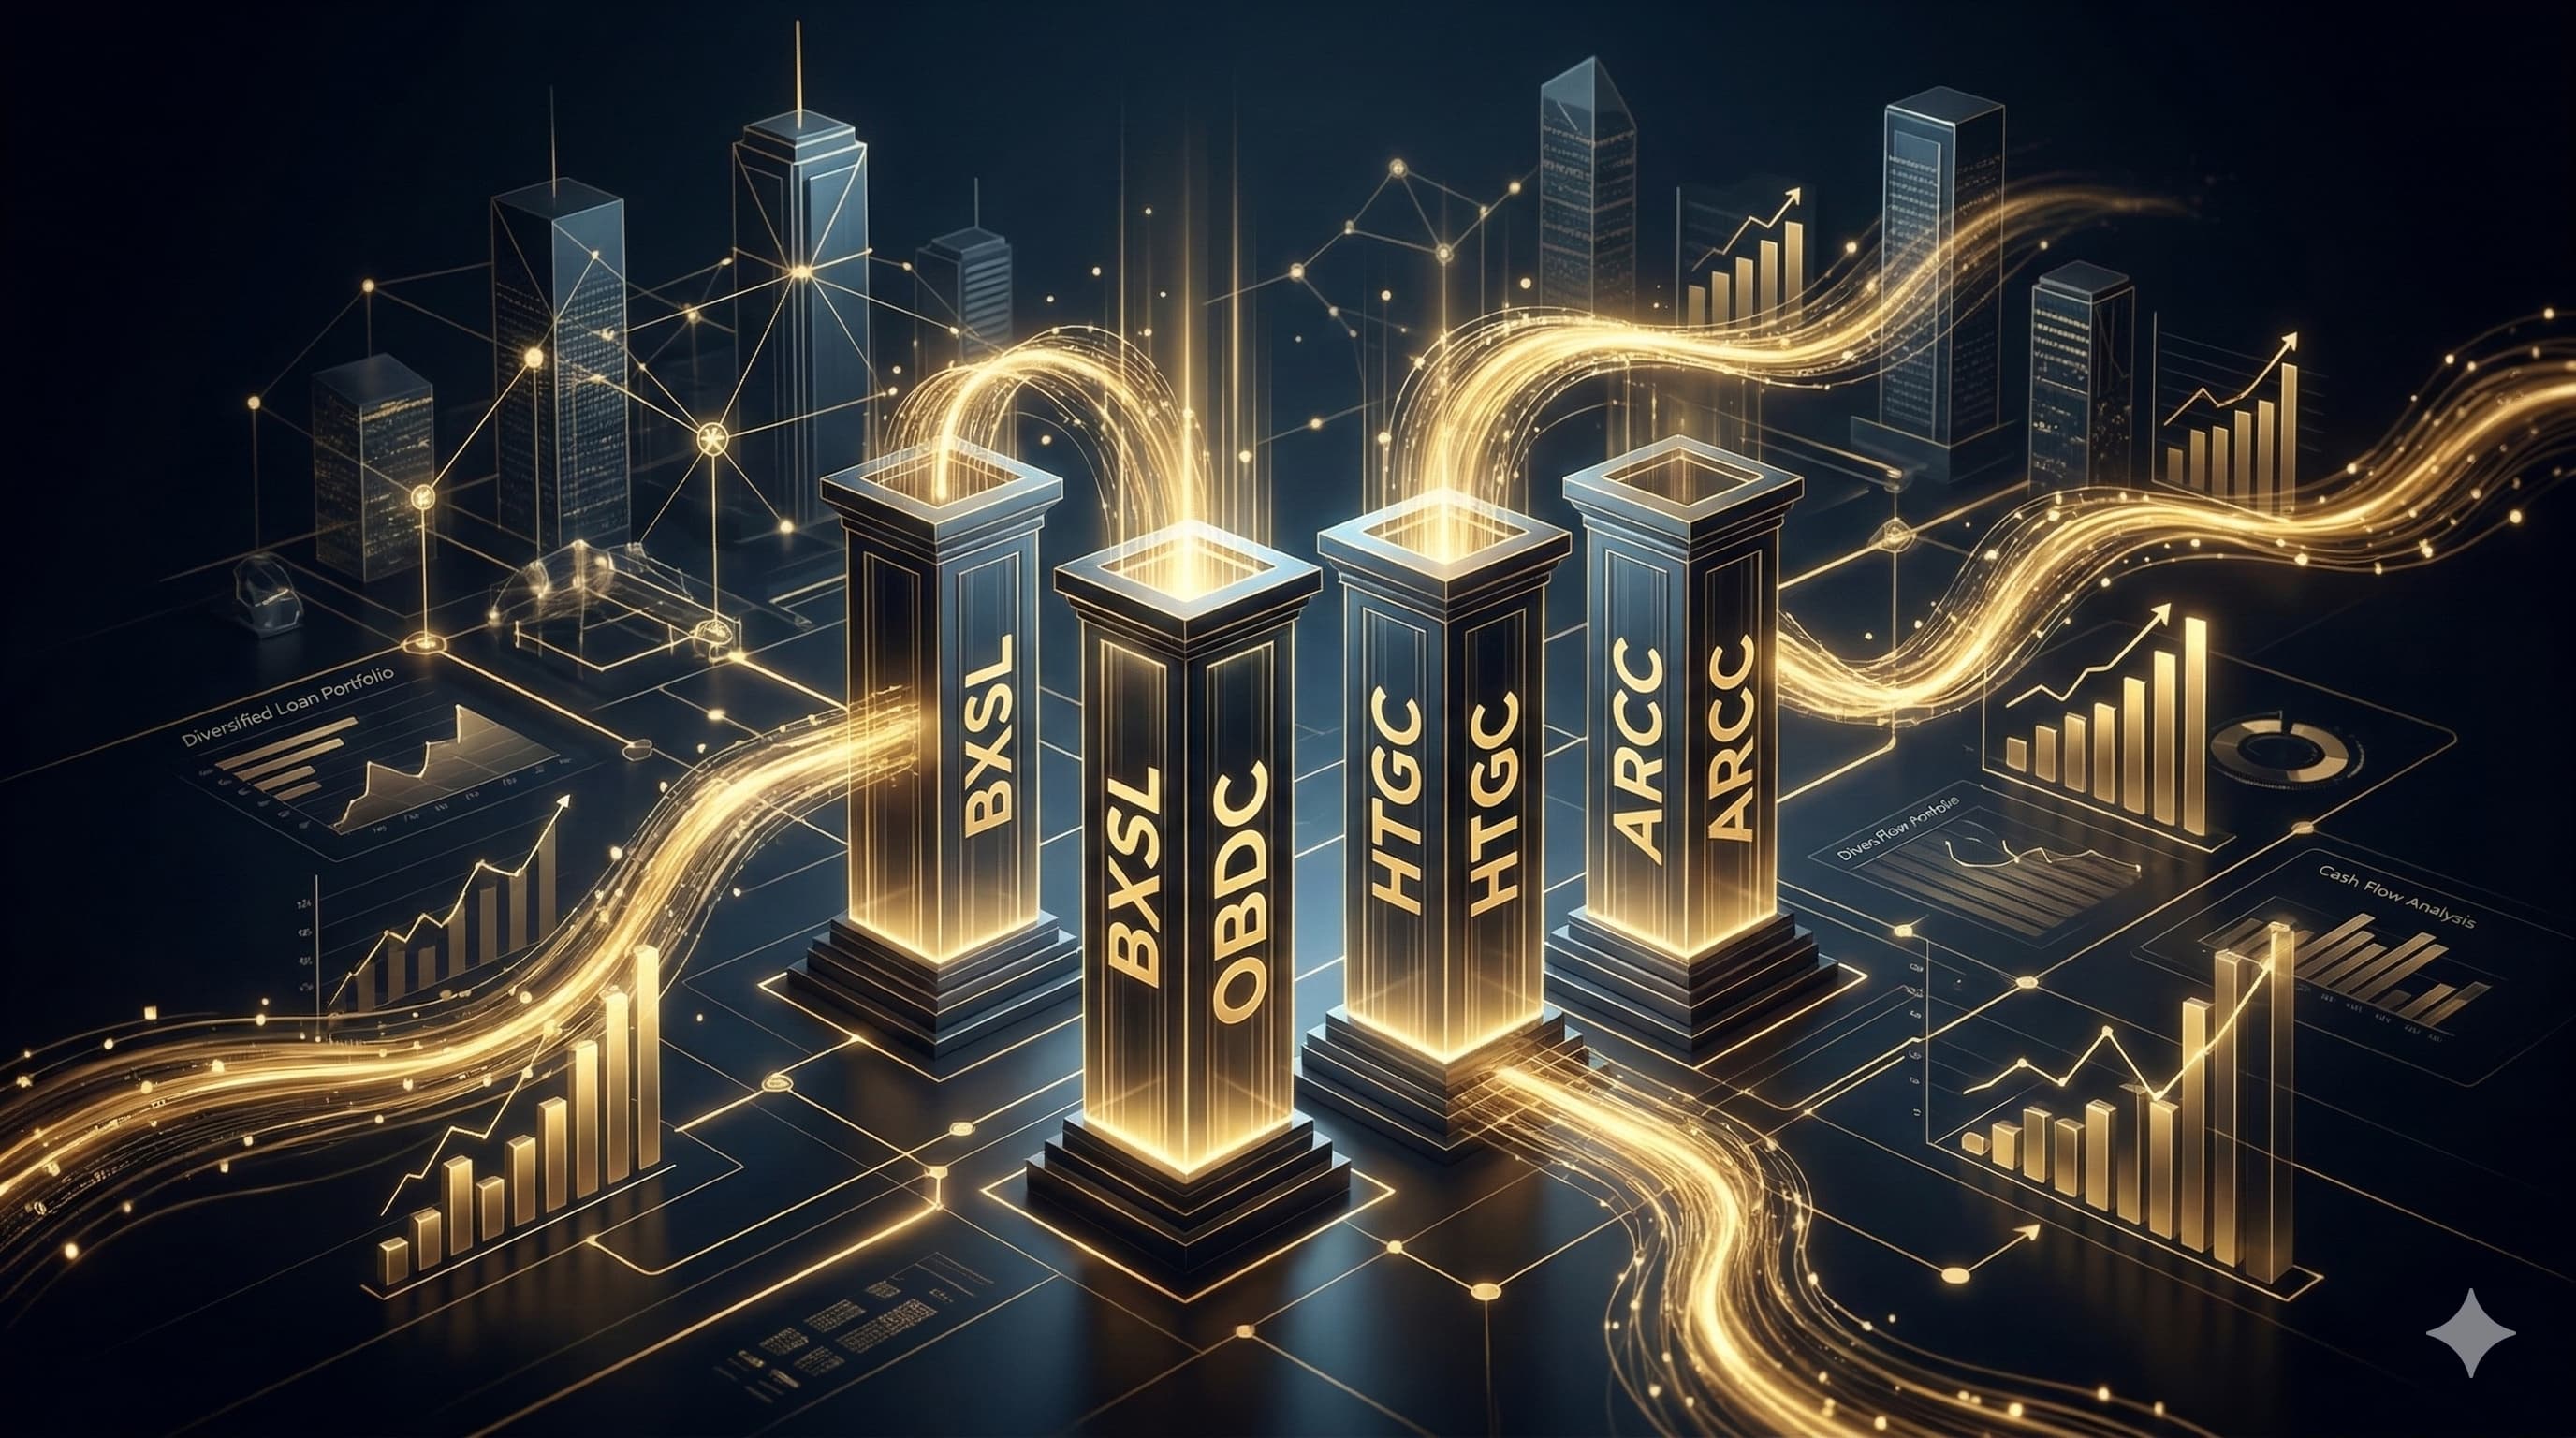
This portfolio is built around high-yield private credit lenders that generate strong income through direct lending to middle-market companies. It combines Blackstone Secured Lending Fund (BXSL), Blue Owl Capital Corporation (OBDC), Hercules Capital (HTGC), and Ares Capital Corporation (ARCC) — four major business development companies operating in the private credit space.
BXSL and OBDC provide large-scale direct lending exposure backed by major asset management platforms. HTGC adds venture-focused lending tied to technology and growth-stage companies, while ARCC contributes stability through one of the largest and most established BDCs in the market.
Together, these holdings create a high-yield private credit income engine designed to generate substantial dividend cash flow from corporate lending activity.
Dividend Growth Trend
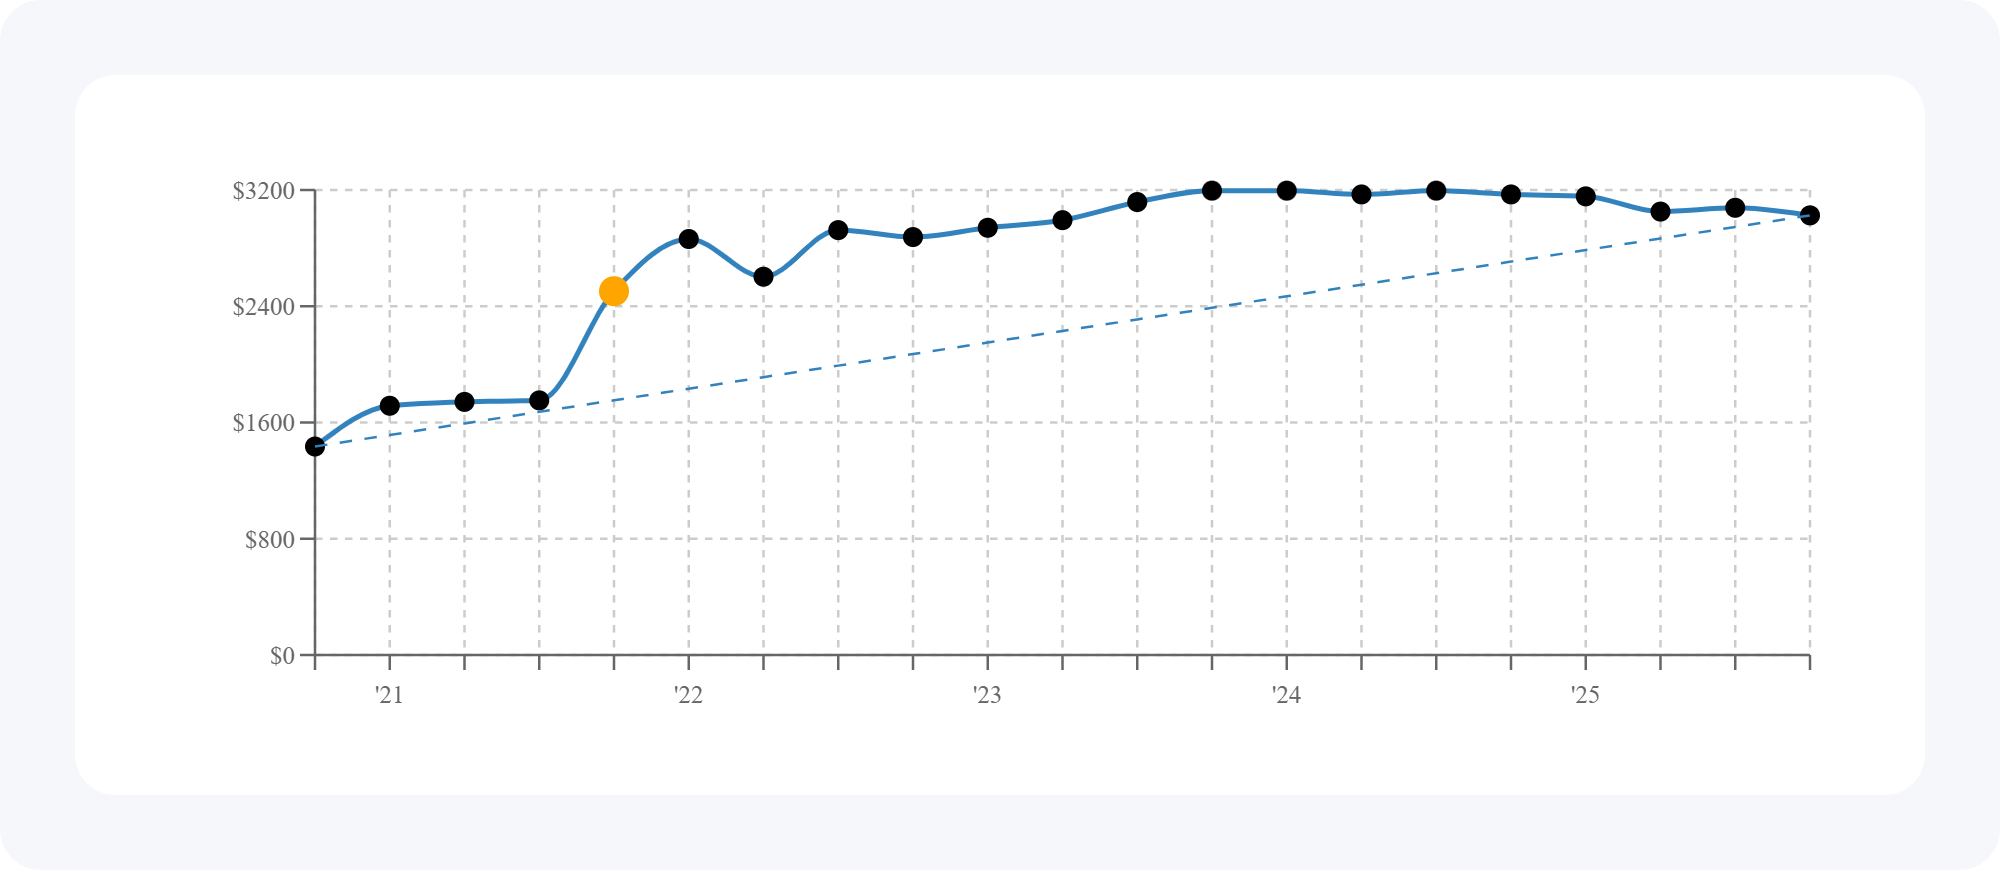
Here's the dividend growth trend for these holdings over the last five years.
The jump in the chart occurs because BXSL only began trading in late 2021, meaning the portfolio did not receive its dividends before that point.
Even with that later start, the overall trend highlights the core appeal of BDC investing: strong income generation supported by private credit lending, which can produce meaningful cash flow for income-focused portfolios.
Portfolio Snapshot

Here's the quick snapshot for this portfolio:
- Yield on cost: 12.1%
- Annual dividend income: $12,101 per year
- Monthly dividend income: about $1,008 per month
- Dividend income growth: roughly 6.5% per year over five years
- Average ETF expense ratio: 0% (there are no ETFs in this portfolio)
This portfolio represents a high-yield income strategy, prioritizing strong current cash flow generated by business development companies operating in the private credit market.
Income Breakdown by Holding
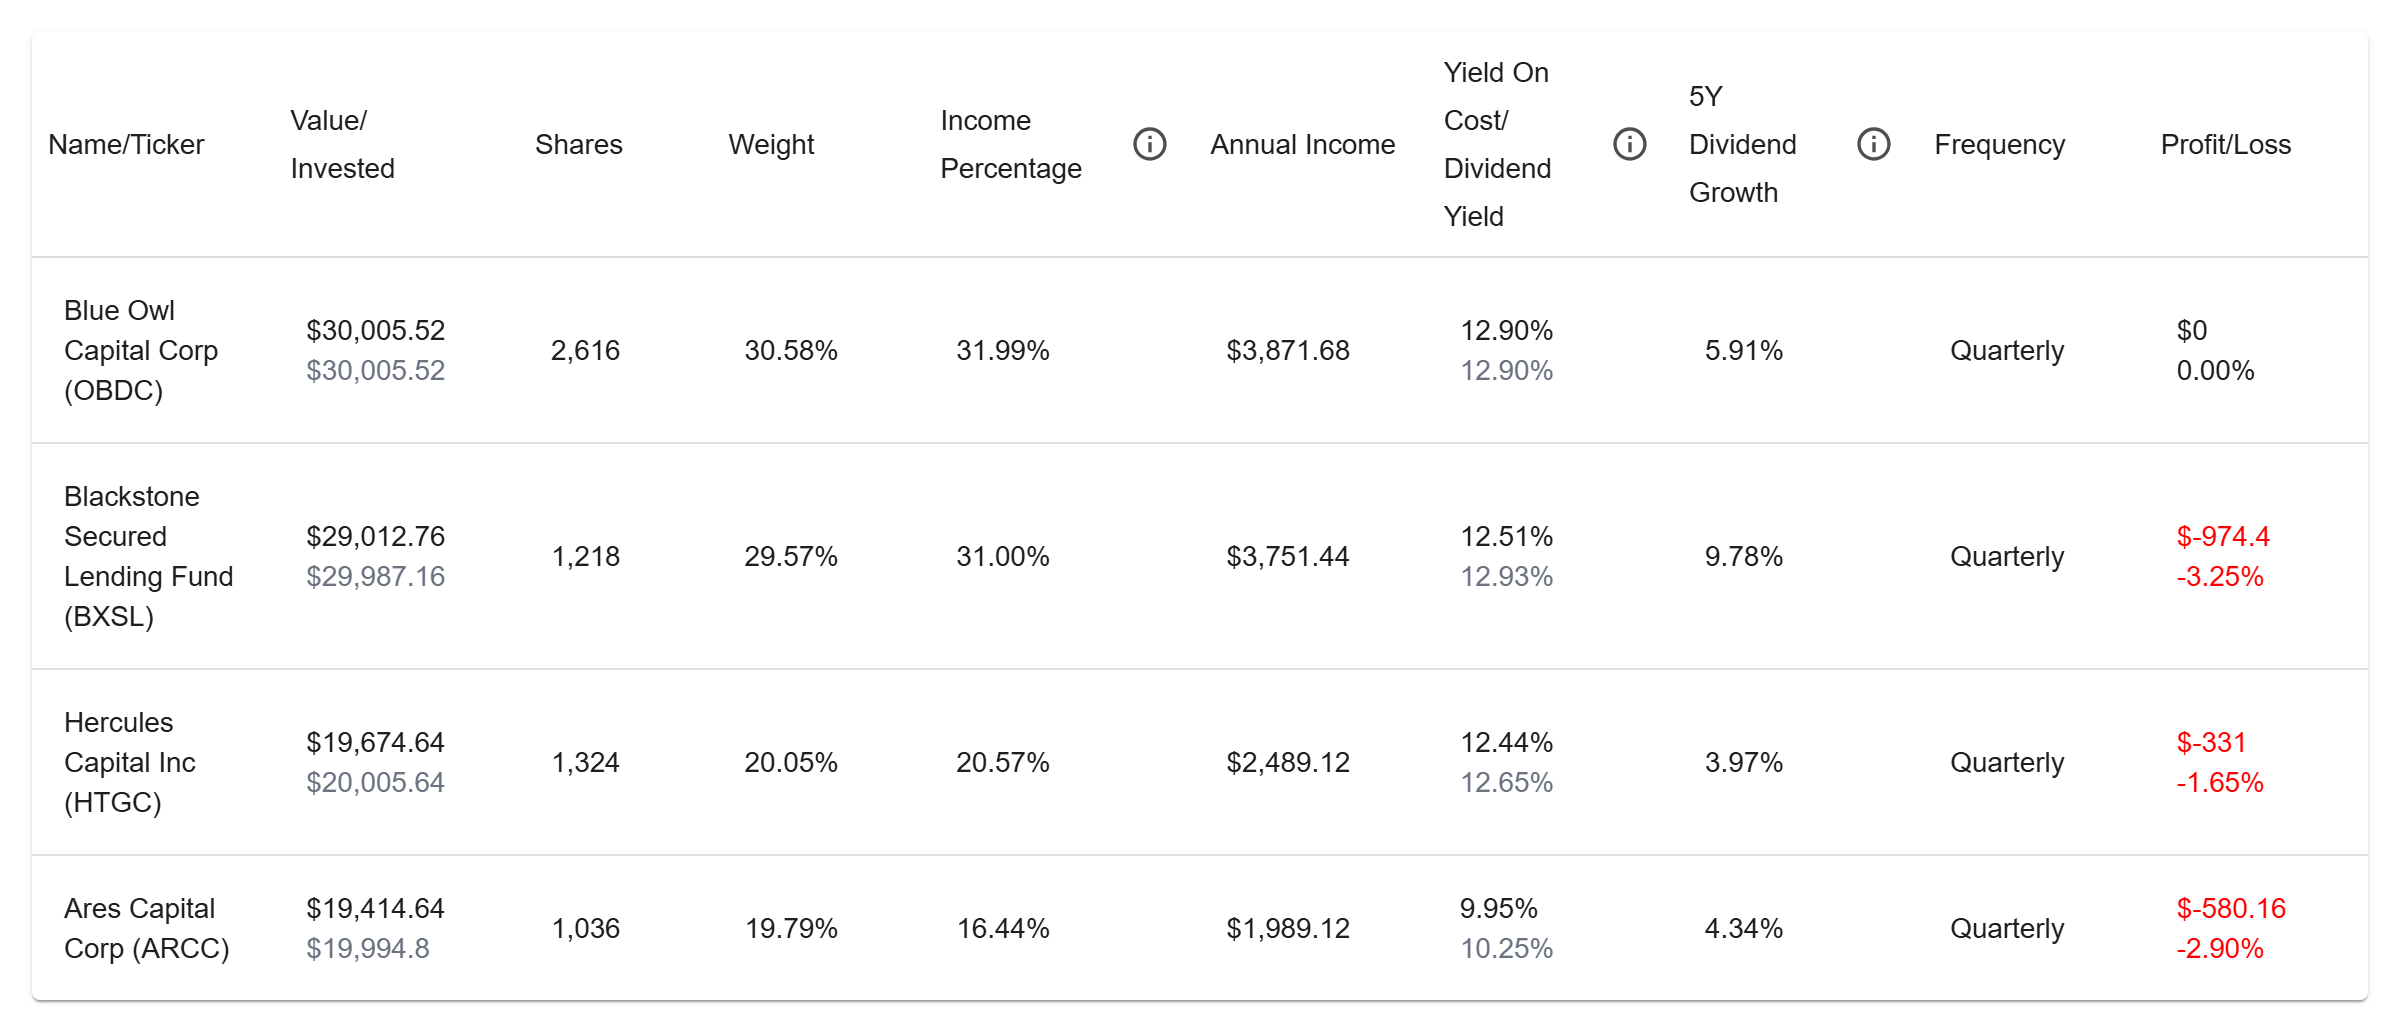
Here's how the portfolio's dividend income is split between the holdings:
- OBDC: about 32.0% of the income (roughly $3,872 per year)
- BXSL: about 31.0% (about $3,751 per year)
- HTGC: about 20.6% (about $2,489 per year)
- ARCC: about 16.4% (about $1,989 per year)
All holdings pay quarterly.
5-year dividend growth rates included in this portfolio:
- OBDC: 9.3%
- BXSL: 7.1%
- HTGC: 5.8%
- ARCC: 3.7%
This mix creates a diversified private credit dividend stream, combining large-scale direct lending platforms with specialized venture lending exposure.
Forward Income Outlook
If income growth continues in line with recent history, this portfolio's cash flow could rise steadily over time.
- Yield on cost may grow from 12.1% today to about 16.5% in five years
- Annual income could increase from $12,101 to roughly $16,541
- Monthly income could rise from $1,008 to about $1,378
- And this projection assumes no new capital added and no dividend reinvestment
This illustrates the power of high-yield income portfolios: when strong dividend payouts combine with moderate growth, the portfolio's cash flow can expand meaningfully over time.