LOW vs HD vs FAST vs SHW: 10-Year Dividend Growth & Income Battle
Portfolio Overview
In this DividendXray battle, we compare four established dividend growth stocks across income growth, yield-on-cost expansion, and share price appreciation over a ten-year period.
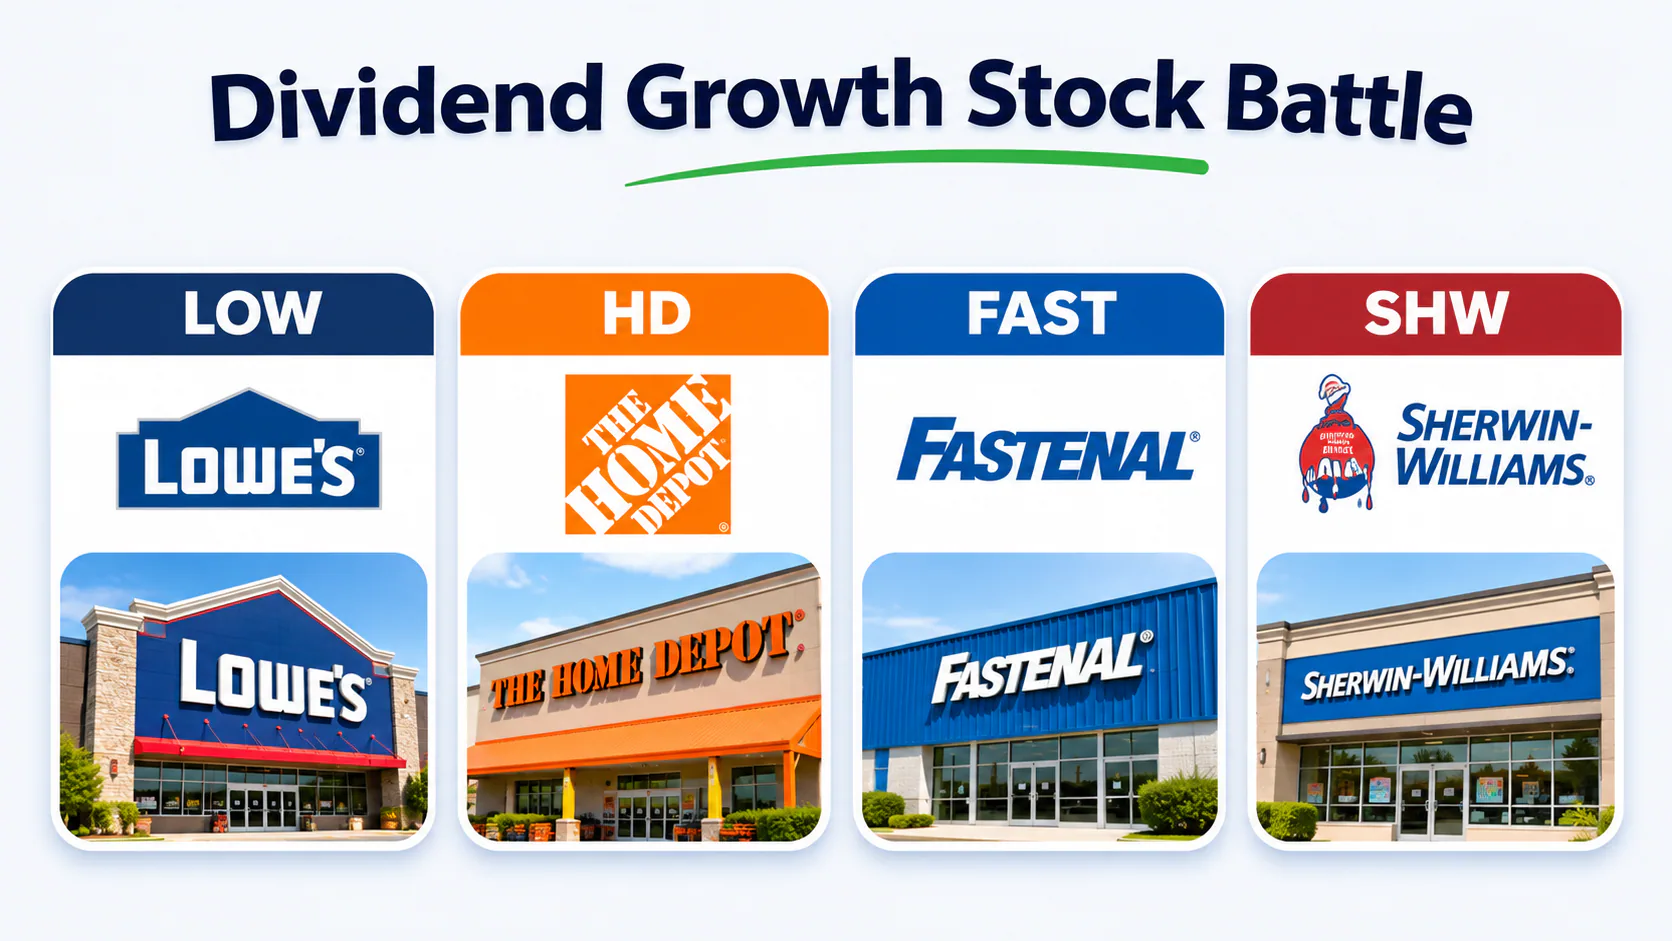
- LOW (Lowe's) is a major home improvement retailer with a long history of consistent dividend increases.
- HD (Home Depot) is a leading home improvement retailer known for strong profitability and dividend growth.
- FAST (Fastenal) distributes industrial and construction supplies, combining business growth with regular dividend payments.
- SHW (Sherwin-Williams) is a global leader in paints and coatings, with decades of consistent dividend increases.
All four companies have established dividend growth histories, but their starting yields, dividend growth rates, and share price performance create different outcomes for long-term investors.
This comparison examines not only which stock performed best historically, but also how those differences translate into today's income requirements and potential future dividend income.
Category Winners
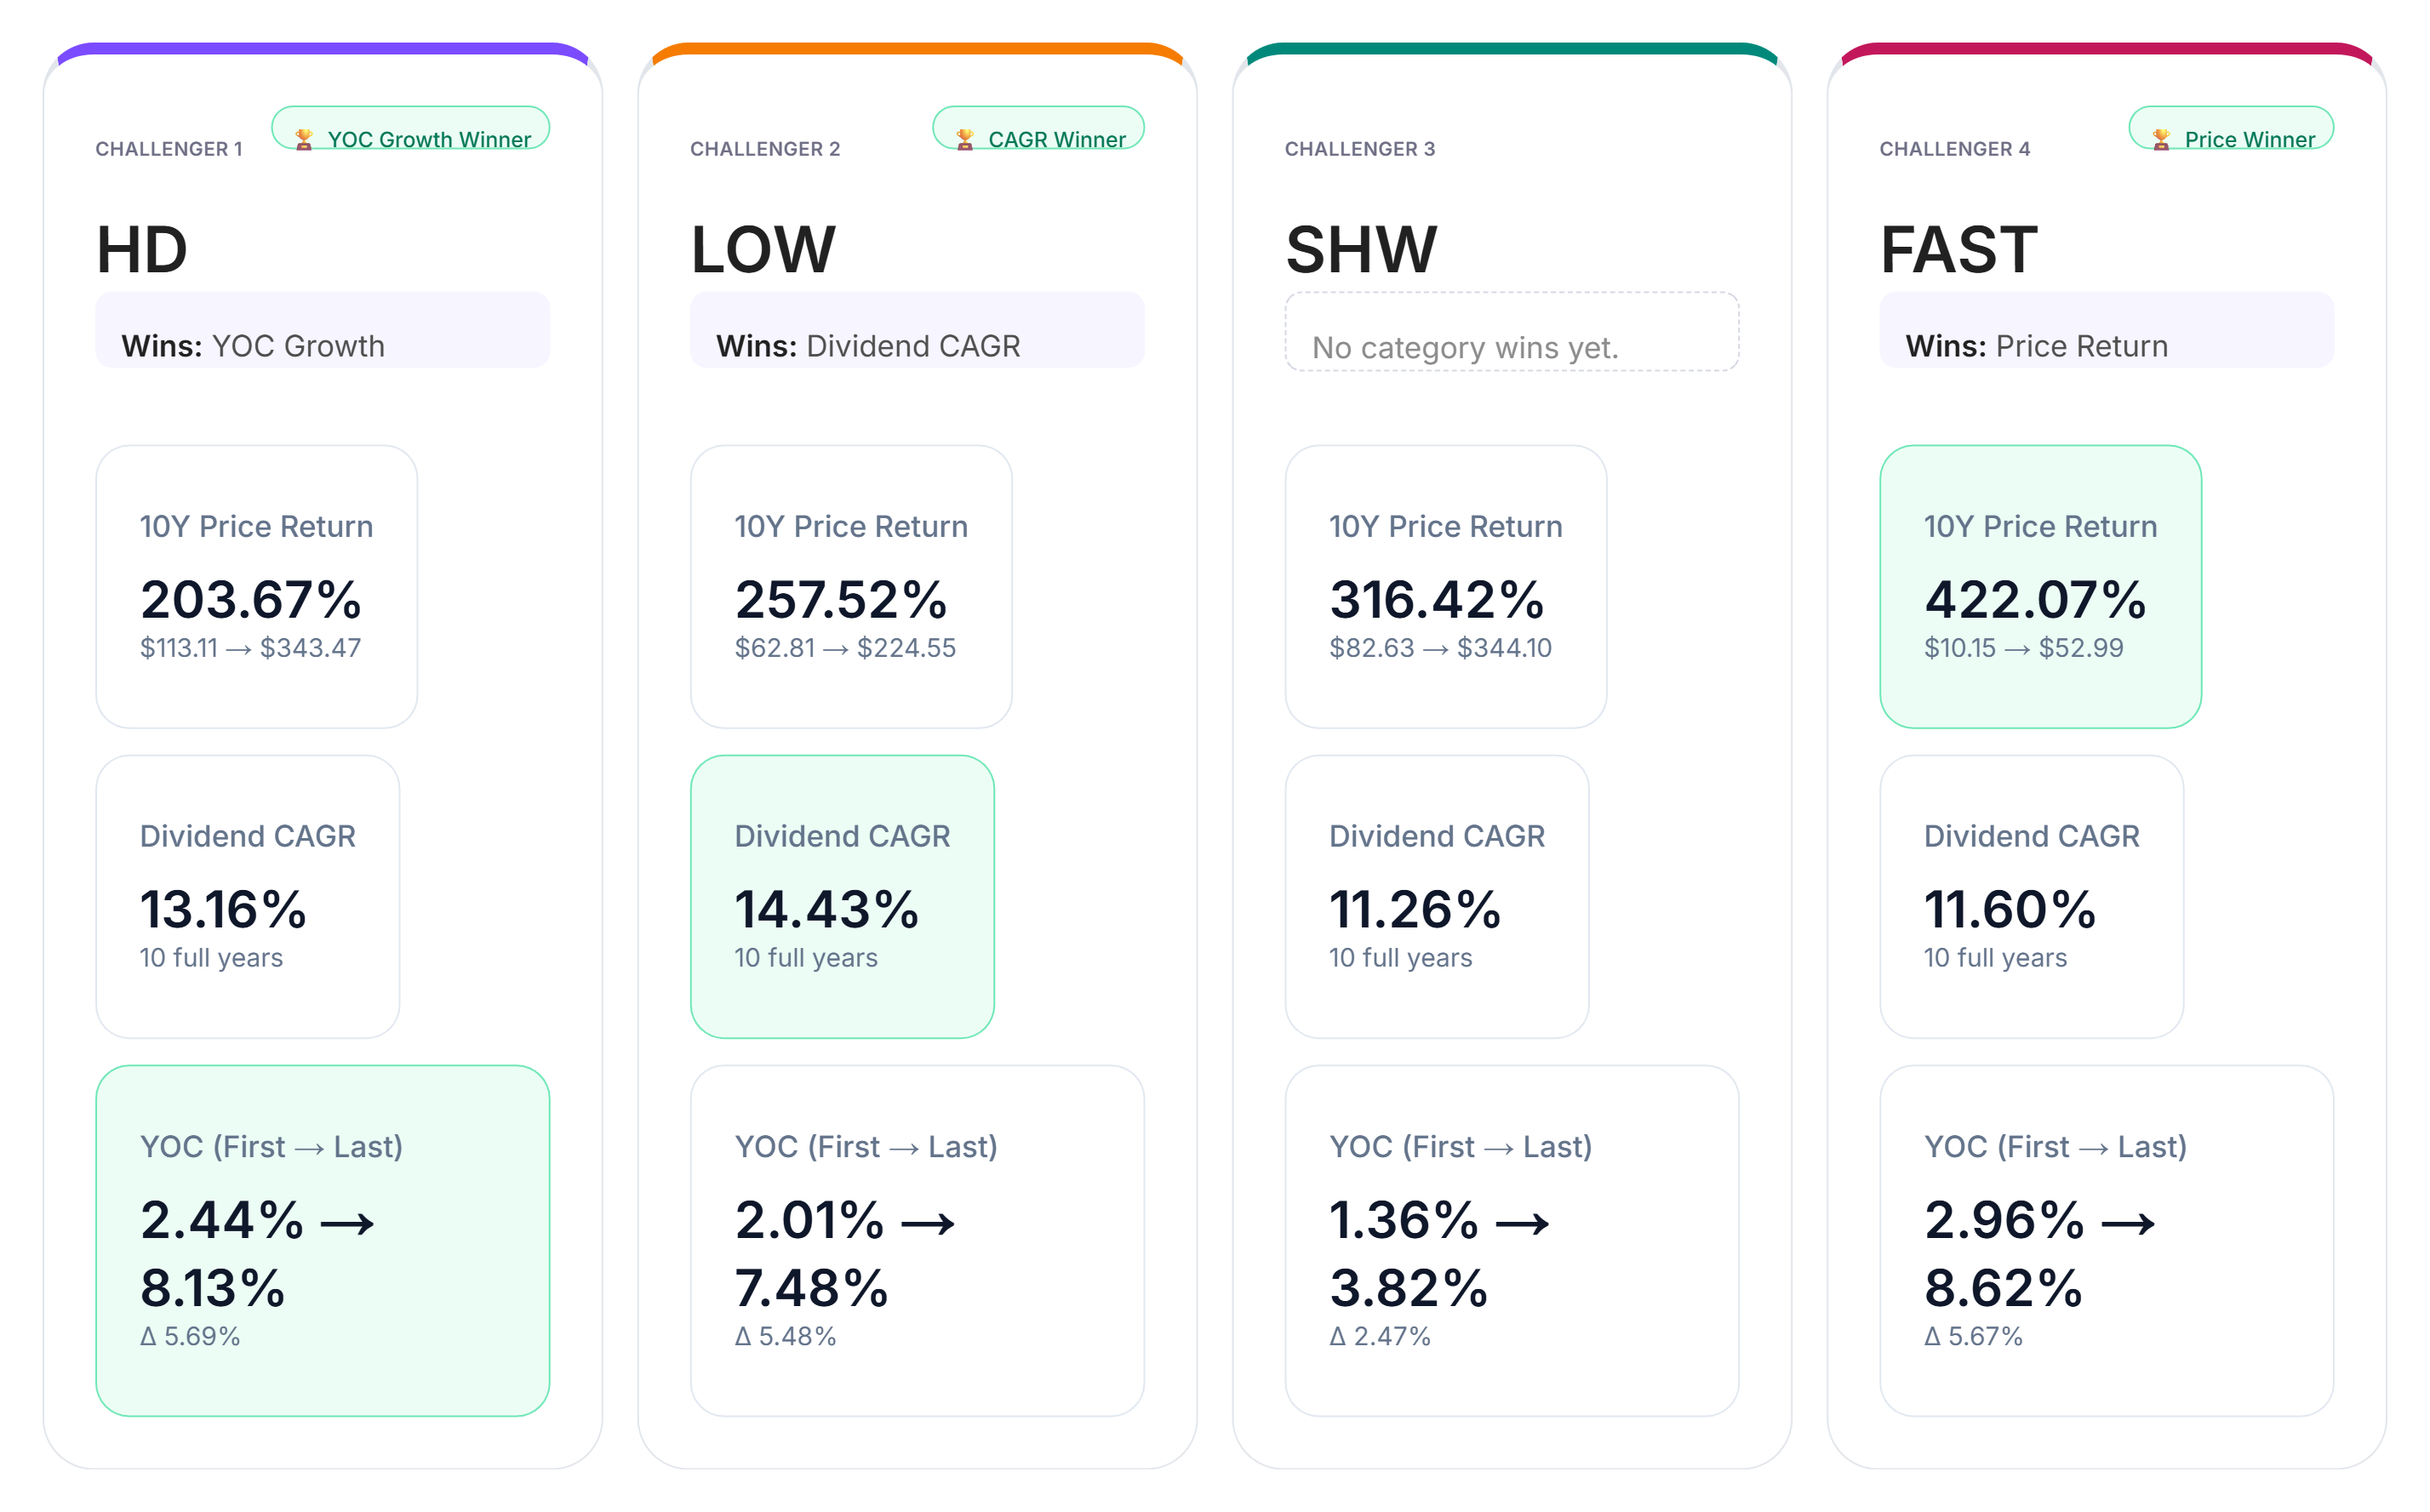
Looking at the ten-year results across dividend CAGR, yield-on-cost growth, and share price return, three different category leaders emerge.
In dividend growth, LOW takes the lead with a ten-year dividend CAGR of 14.43%. This measures the annualized growth rate of its dividend payments over the historical comparison period.
For yield-on-cost growth, HD shows the strongest improvement between the first and last year. This reflects the increase in dividend income relative to the original investment over the period.
In share price appreciation, FAST takes the top position with a ten-year price return of 422.07%, outperforming the other three companies in this category.
SHW delivers solid results across the comparison but does not secure a category win.
The results highlight an important distinction: the fastest dividend grower, the strongest yield-on-cost improver, and the best share price performer are not necessarily the same investment.
Investors evaluating dividend growth stocks should consider these measurements separately rather than treating any single metric as a complete picture of performance.
Yield-on-Cost by Year
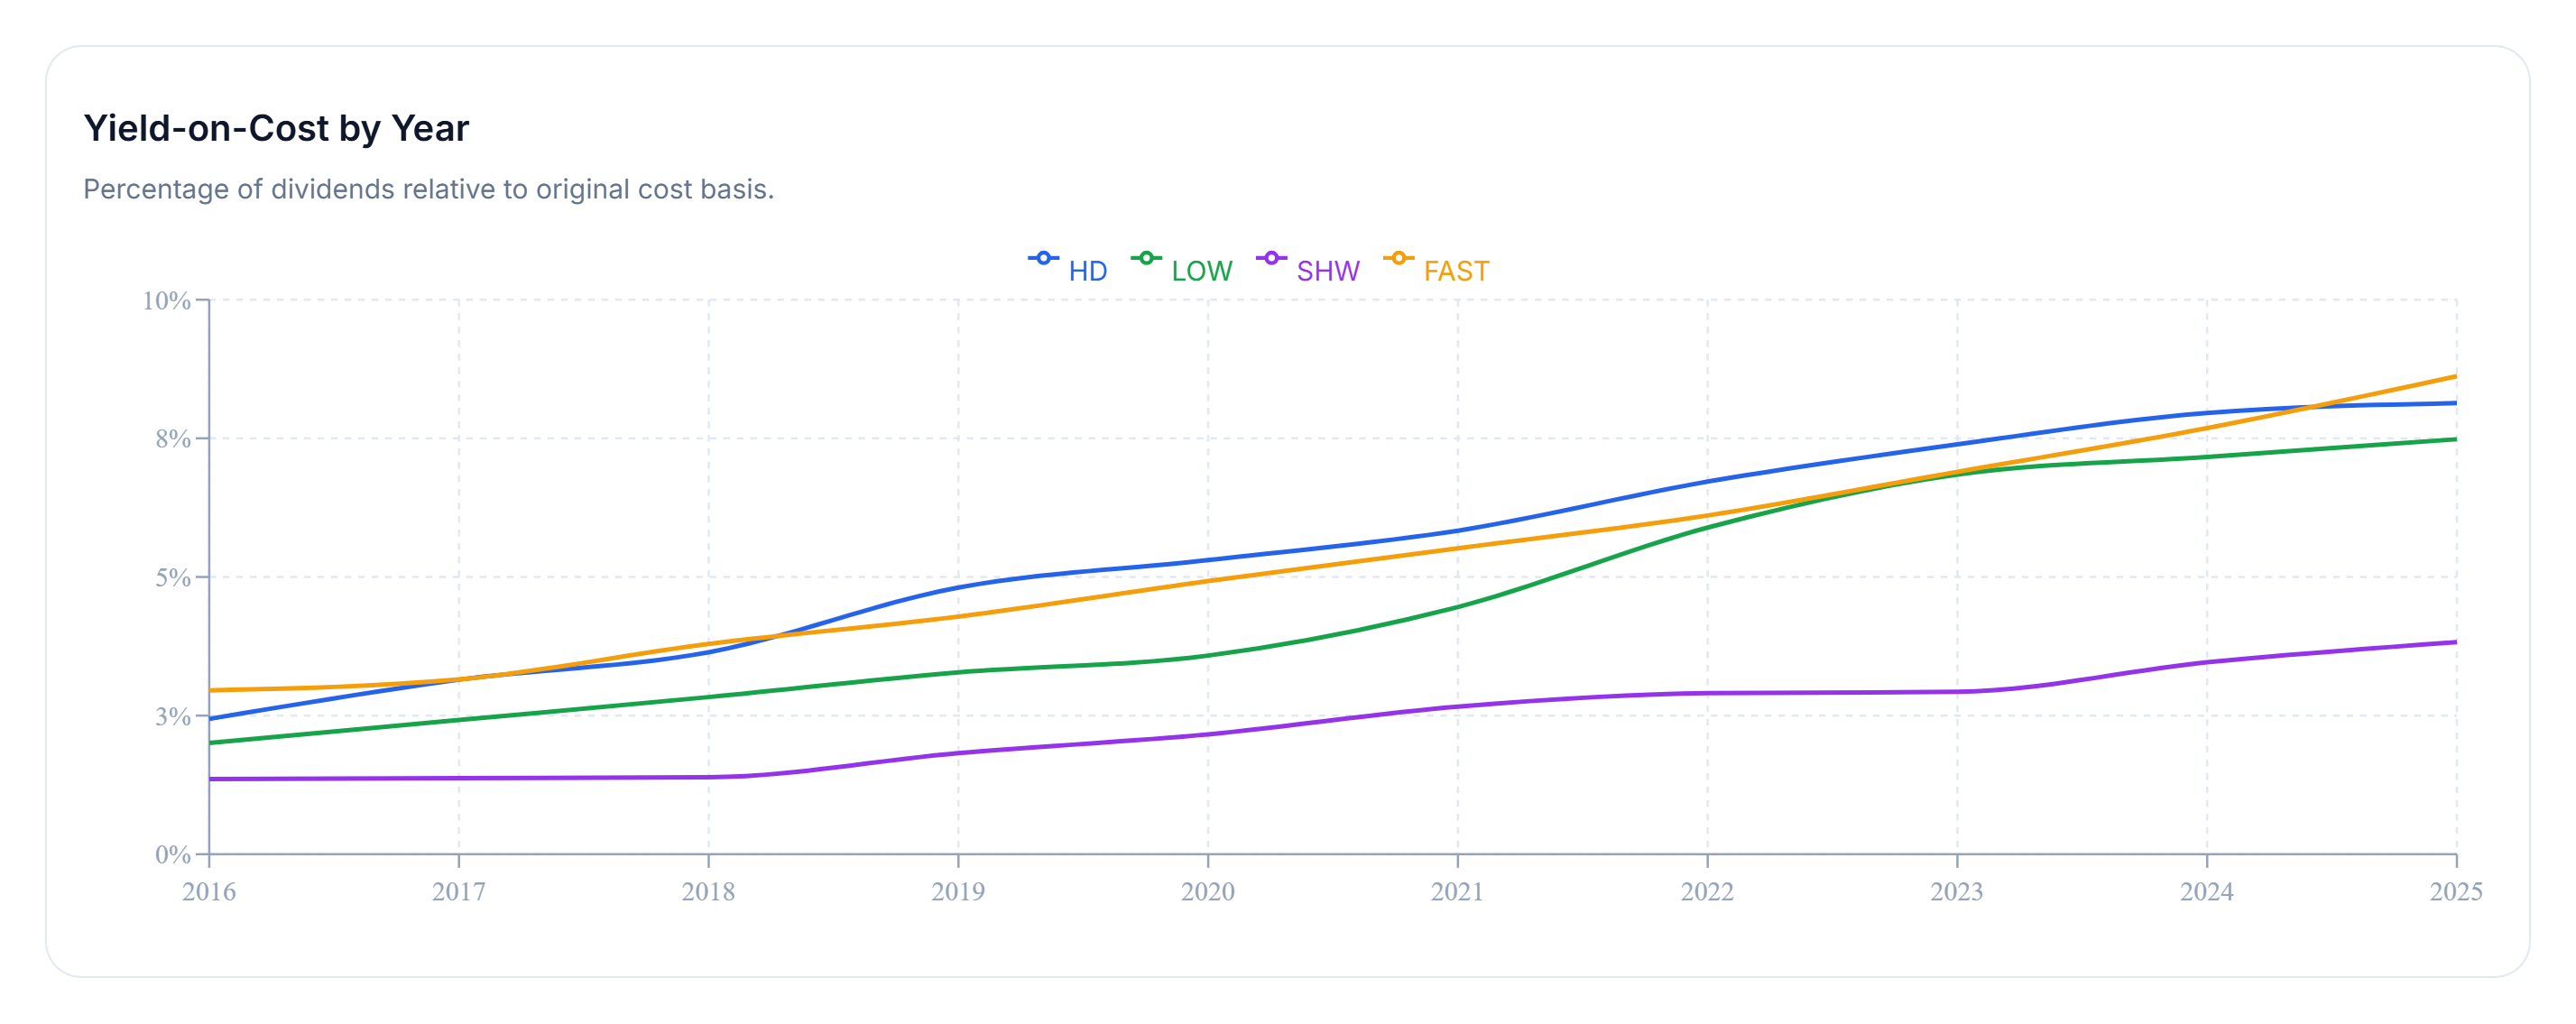
Yield on cost measures annual dividend income relative to the original investment amount. Unlike current dividend yield, which changes with the market price, yield on cost focuses on how much income an investment generates compared with its initial cost.
Over the ten-year comparison, FAST stands out with the highest ending yield on cost, reaching approximately 8.62% by the final year.
LOW, HD, and SHW also demonstrate rising dividend income relative to their original investment, although their trajectories are more gradual.
One interesting distinction is that HD wins the category for yield-on-cost growth, while FAST finishes with the highest absolute yield on cost. These results measure different aspects of income performance.
The first considers how much yield on cost improved between the beginning and end of the period. The second measures the income generated relative to the original investment at the end of the comparison.
For long-term dividend investors, this distinction matters. A stock can demonstrate substantial income growth without necessarily finishing with the highest income yield on its original cost.
The chart also illustrates why current dividend yield alone cannot describe a company's historical income development. Dividend increases can gradually change the income generated by an existing investment, even when no additional capital is contributed.
Historical yield-on-cost growth, however, does not guarantee that future dividends will increase at the same pace.
The historical comparison tells us how these four companies performed over the past decade. But for an investor building an income portfolio today, another question becomes important: how much capital would each stock require to produce the same monthly dividend income right now?
Income Goal Comparison
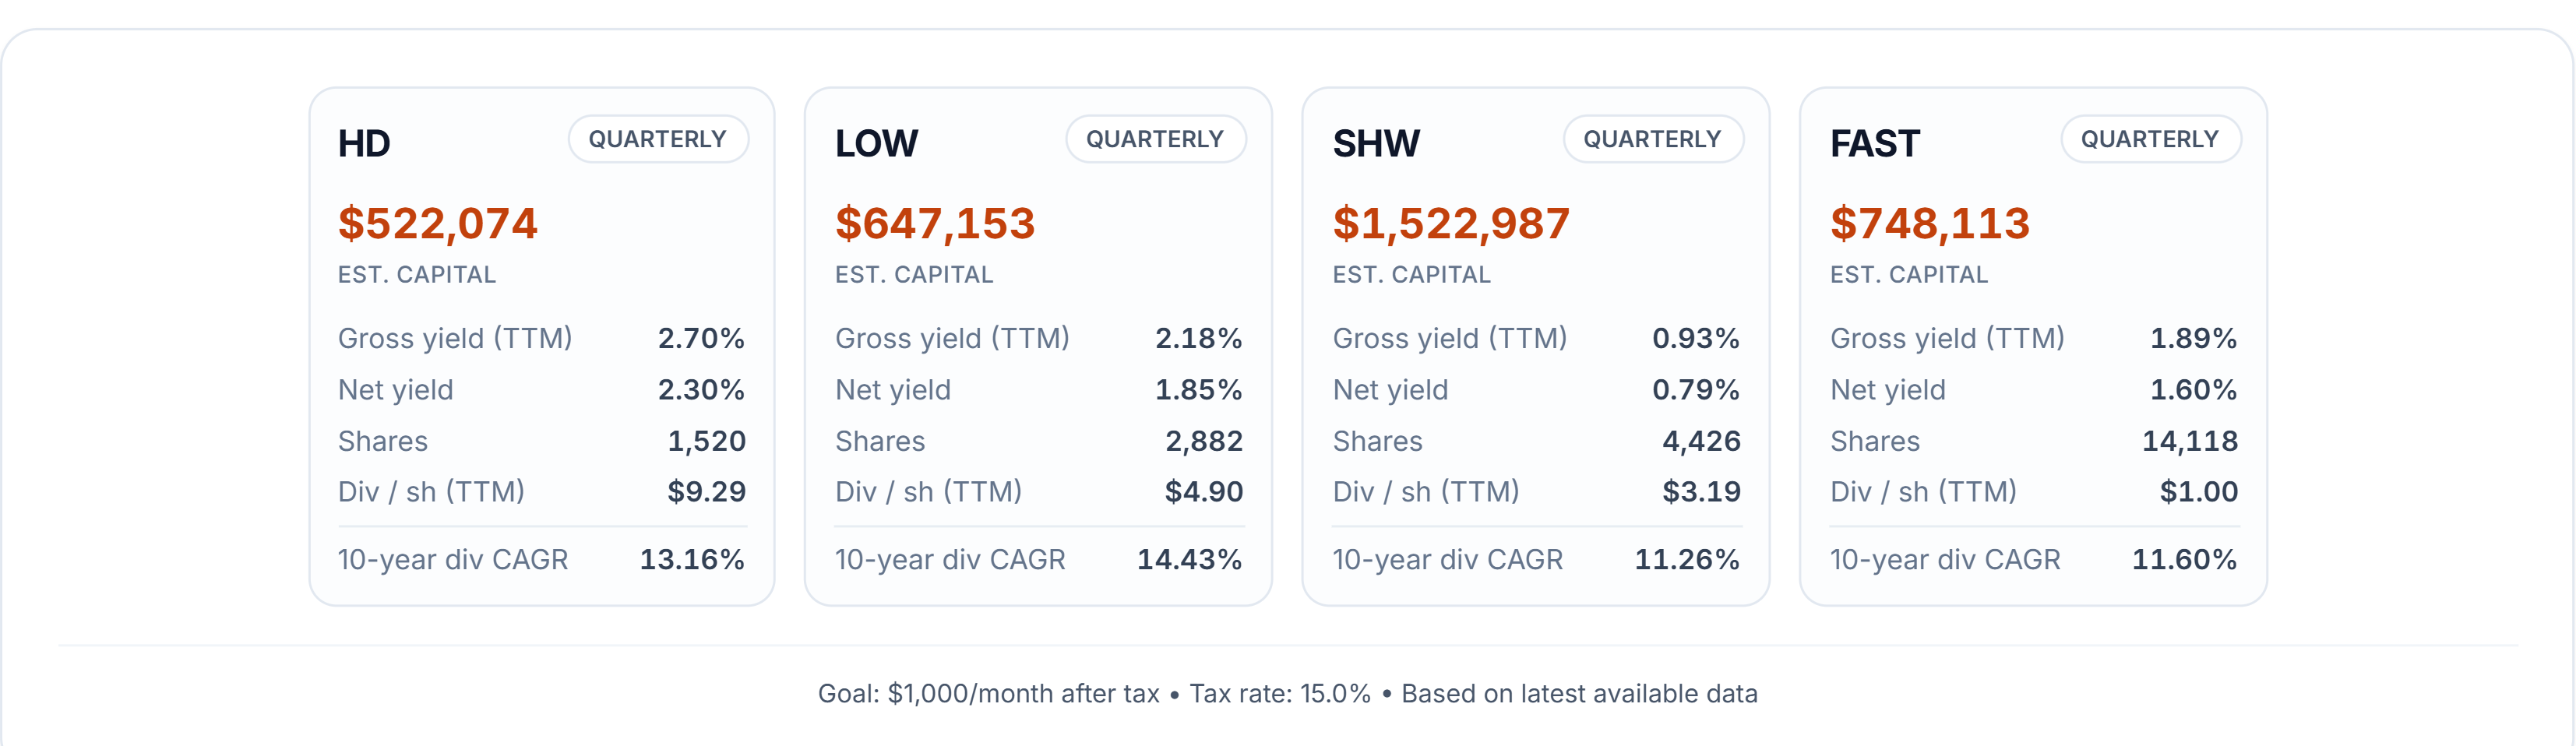
How much would you need to invest today to generate $1,000 per month in after-tax dividend income?
The answer depends heavily on each company's current dividend yield.
Using a 15% dividend tax assumption, the comparison reveals a substantial difference in required starting capital.
HD requires the least capital, approximately $522,074, supported by its current dividend yield of around 2.7%.
At the opposite end, SHW requires the most capital, approximately $1,522,987, with a current dividend yield near 0.9%.
LOW and FAST fall between these two extremes in required capital.
This comparison demonstrates the immediate advantage of a higher starting dividend yield when the objective is to generate a specific amount of income.
HD currently offers the highest starting yield among the four companies, making it the most capital-efficient choice for reaching the stated income target today.
SHW's lower starting yield means that substantially more capital is needed to generate the same initial dividend income.
However, starting income efficiency and long-term dividend growth are different considerations.
A company with a lower current yield may grow its dividend more quickly over time, potentially narrowing the income gap with a higher-yielding alternative.
Conversely, a higher-yielding stock can maintain an income advantage for many years if its starting yield is sufficiently large.
The income comparison cards illustrate this trade-off between less capital required today and potential future income growth.
These figures are based on current yield assumptions and do not account for future dividend changes, share price movements, or individual tax circumstances.
Yield Catch-Up Timeline
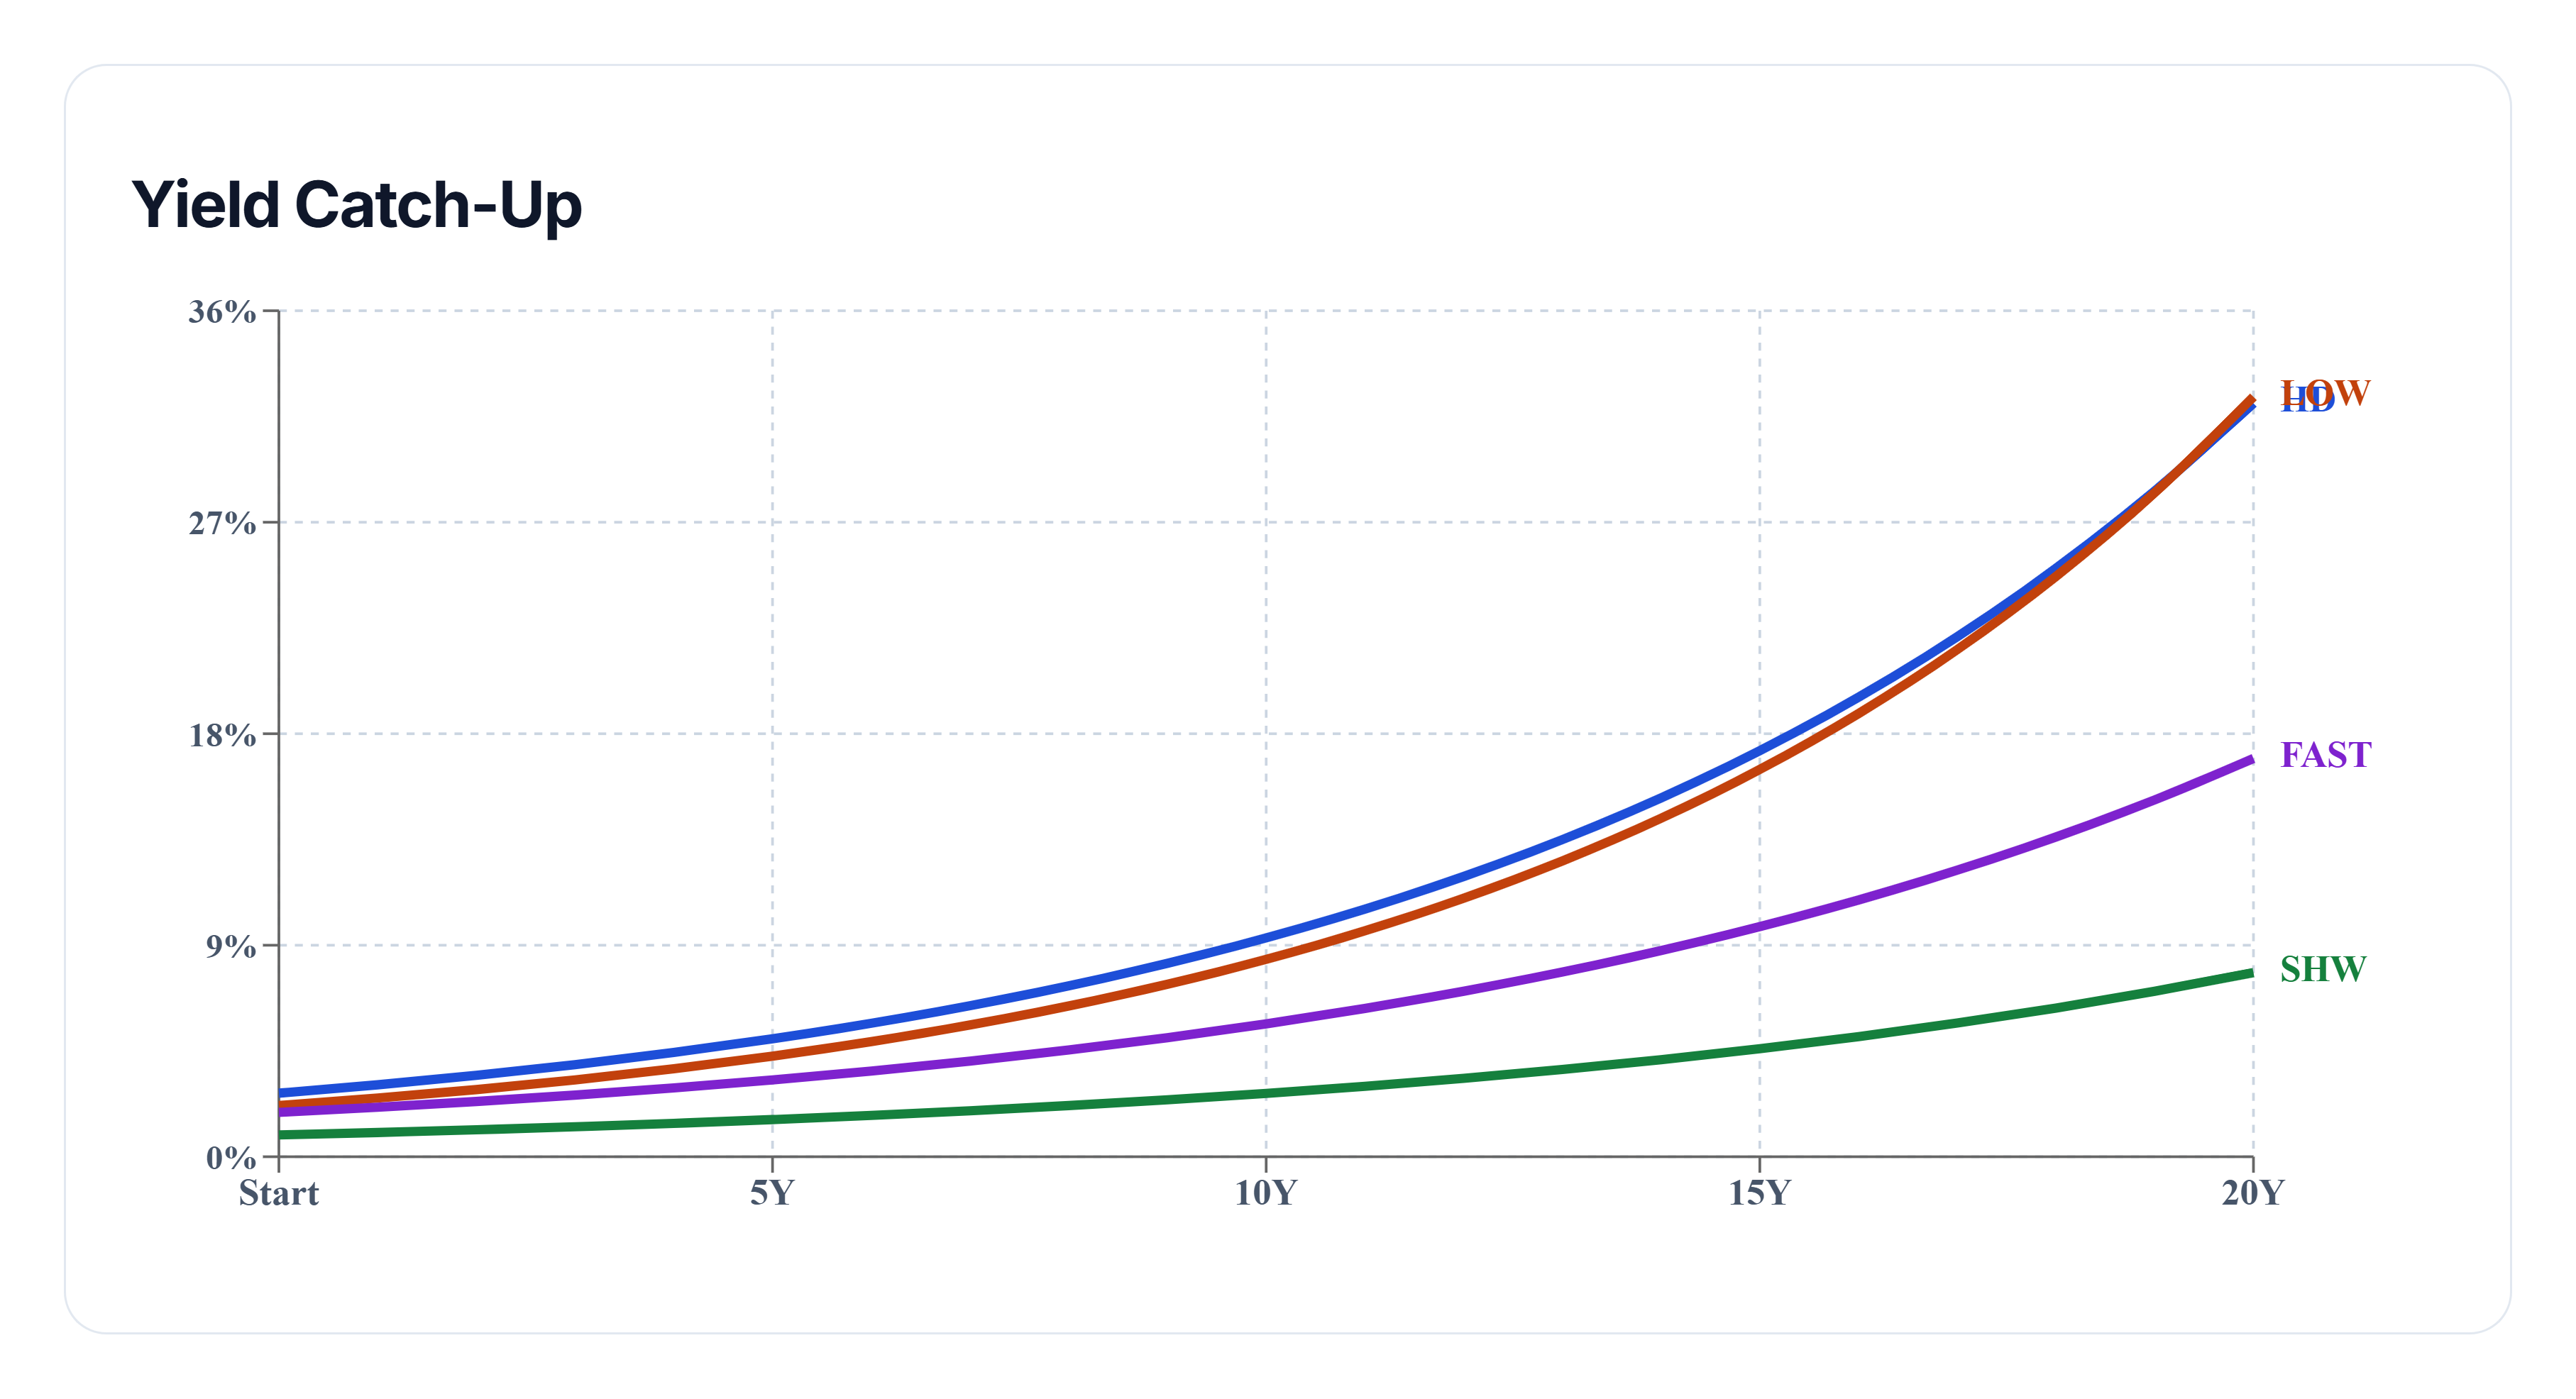
The yield catch-up timeline extends the comparison into the future, modeling how dividend income could develop if each company maintains a growth rate similar to its historical ten-year dividend CAGR.
Unlike the historical charts, this section is a hypothetical 20-year projection, not a record of actual future performance.
LOW leads the group in modeled dividend growth, with an assumed annual rate of approximately 14.4%.
HD begins with the highest current dividend yield, near 2.7%, giving it an immediate advantage in income generated per dollar invested.
SHW starts with a substantially lower yield, around 0.9%.
The projection explores whether dividend growth can eventually overcome these differences in starting yield.
One notable result is that SHW does not catch HD in projected yield on cost, even over the full 20-year period.
This illustrates how a significant starting yield advantage can persist for an extended period, even when companies continue increasing their dividends.
A lower-yielding investment needs sufficiently faster dividend growth to close the gap. The larger the initial yield difference, the greater the growth advantage required to catch up within a given time horizon.
The timeline helps investors visualize this relationship rather than evaluating dividend growth rates or starting yields independently.
However, the model assumes that historical dividend growth rates continue into the future. Actual dividend policies, business conditions, and growth rates can change substantially over time.
These projections should therefore be viewed as illustrations of potential income development rather than predictions of future dividends.
Final Takeaway
There is no single winner across every measurement in this dividend growth battle.
LOW leads historical dividend growth, with a ten-year dividend CAGR of 14.43%.
HD leads yield-on-cost improvement and currently requires the least capital to generate the $1,000 monthly after-tax income target.
FAST leads share price appreciation, delivering a ten-year price return of 422.07%, and finishes the historical comparison with the highest yield on cost at approximately 8.62%.
SHW remains a long-established dividend grower, although it does not claim a historical category win and currently requires the most capital to reach the same income goal.
When the 20-year projection is added, the distinction between starting yield and future dividend growth becomes even clearer.
A higher starting yield can provide an immediate income advantage, while stronger dividend growth may improve income efficiency over longer periods. Neither characteristic alone determines the best overall investment outcome.
Ultimately, the most relevant measurement depends on the investor's objective: generating more income today, growing dividend payments over time, or pursuing a balance between income growth and share price appreciation.
Historical performance, present income requirements, and future projections each tell a different part of the dividend investing story.