MO vs KHC vs GIS vs KMB: 10-Year Dividend Growth, Yield & Income Battle
Portfolio Overview
In this DividendXray battle, we compare four established dividend stocks across dividend growth, yield-on-cost expansion, and price return performance over a ten-year period. We then examine how their current dividend yields affect income planning and how historical dividend growth could shape future income.
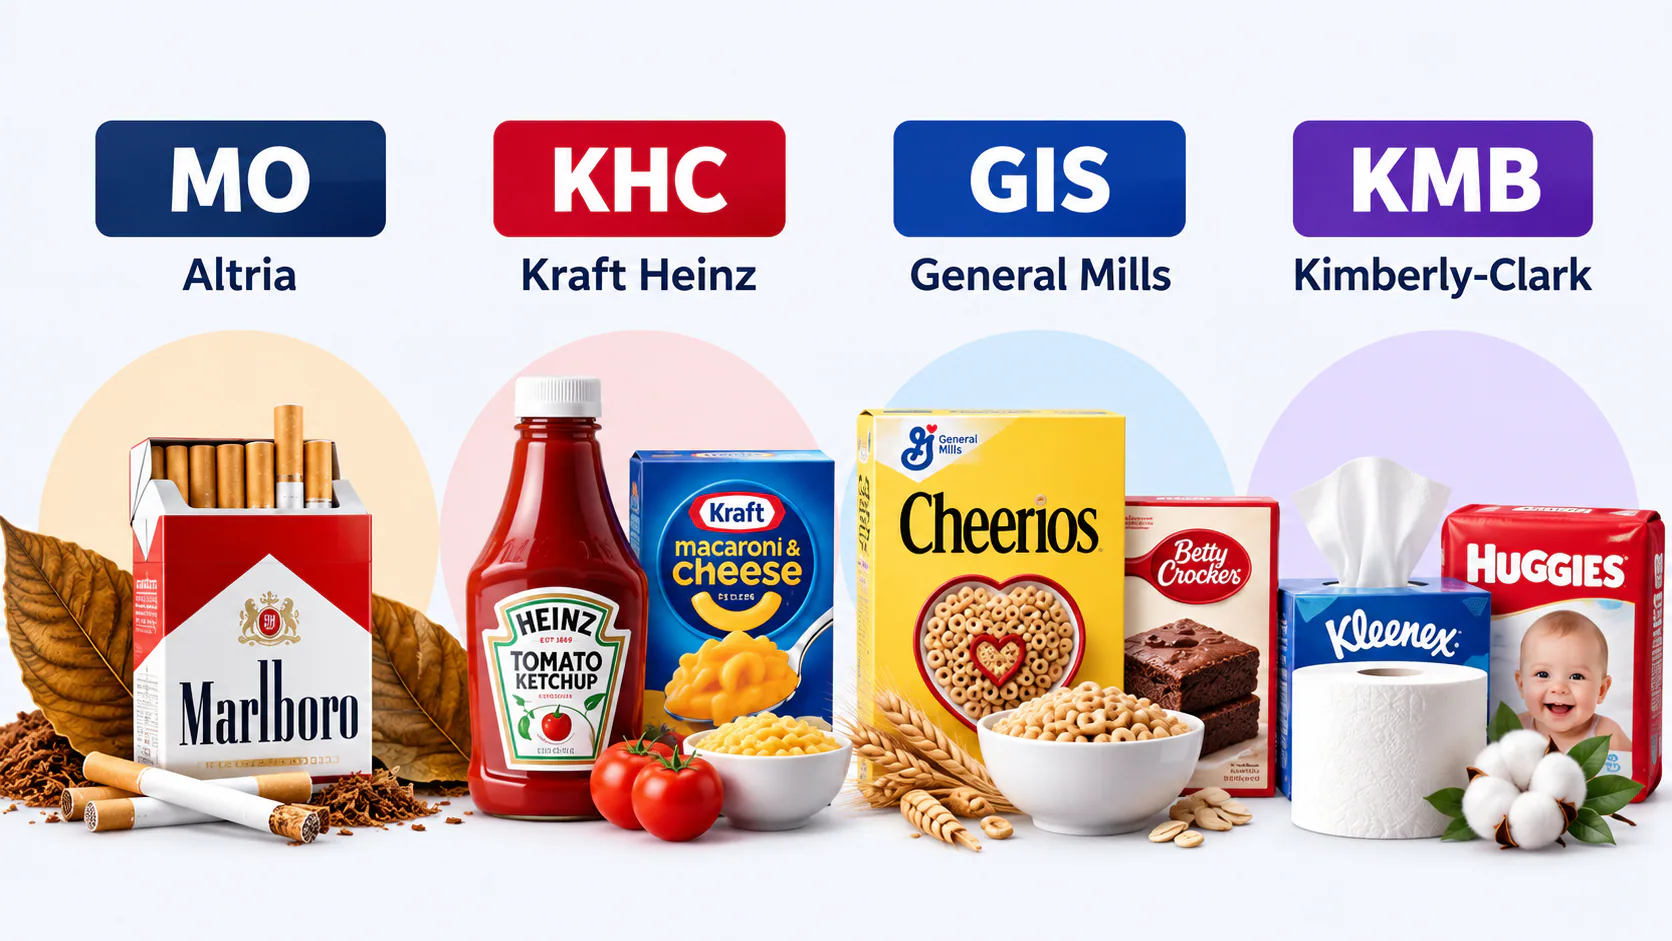
The four companies represent different areas of the consumer economy:
- Altria (MO) is a tobacco company known for its high dividend yield and established income-focused shareholder policy.
- Kraft Heinz (KHC) is a major packaged food company with a portfolio of familiar consumer brands.
- General Mills (GIS) owns a wide range of established food brands and has a long history of paying dividends.
- Kimberly-Clark (KMB) focuses on everyday household and personal care products, with a long record of dividend increases.
Although these companies operate in different consumer product categories, they share an appeal to income-oriented investors.
But current dividend yield tells only part of the story. Historical dividend growth, income consistency, and price performance can produce very different results over time.
Category Winners
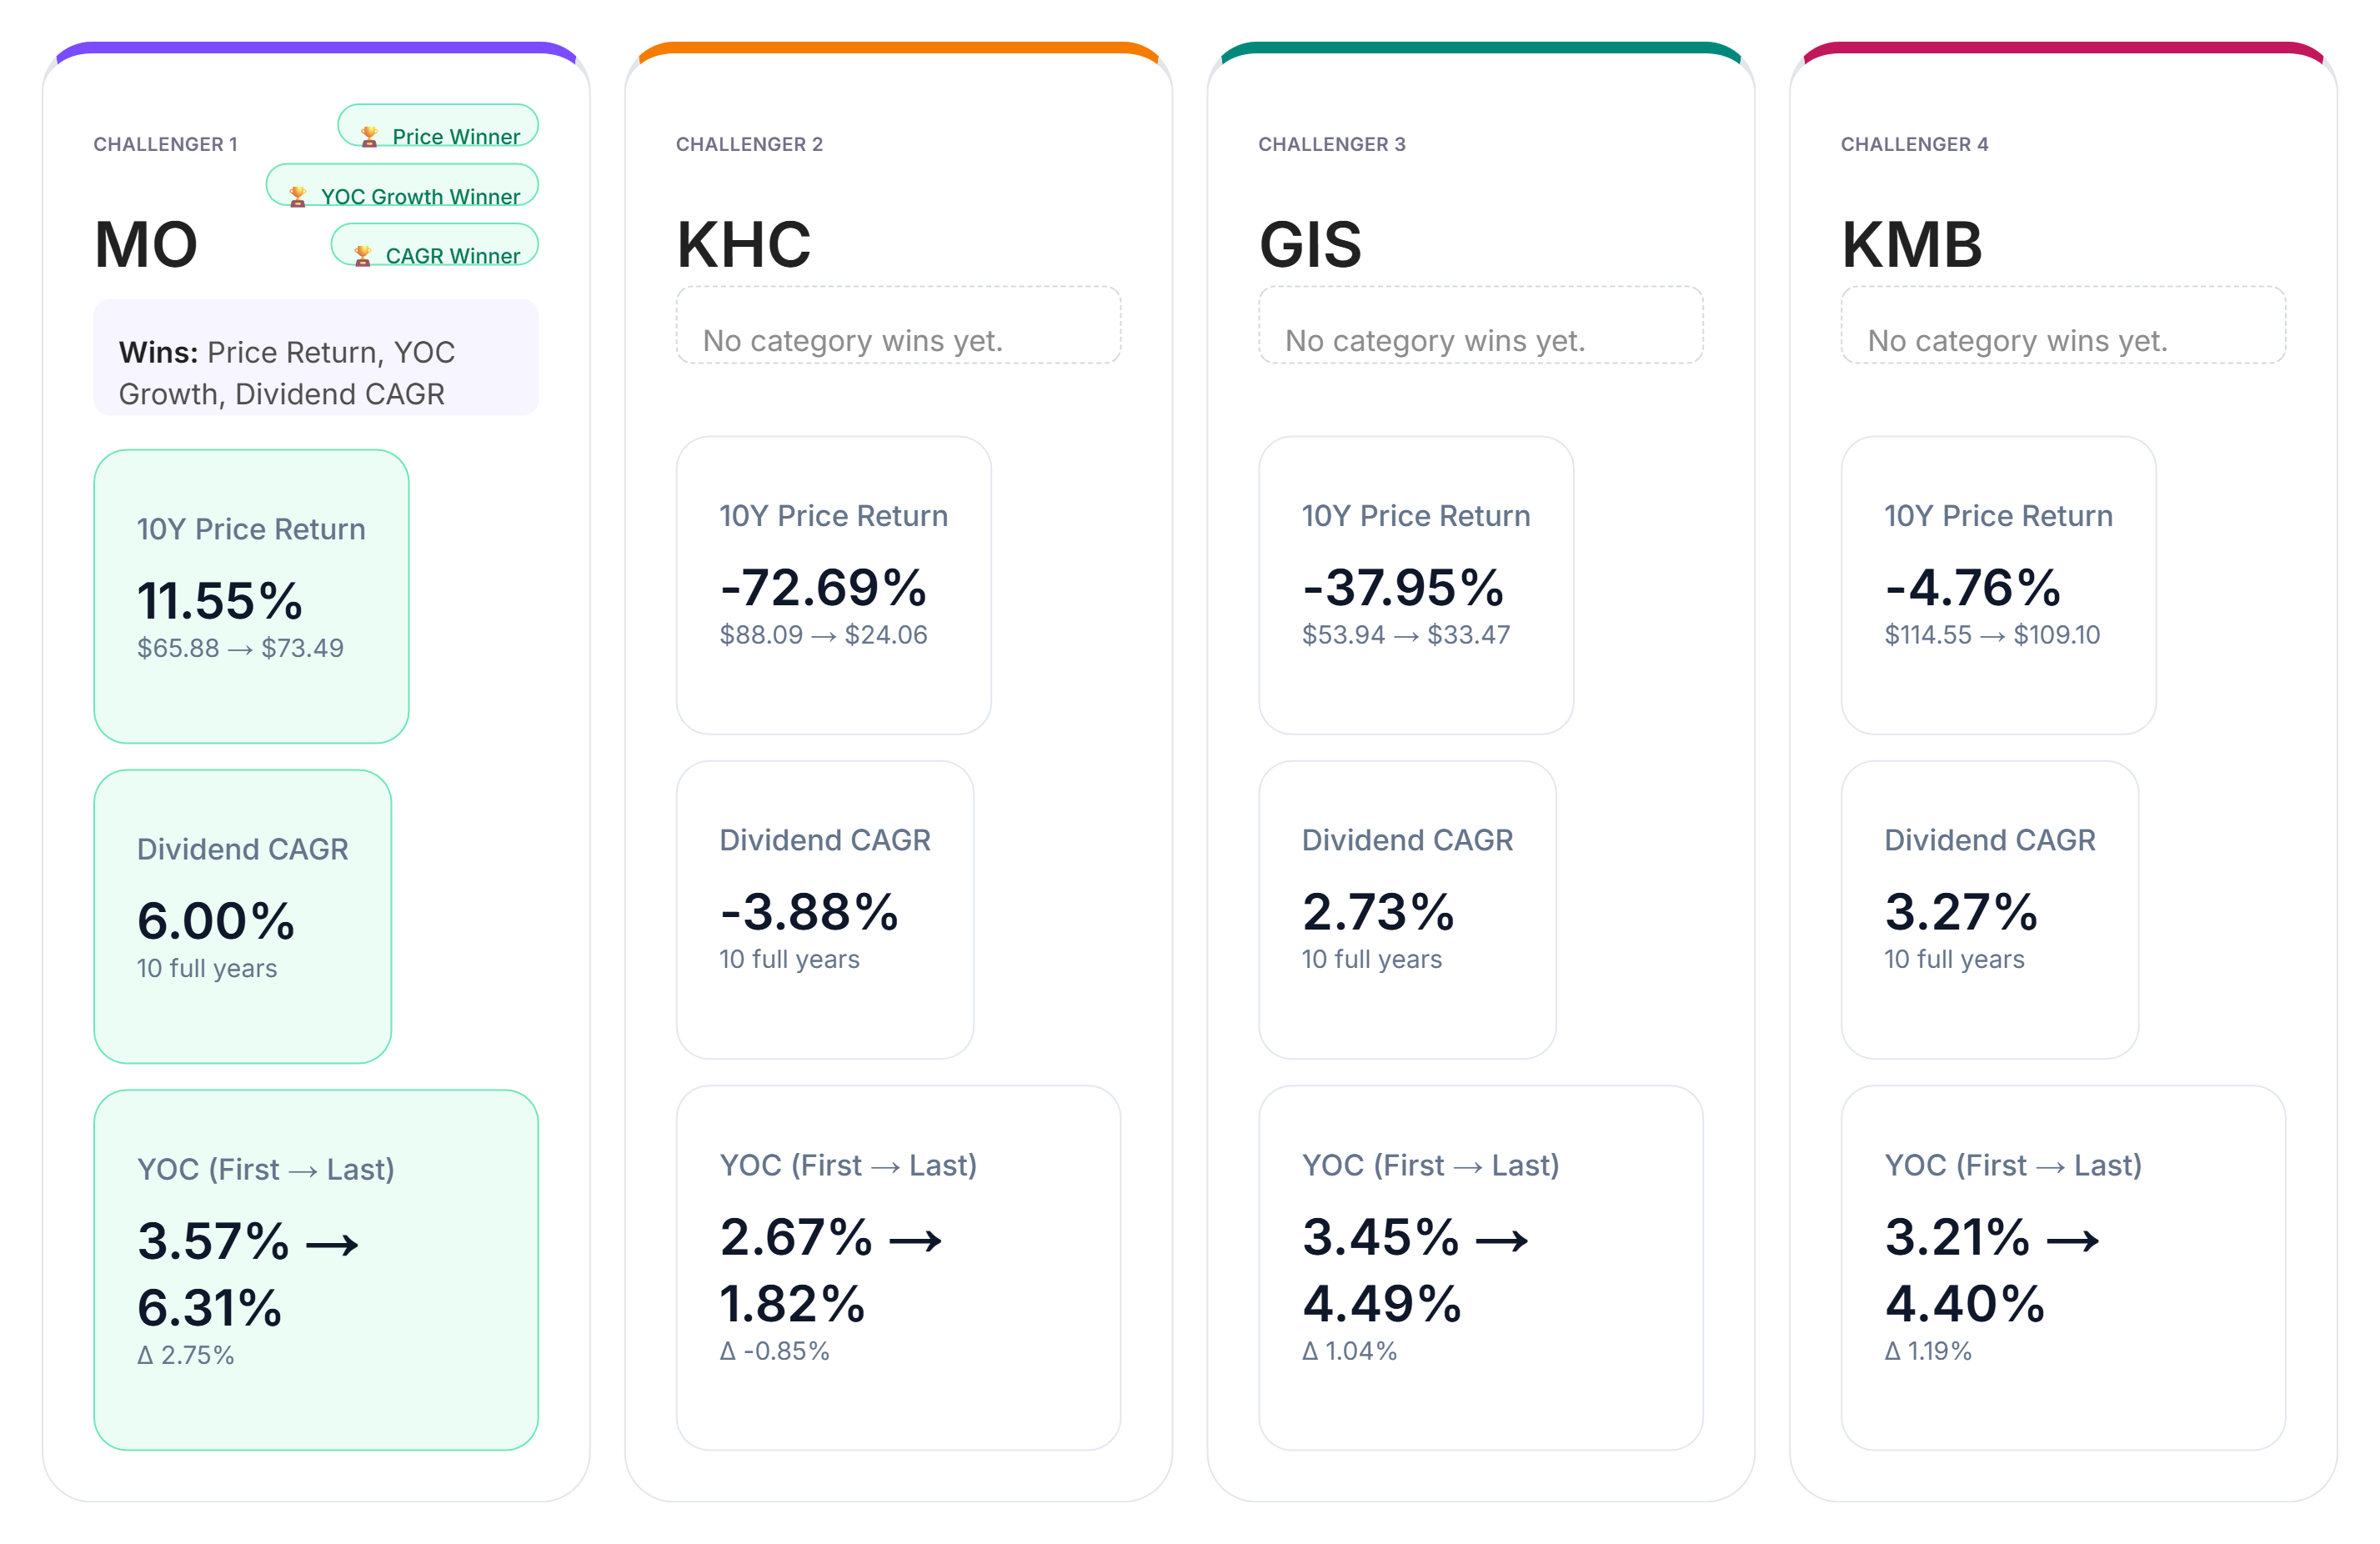
The ten-year comparison reveals a clear leader across all three historical performance categories.
In dividend growth, Altria (MO) takes first place with a ten-year dividend CAGR of 6.00%, outperforming the other three holdings.
For yield-on-cost growth, MO again leads the group, showing the strongest improvement between the beginning and end of the comparison period.
In price return, MO completes the sweep with a ten-year return of 11.55%, the highest among the four stocks.
Kraft Heinz, General Mills, and Kimberly-Clark do not secure a category win in this comparison, although their individual dividend histories tell different stories.
The results highlight an important distinction: companies operating in traditionally defensive consumer industries do not necessarily deliver similar dividend growth or price performance.
For dividend investors, a company's business stability and its ability to grow shareholder income are related, but separate considerations.
Yield-on-Cost by Year
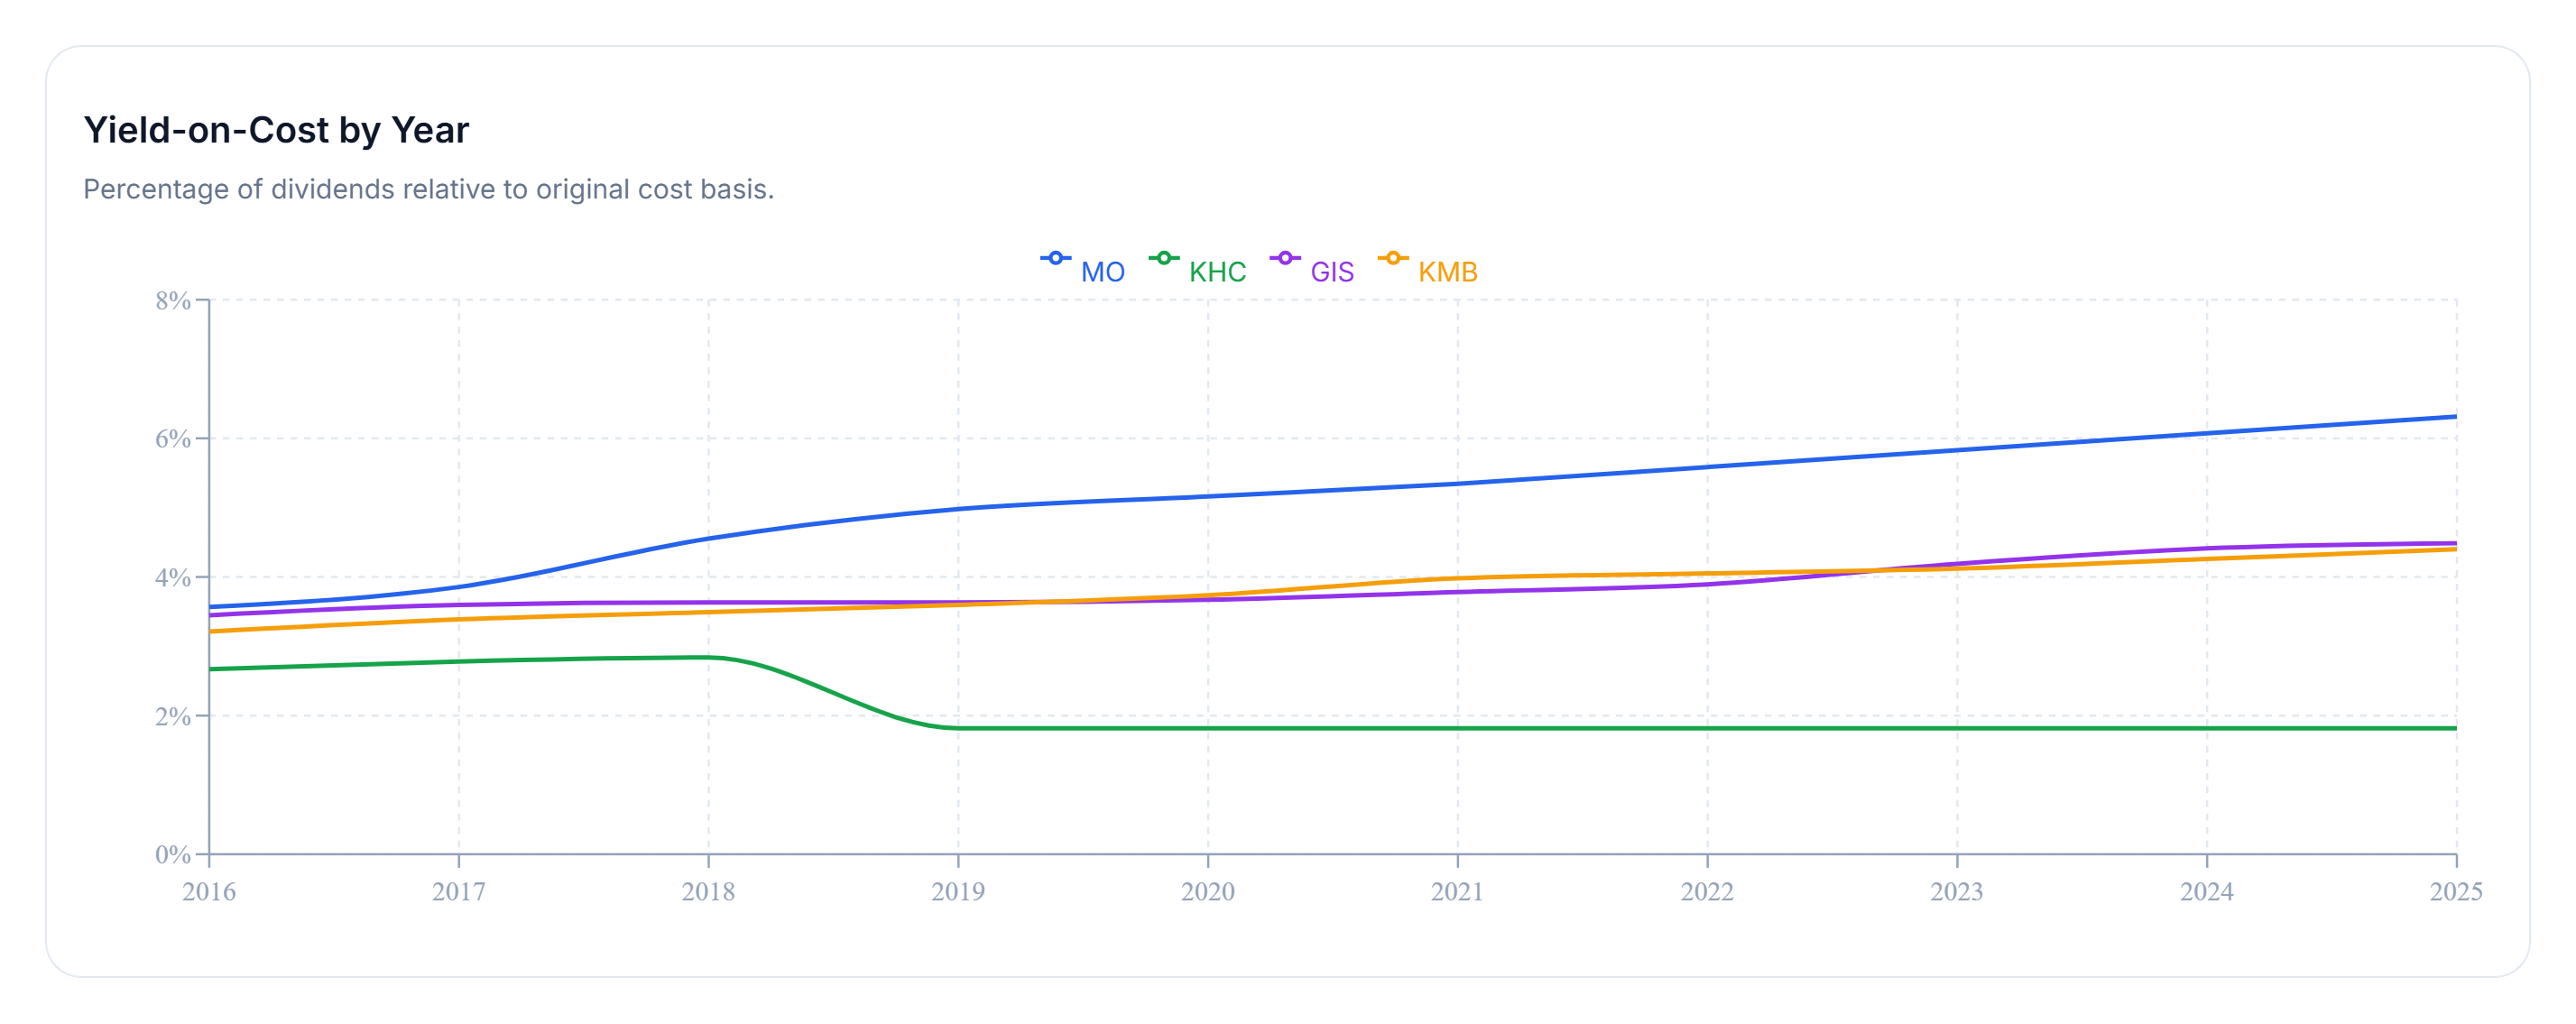
Yield on cost measures annual dividend income relative to the original investment amount, rather than the stock's current market price.
This makes it useful for understanding how dividend income changes over time without assuming additional capital contributions.
Across the ten-year comparison, Altria (MO) demonstrates the strongest income growth relative to the initial investment, reaching approximately 6.31% yield on cost by the end of the period.
General Mills (GIS) and Kimberly-Clark (KMB) show more gradual improvements in income efficiency. Their dividend growth is less pronounced than MO's, but both demonstrate upward yield-on-cost trends.
Kraft Heinz (KHC) follows a different path. Its declining dividends weigh on its yield-on-cost performance, illustrating how dividend reductions can reverse income growth.
This distinction matters for investors who intend to rely on dividend payments over long periods.
A high starting yield can provide meaningful income immediately, but sustained dividend growth determines whether that income increases relative to the original investment.
Conversely, dividend reductions can weaken the income generated by an existing position, even when no shares are sold.
The historical comparison establishes how these four companies performed over the past decade. But historical income growth is only one part of the decision.
Now let's shift from past performance to today's income picture and examine how much capital each stock requires to reach the same monthly dividend income goal.
Income Goal Comparison
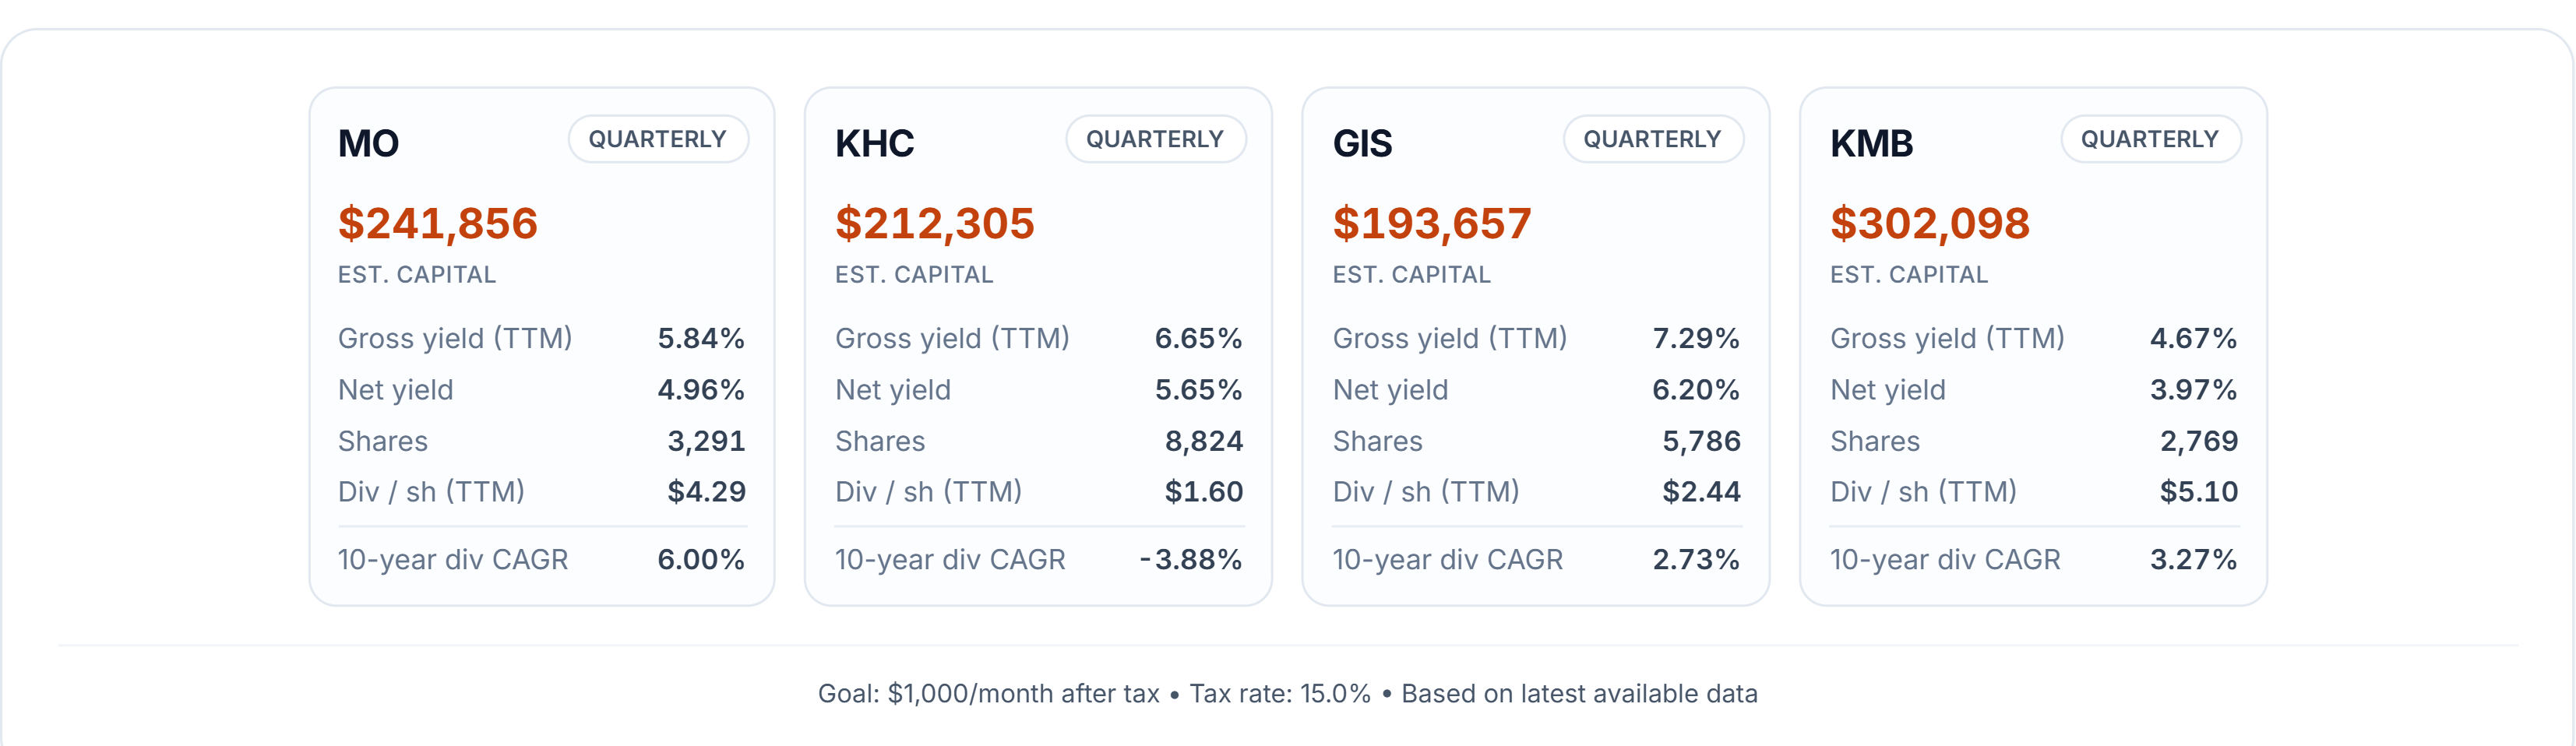
How much capital would an investor need to generate $1,000 per month in after-tax dividend income from each of these stocks?
Using the comparison's current dividend yields and an assumed 15% dividend tax rate, the required investment varies significantly.
General Mills (GIS) requires the least capital, at approximately $193,657, supported by a current dividend yield near 7.3%.
At the other end of the comparison, Kimberly-Clark (KMB) requires approximately $302,098, reflecting its lower current yield of around 4.7%.
Altria (MO) and Kraft Heinz (KHC) fall between these two companies in required capital, reflecting their different current dividend yields.
The comparison reveals an interesting contrast with the historical results.
Although MO leads all three historical performance categories, GIS currently offers the highest starting yield and requires the least capital to reach the selected monthly income target.
This illustrates why historical dividend growth and current income efficiency should be evaluated separately.
A higher starting yield allows investors to generate more immediate income per dollar invested. A lower-yielding stock may require more upfront capital but could improve its income efficiency over time if dividend growth is sufficiently strong.
However, higher yield does not automatically mean a better investment. Dividend sustainability, future payout changes, and the underlying business remain important considerations.
The income goal comparison provides a snapshot based on current yields, not a guarantee of future distributions.
Yield Catch-Up Timeline
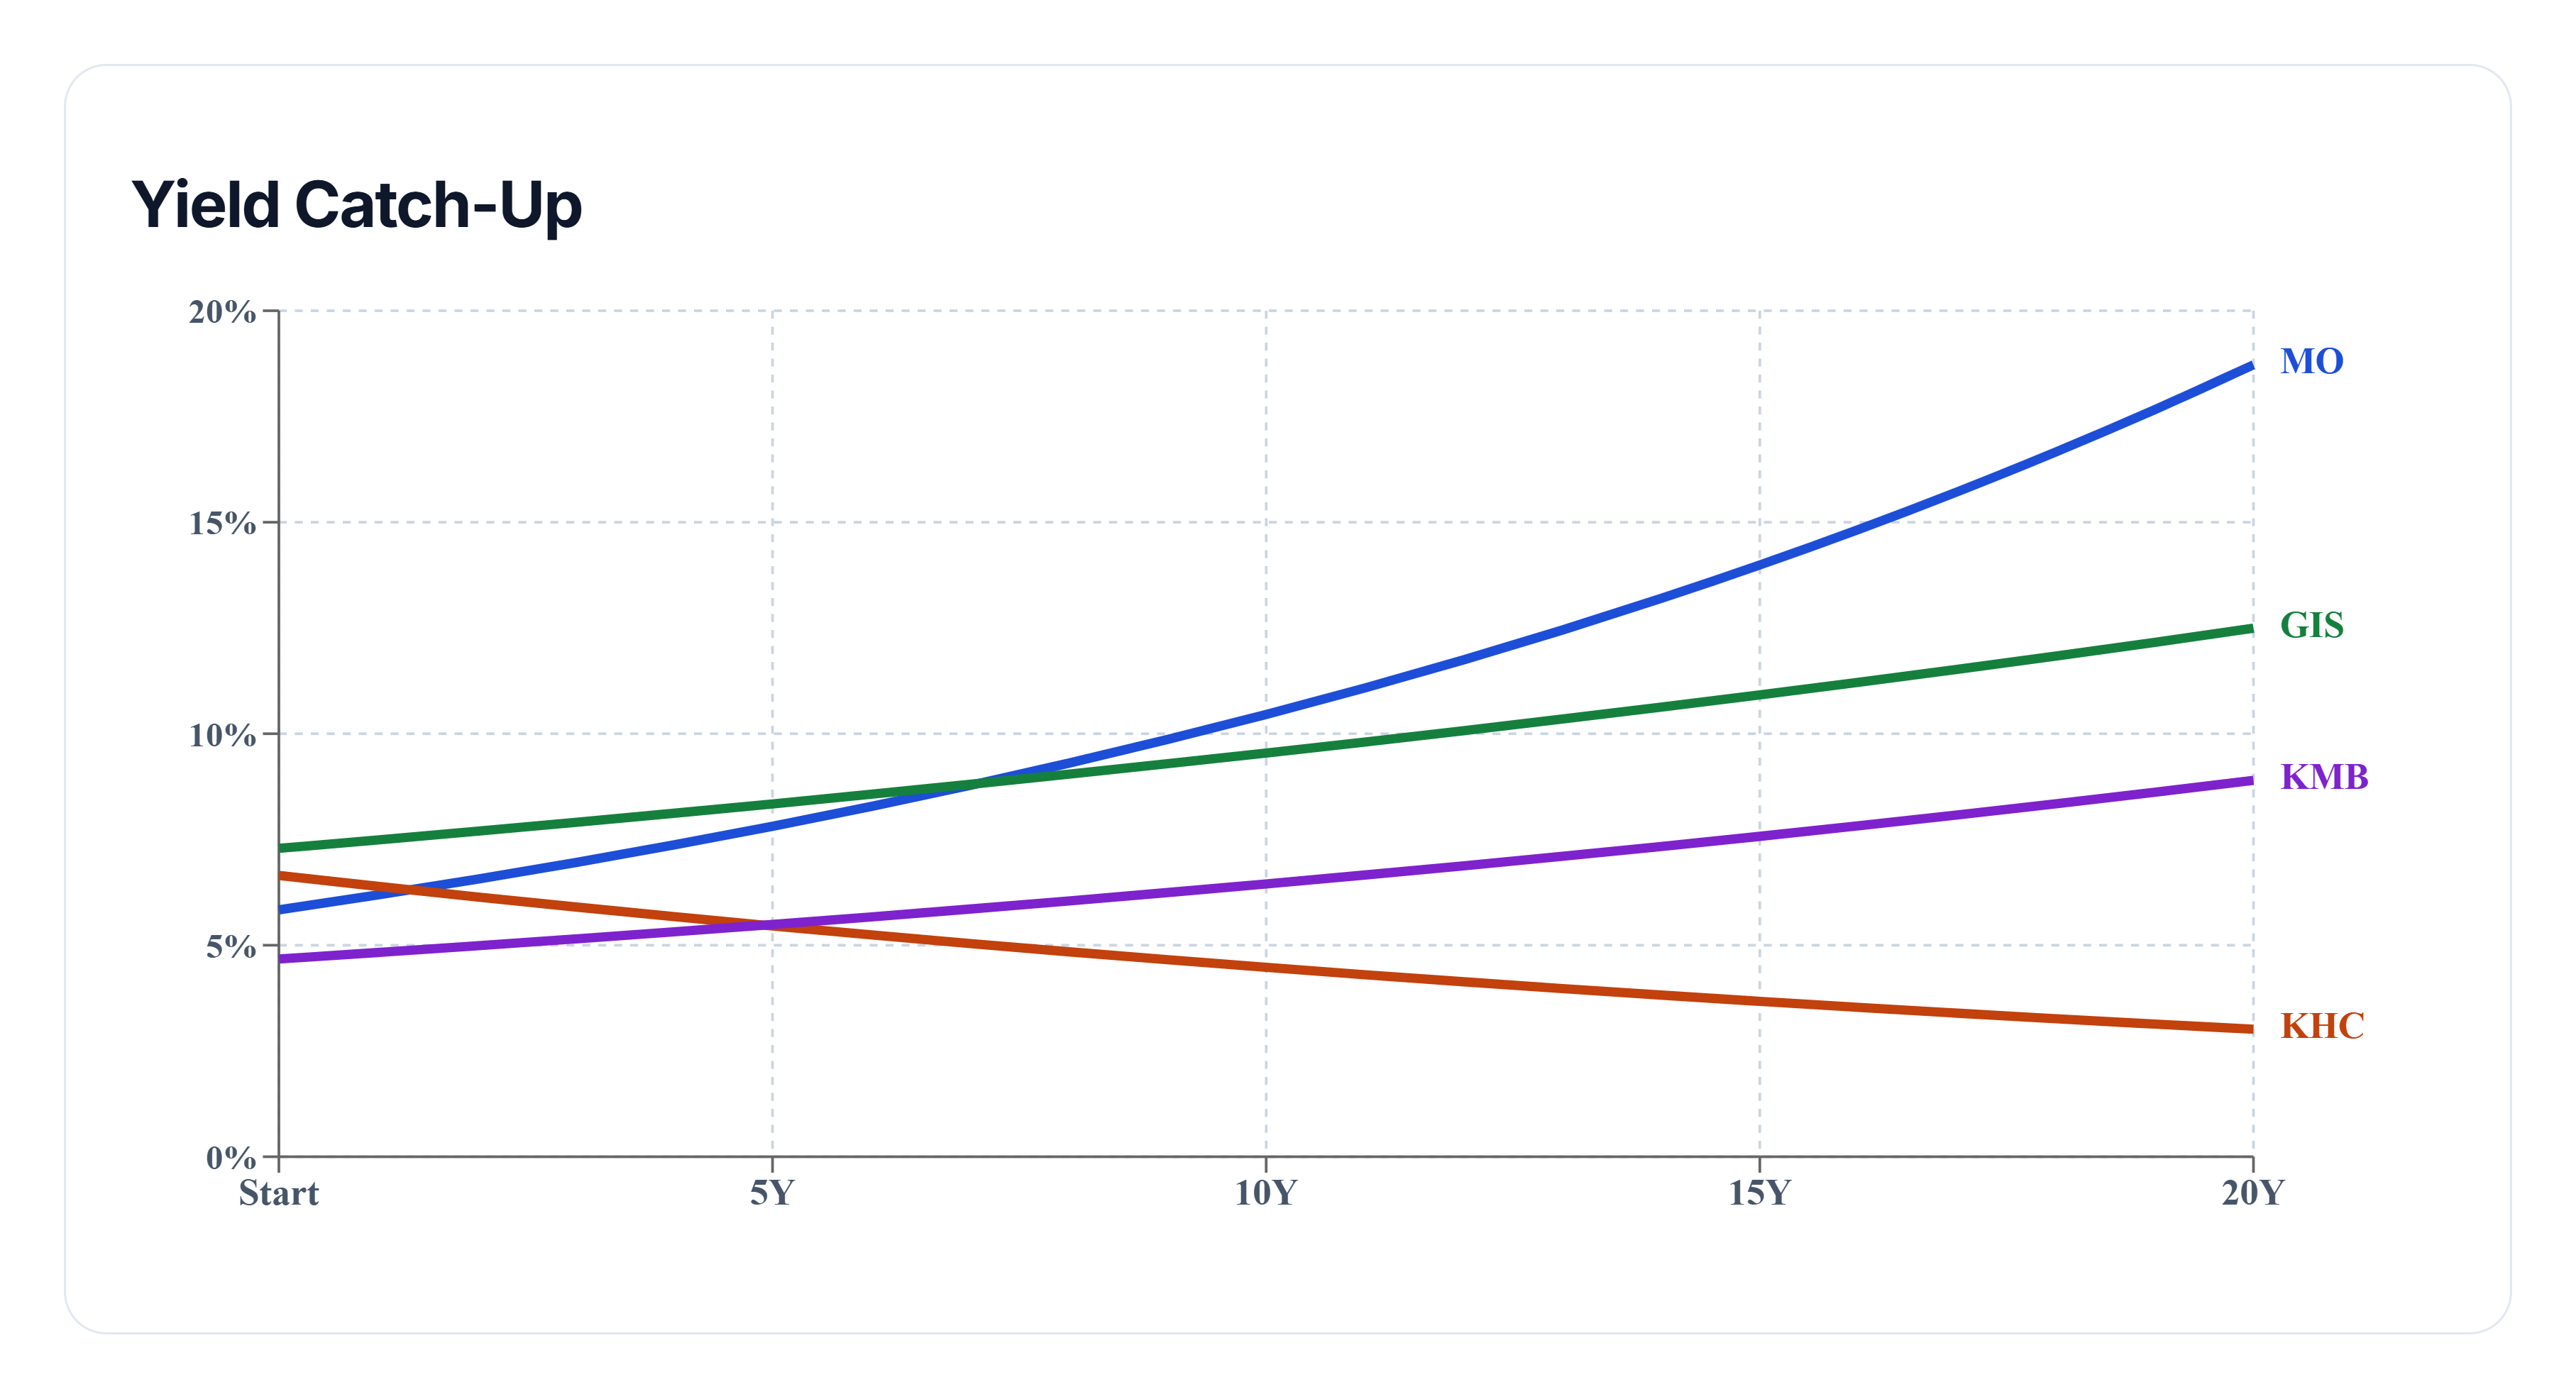
The final comparison moves from current income requirements to projected long-term dividend growth.
This model estimates how yield on cost could evolve over 20 years, assuming each stock continues growing its dividend at a rate similar to its historical ten-year dividend CAGR.
These are hypothetical projections, not forecasts of actual future dividend payments.
Altria (MO) has the strongest modeled dividend growth rate, at approximately 6.0% annually, reflecting its historical performance.
General Mills (GIS) begins with the highest current dividend yield, near 7.3%, giving it an advantage in starting income efficiency.
Kimberly-Clark (KMB) starts with a lower yield of approximately 4.7%.
Despite the potential benefit of compounding dividend growth, KMB's projected yield on cost does not catch up with GIS within the 20-year modeling period.
This demonstrates an important principle of dividend income planning: a higher dividend growth rate does not necessarily overcome a lower starting yield within an investor's chosen time horizon.
The relationship between starting yield and dividend growth determines how income efficiency develops over time.
A company offering more income today can maintain that advantage for many years, while another company with faster dividend growth may require a much longer period to close the gap.
The projection also depends heavily on its assumptions. Actual dividend growth can accelerate, slow, stop, or turn negative, making long-term outcomes substantially different from the modeled paths.
Final Takeaway
This DividendXray battle highlights how four established dividend stocks can produce very different results across historical performance, current income, and long-term projections.
Altria (MO) leads the ten-year historical comparison, winning all three categories: dividend growth, yield-on-cost growth, and price return.
General Mills (GIS) offers the highest current dividend yield in this comparison and requires the least capital to generate $1,000 per month after taxes.
Kimberly-Clark (KMB) requires the most capital for that same income target, and its modeled yield on cost remains below GIS over the 20-year projection.
Kraft Heinz (KHC) illustrates the impact dividend reductions can have on long-term income growth.
Together, these results reinforce a central consideration for dividend investors: starting yield determines how much income an investment generates today, while dividend growth influences how that income may evolve over time.
Neither metric tells the complete story on its own.
For investors building a long-term income portfolio, comparing historical dividend performance, current capital requirements, and potential future income growth provides a more complete picture than focusing on dividend yield alone.