LMT vs RTX vs NOC vs GD: Defense Stock Dividend Battle

Portfolio Overview
In this DividendXray battle, we compare four major U.S. defense contractors across dividend growth, yield-on-cost expansion, and price return performance over a ten-year period.
- Lockheed Martin (LMT) is best known for advanced fighter jets, missile systems, and military technology.
- RTX (RTX) combines aerospace systems, missile defense, and commercial aviation technologies.
- Northrop Grumman (NOC) specializes in stealth aircraft, space systems, and advanced defense technology.
- General Dynamics (GD) focuses on submarines, armored vehicles, business jets, and defense systems.
Although all four companies operate in the defense and aerospace industries, their businesses differ in meaningful ways. Each also presents a different combination of starting dividend yield, historical dividend growth, and share-price appreciation.
The comparison explores three perspectives: how these stocks performed historically, how much capital they require to generate dividend income today, and how their income potential could evolve under long-term dividend growth assumptions.
Category Winners
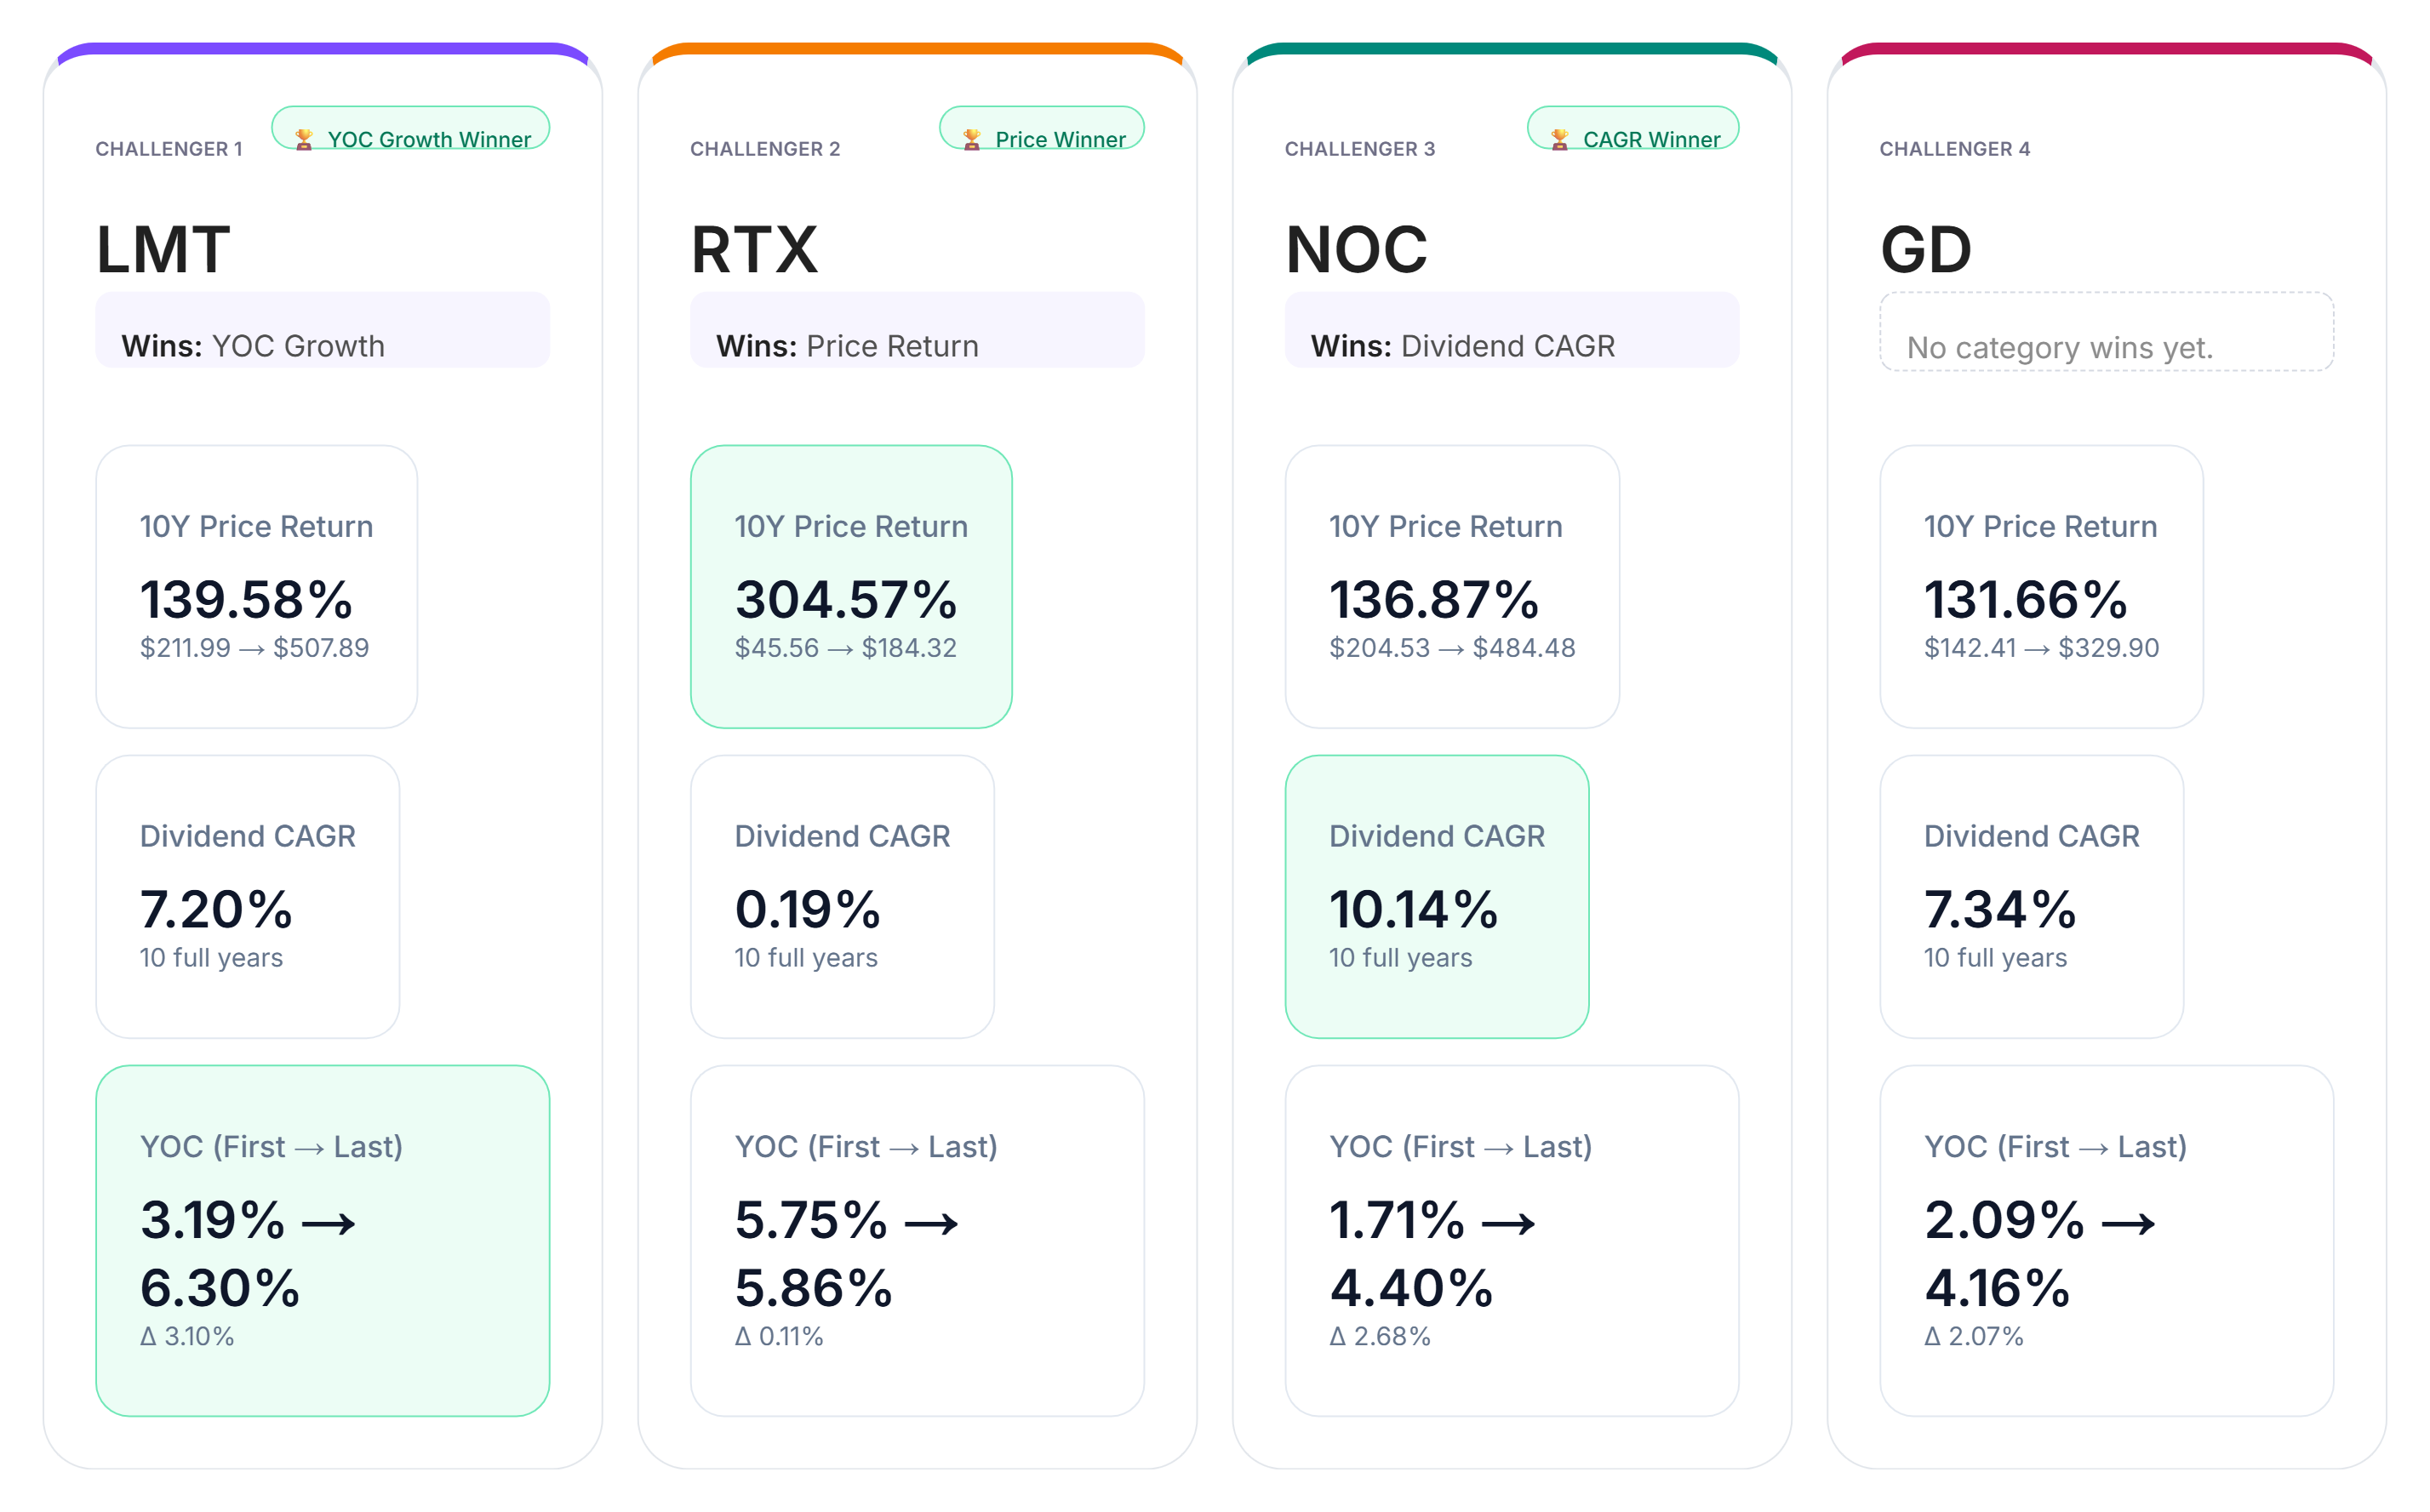
Looking at the ten-year data across dividend CAGR, yield-on-cost growth, and price return, three different category leaders emerge.
In dividend growth, Northrop Grumman (NOC) leads the group with a ten-year compound annual dividend growth rate of 10.14%.
For yield-on-cost growth, Lockheed Martin (LMT) shows the strongest improvement from the first year to the last, reflecting an increase in annual dividend income relative to the original investment.
In price return, RTX takes the lead with a ten-year gain of 304.57%, outperforming the other holdings in share-price appreciation over the comparison period.
General Dynamics (GD) delivers solid results but does not secure a category win in this battle.
An important distinction emerges: the company with the strongest historical dividend growth is not necessarily the one with the highest price return or the greatest improvement in yield on cost.
An important note about RTX's dividend history
RTX's historical dividend growth requires additional context. In 2020, United Technologies merged with Raytheon following the separation of Carrier and Otis.
This restructuring involved a dividend reset that affects the historical growth figures used in the comparison. As a result, RTX's ten-year dividend CAGR should not be interpreted in the same way as an uninterrupted dividend growth record.
This distinction matters when comparing long-term dividend performance and becomes particularly relevant when using historical growth rates to model future income.
Yield-on-Cost by Year
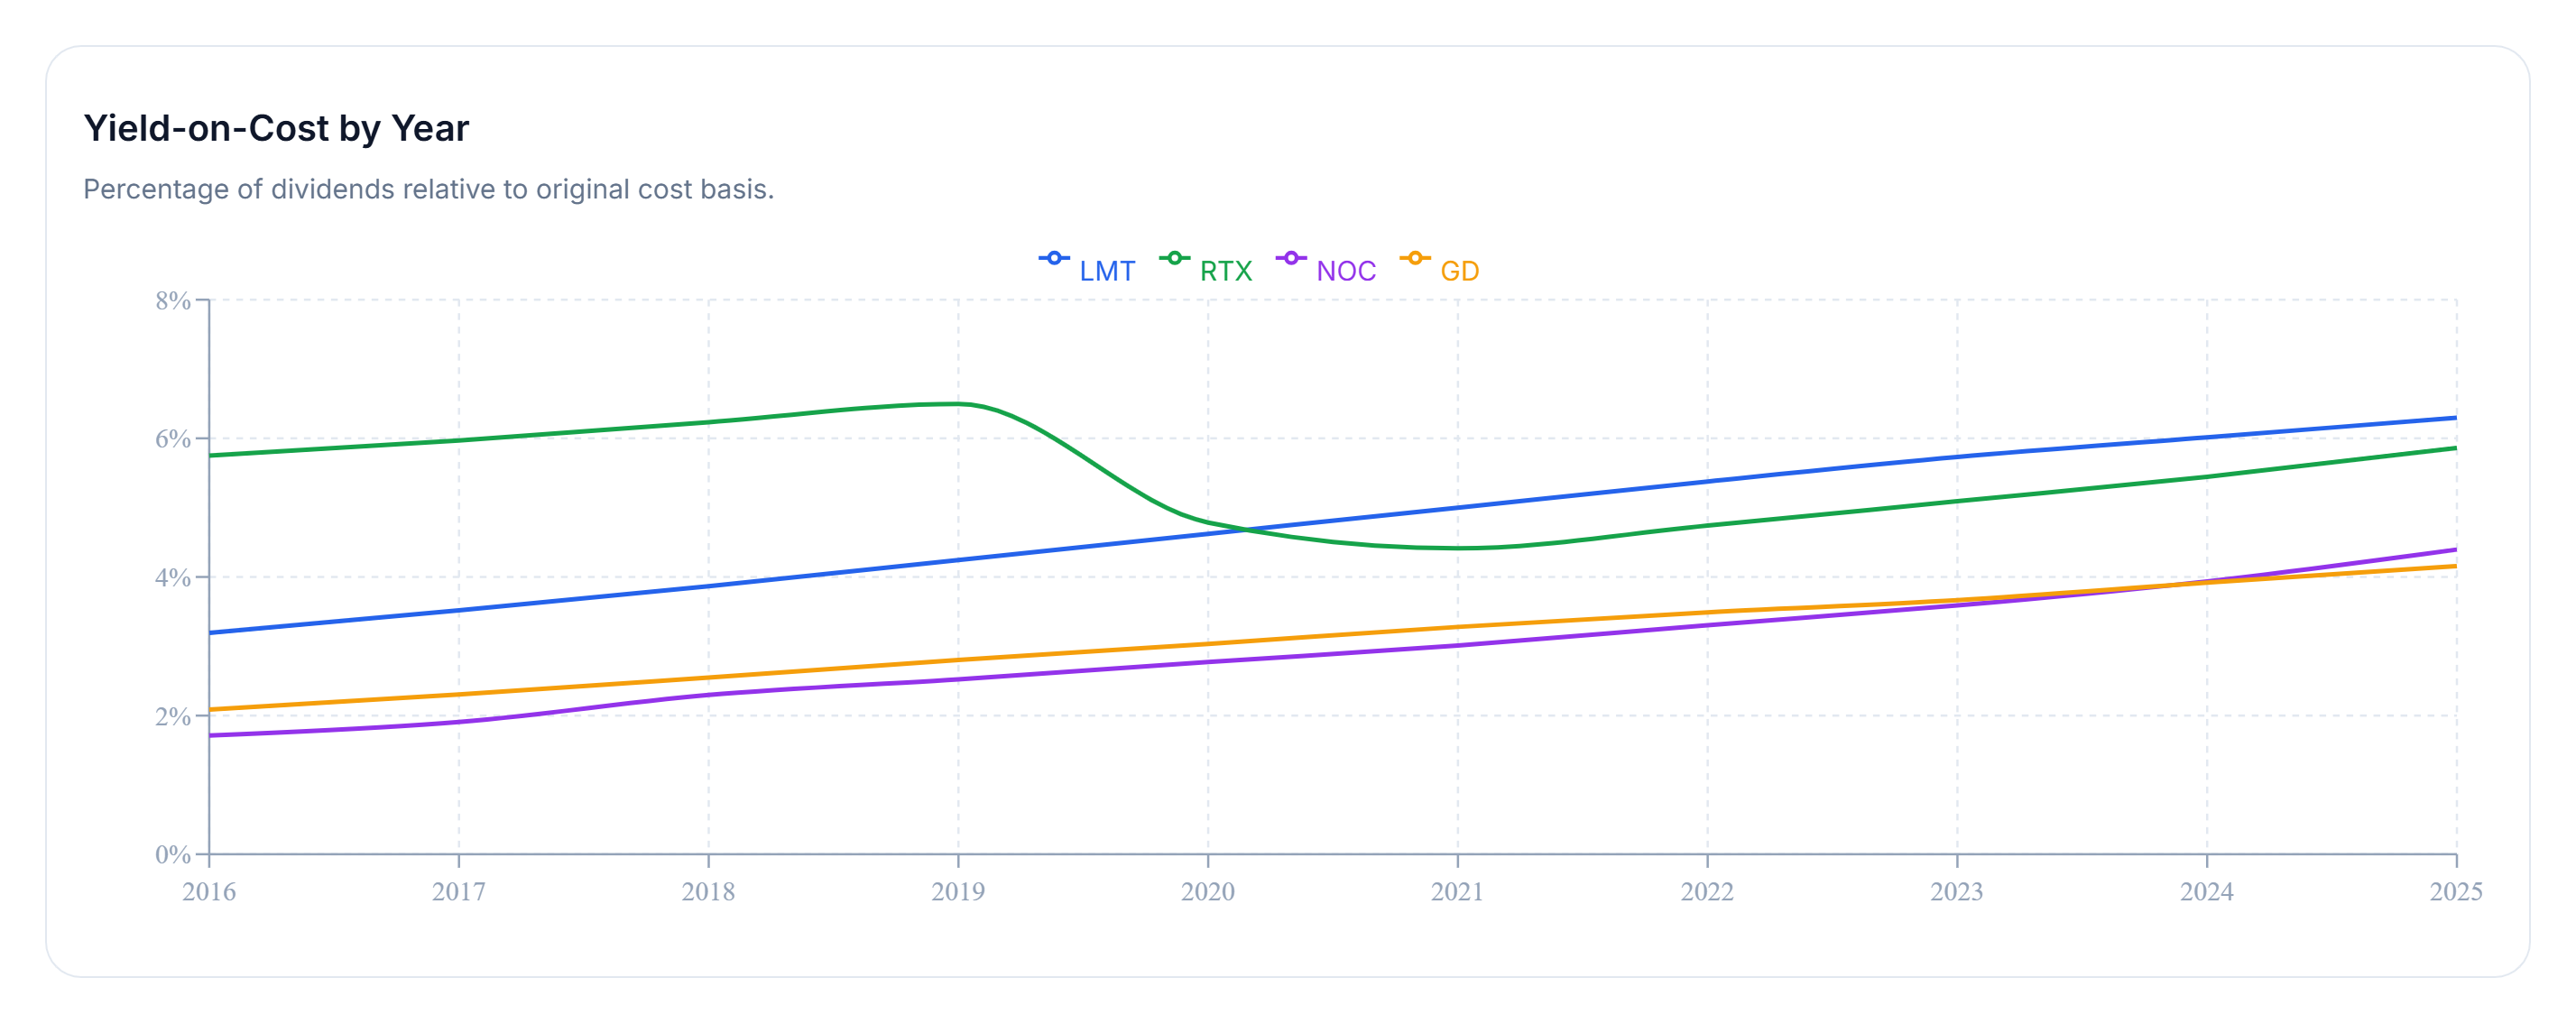
Yield on cost measures annual dividend income relative to the original capital invested. Unlike current dividend yield, it does not change simply because the market price moves.
For long-term dividend investors, this metric helps illustrate how income from an initial investment has developed over time.
Across the ten-year comparison, Lockheed Martin stands out, reaching approximately 6.30% yield on cost by the end of the period.
RTX, Northrop Grumman, and General Dynamics follow more gradual paths, but all show rising income trends relative to their original investment values.
These differences demonstrate why starting dividend yield and subsequent dividend growth should be considered together. A holding with a lower initial yield may gradually improve its income efficiency through dividend increases, while one with a higher initial yield begins with an immediate income advantage.
Yield on cost, however, is only one part of the investment picture. It measures income against the original purchase amount rather than the investment's current market value, and it does not represent total investment return.
The historical comparison reveals how each defense contractor has developed its dividend income over time. But past performance alone does not answer another practical question: how much money would an investor need to generate a specific level of income today?
Now let's shift from historical performance to today's income picture.
Income Goal Comparison
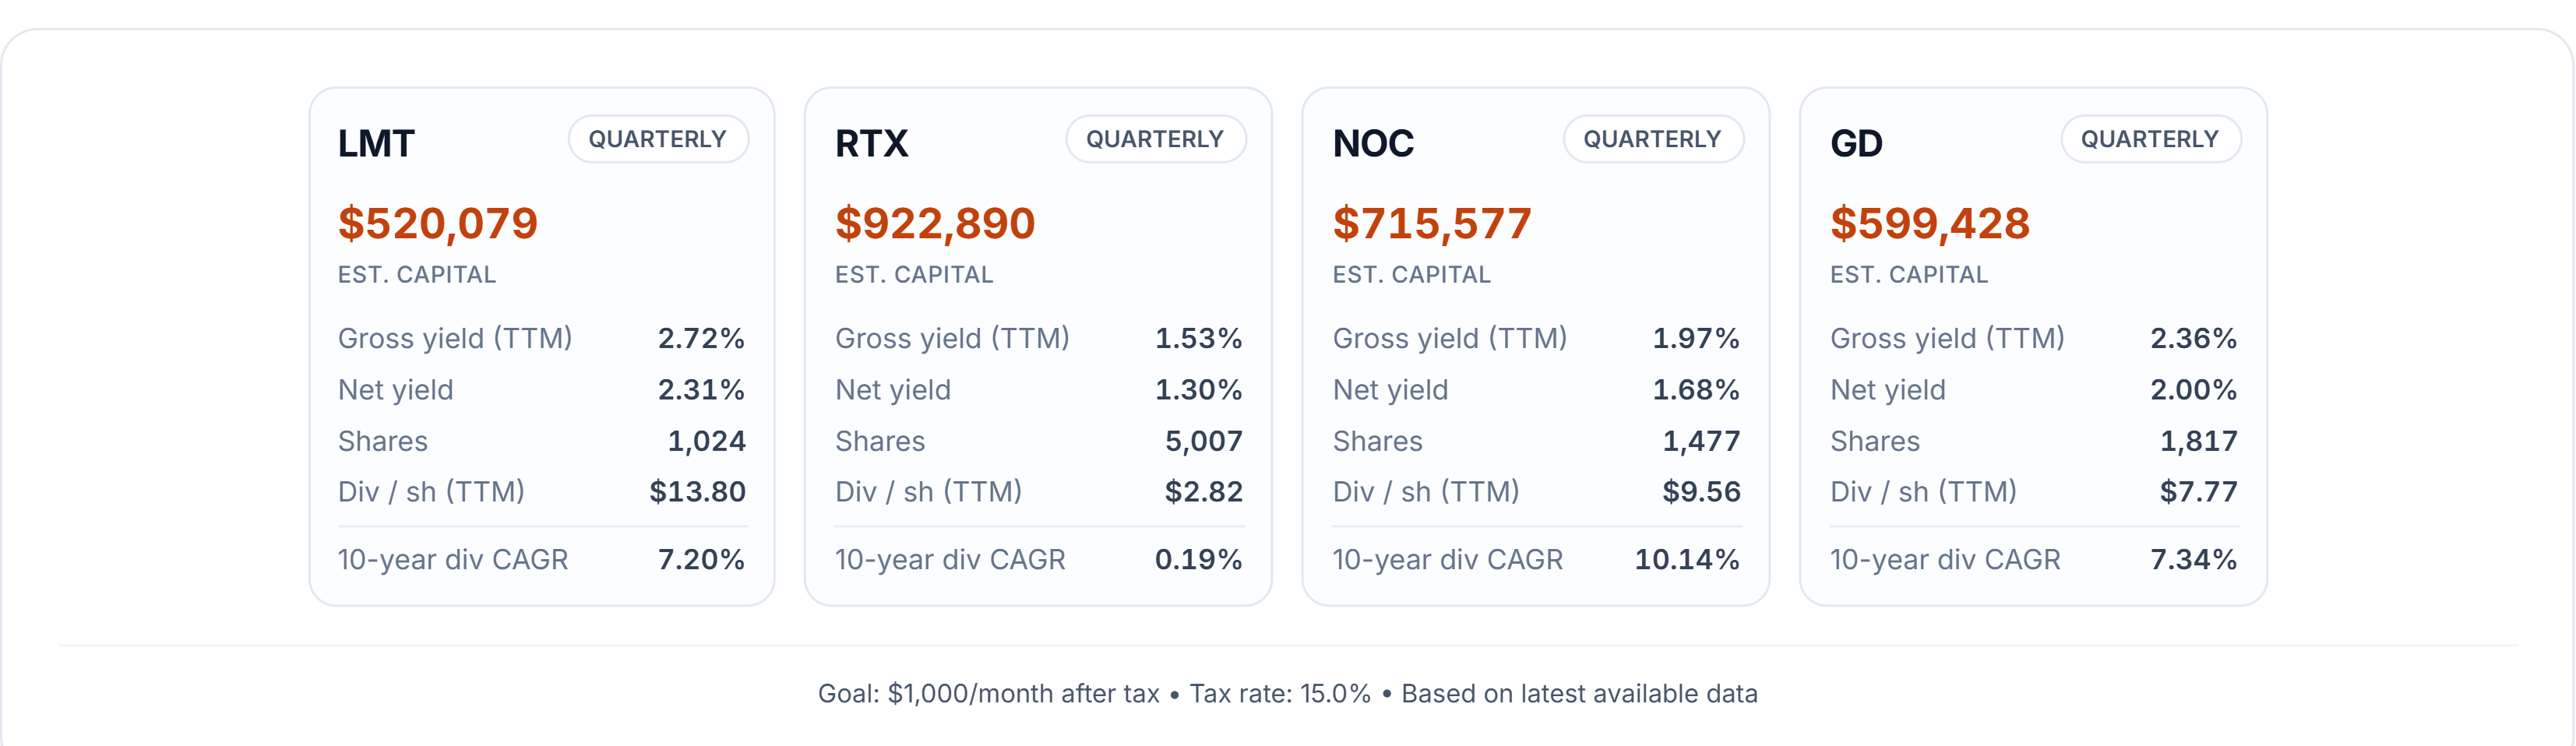
How much capital would an investor need to generate $1,000 per month in after-tax dividend income from each of these defense stocks?
The answer depends primarily on the current dividend yield and the assumed dividend tax rate.
For this comparison, DividendXray uses a 15% dividend tax assumption, applying the same income target to all four holdings.
Lockheed Martin (LMT) requires the least starting capital, at approximately $520,000, supported by a current dividend yield near 2.7%.
At the opposite end, RTX requires roughly $923,000, with a dividend yield closer to 1.5%.
Northrop Grumman and General Dynamics fall between these two extremes, offering different combinations of starting income and historical dividend growth.
The difference between LMT and RTX highlights an important consideration for income-focused investors: two companies operating in related industries can require substantially different amounts of capital to produce the same dividend income.
A higher starting yield generally reduces the capital required to reach an immediate income target. However, a lower-yielding company may offer a different long-term income trajectory if its dividends grow more quickly.
The comparison cards illustrate this tradeoff using today's dividend yields. They provide a snapshot of current income requirements, rather than a prediction of future payouts.
That leads to the next question: could stronger dividend growth eventually overcome the advantage of a higher starting yield?
Yield Catch-Up Timeline
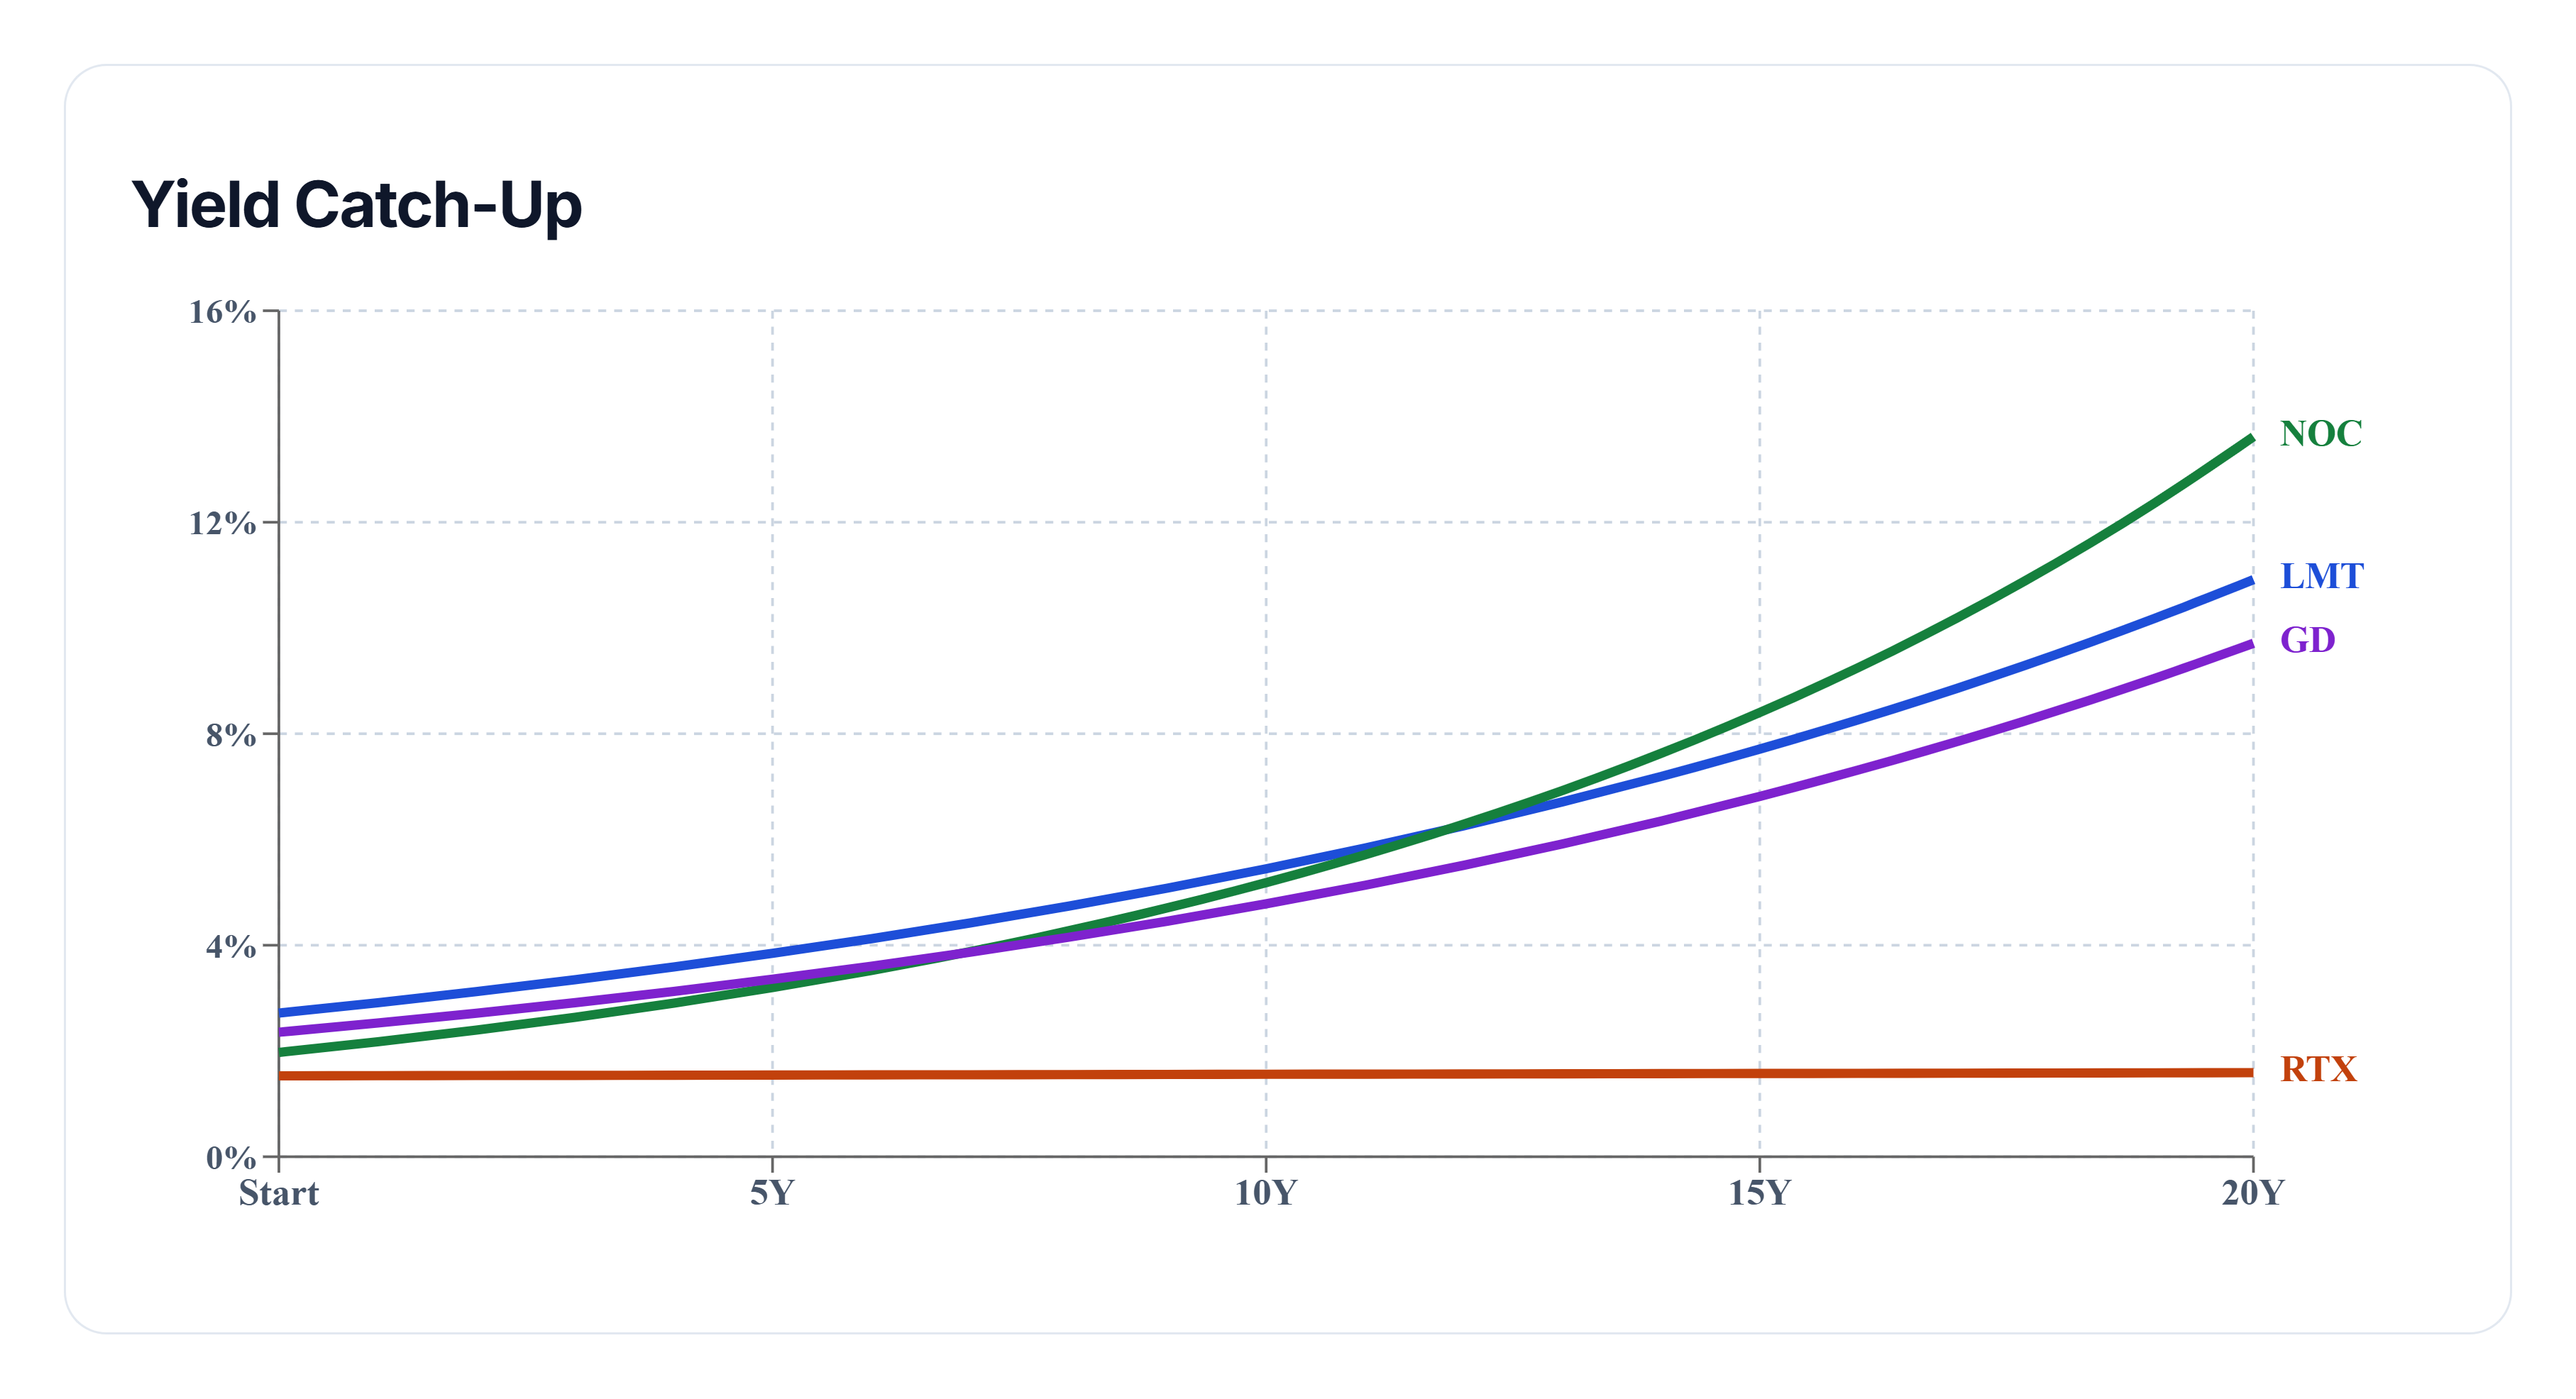
The yield catch-up timeline explores how dividend income efficiency could evolve if each company continues increasing its dividend at a pace similar to its historical ten-year compound annual growth rate.
Unlike the income goal comparison, which uses current yields, this section models future yield on cost over a 20-year projection period.
Northrop Grumman enters the projection with the strongest historical dividend growth rate, approximately 10.1% annually.
Lockheed Martin, meanwhile, begins with the highest current dividend yield, near 2.7%, giving it an immediate advantage in income generated per dollar invested.
RTX starts with a lower yield, near 1.5%.
Even across the full 20-year projection, RTX does not catch up to LMT in modeled yield on cost.
This illustrates how a higher starting yield can remain a meaningful advantage, even when comparing companies with different historical dividend growth rates.
The projections also require an important qualification. RTX's historical dividend growth figures reflect its 2020 corporate restructuring, including the dividend reset associated with that event. Extending this historical growth rate into the future therefore requires additional caution.
More broadly, dividend growth is rarely consistent from year to year. Companies may accelerate increases, slow them, freeze payments, or reduce dividends as business conditions change.
The catch-up timeline is best understood as a scenario based on historical assumptions, not a forecast or guarantee of future dividend income.
Final Takeaway
This ten-year defense stock battle produces different winners depending on the metric being evaluated.
Northrop Grumman leads in historical dividend growth, with a ten-year dividend CAGR of 10.14%.
Lockheed Martin leads in yield-on-cost improvement, reaching approximately 6.30% by the final year, and also requires the least capital to meet the modeled monthly income goal using today's yields.
RTX leads in historical price appreciation, with a ten-year price return of 304.57%, although its dividend growth record requires additional context because of the 2020 restructuring.
General Dynamics remains a competitor across the comparison, even without securing a category win.
When today's income requirements are added to the historical results, the distinction between dividend growth and immediate income becomes clearer. LMT offers the strongest starting income position among these four holdings, while NOC leads in historical dividend growth.
The long-term projection adds another perspective: strong dividend growth can improve income efficiency, but it does not automatically eliminate the advantage of a higher starting yield.
Ultimately, the comparison illustrates why dividend investors should examine starting yield, dividend growth, historical price performance, and future income assumptions together, rather than relying on a single metric.
All comparisons and projections are based on the stated DividendXray research assumptions and are intended for educational purposes, not investment advice.