DE vs CAT vs UNP vs LMT: Industrial Dividend Battle

Portfolio Overview
In this DividendXray battle, we compare four industrial and infrastructure leaders across income growth, yield-on-cost expansion, and total return performance over a five-year period.
- Deere & Company (DE) combines agricultural and construction equipment with a long history of dividend growth and capital appreciation.
- Caterpillar (CAT) is one of the world's largest manufacturers of heavy machinery and industrial equipment, supported by decades of cash flow generation.
- Union Pacific (UNP) operates one of North America's largest railroad networks, providing critical transportation infrastructure and consistent dividend growth.
- Lockheed Martin (LMT) is a leading aerospace and defense contractor known for resilient earnings, reliable dividends, and long-term shareholder value creation.
Each company operates in a different corner of the industrial economy, but all four have established reputations for rewarding shareholders through dividend payments and long-term growth.
Category Winners
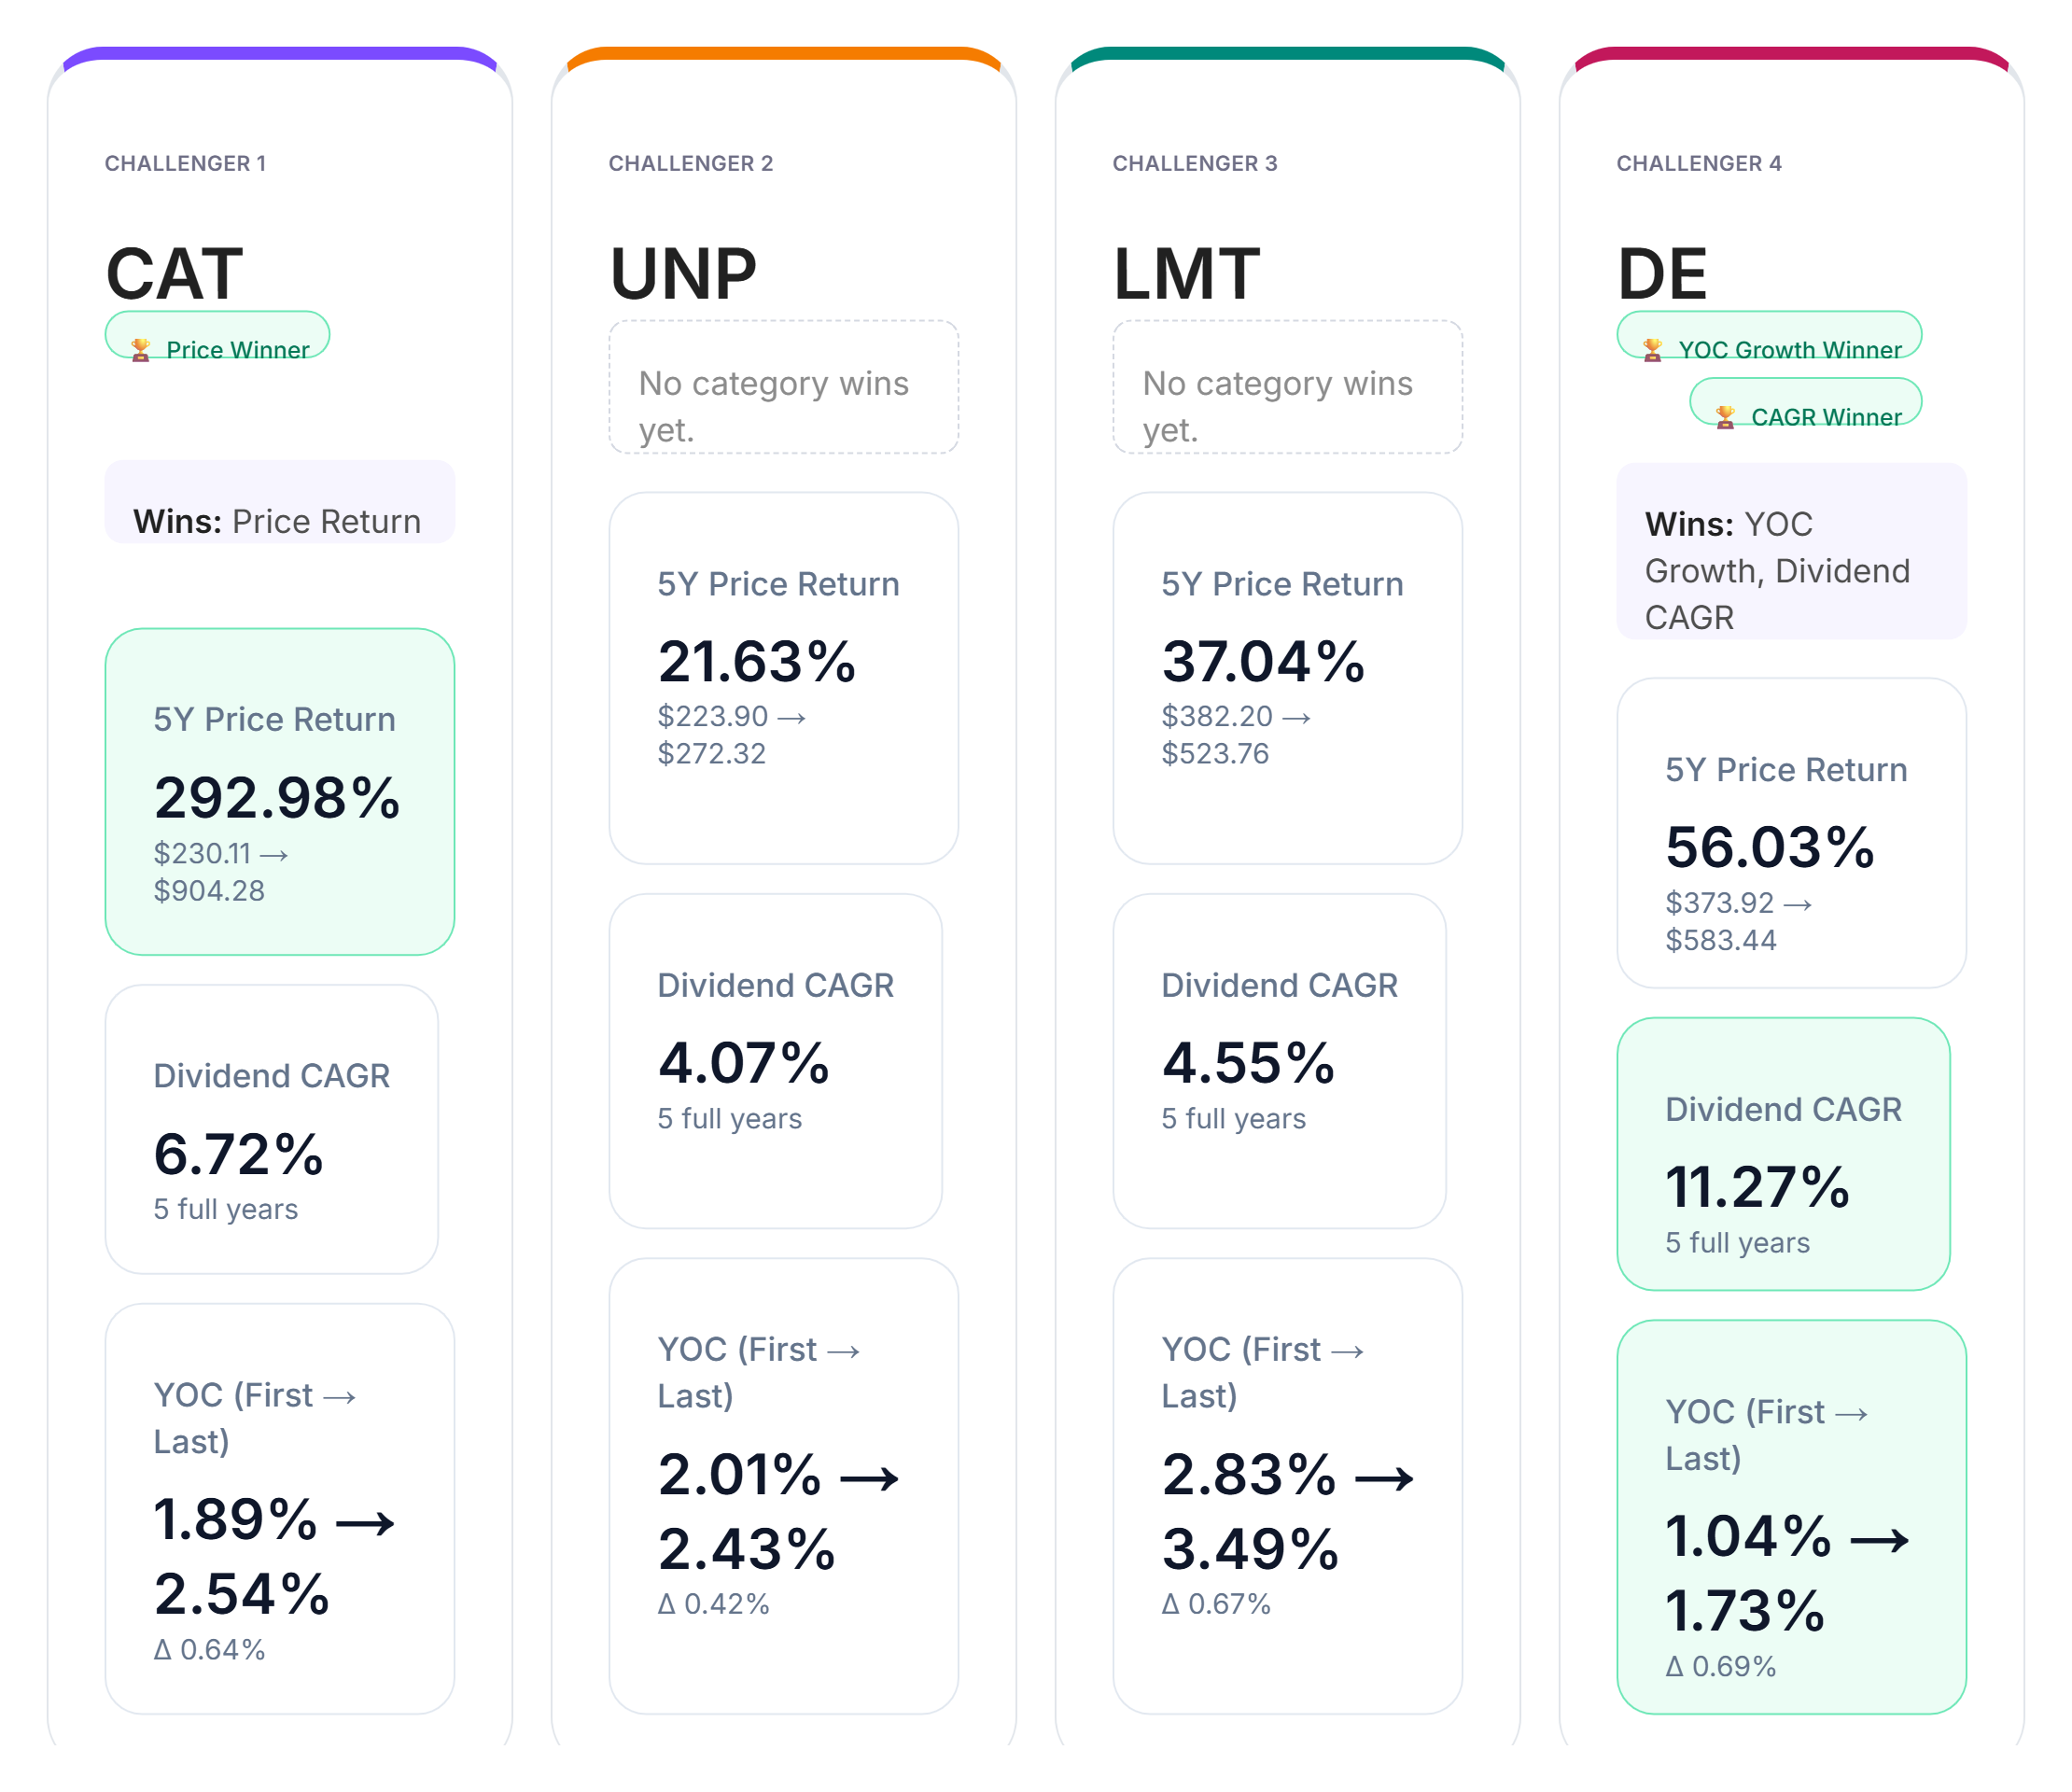
Looking at the data across dividend CAGR, yield-on-cost growth, and price return, clear category leaders emerge.
In dividend growth, DE leads the group with a five-year dividend CAGR of 11.27%.
For yield-on-cost growth, DE again takes the top spot, showing the strongest improvement from the first year to the last and demonstrating exceptional income growth relative to the original investment.
In price return, CAT claims the category win with an outstanding 292.98% five-year return, significantly outperforming the other challengers in capital appreciation.
UNP and LMT deliver solid performance across all categories, but they do not secure a category win in this comparison. The results highlight how different industrial business models can generate shareholder value through both income growth and capital appreciation.
Yield-on-Cost by Year
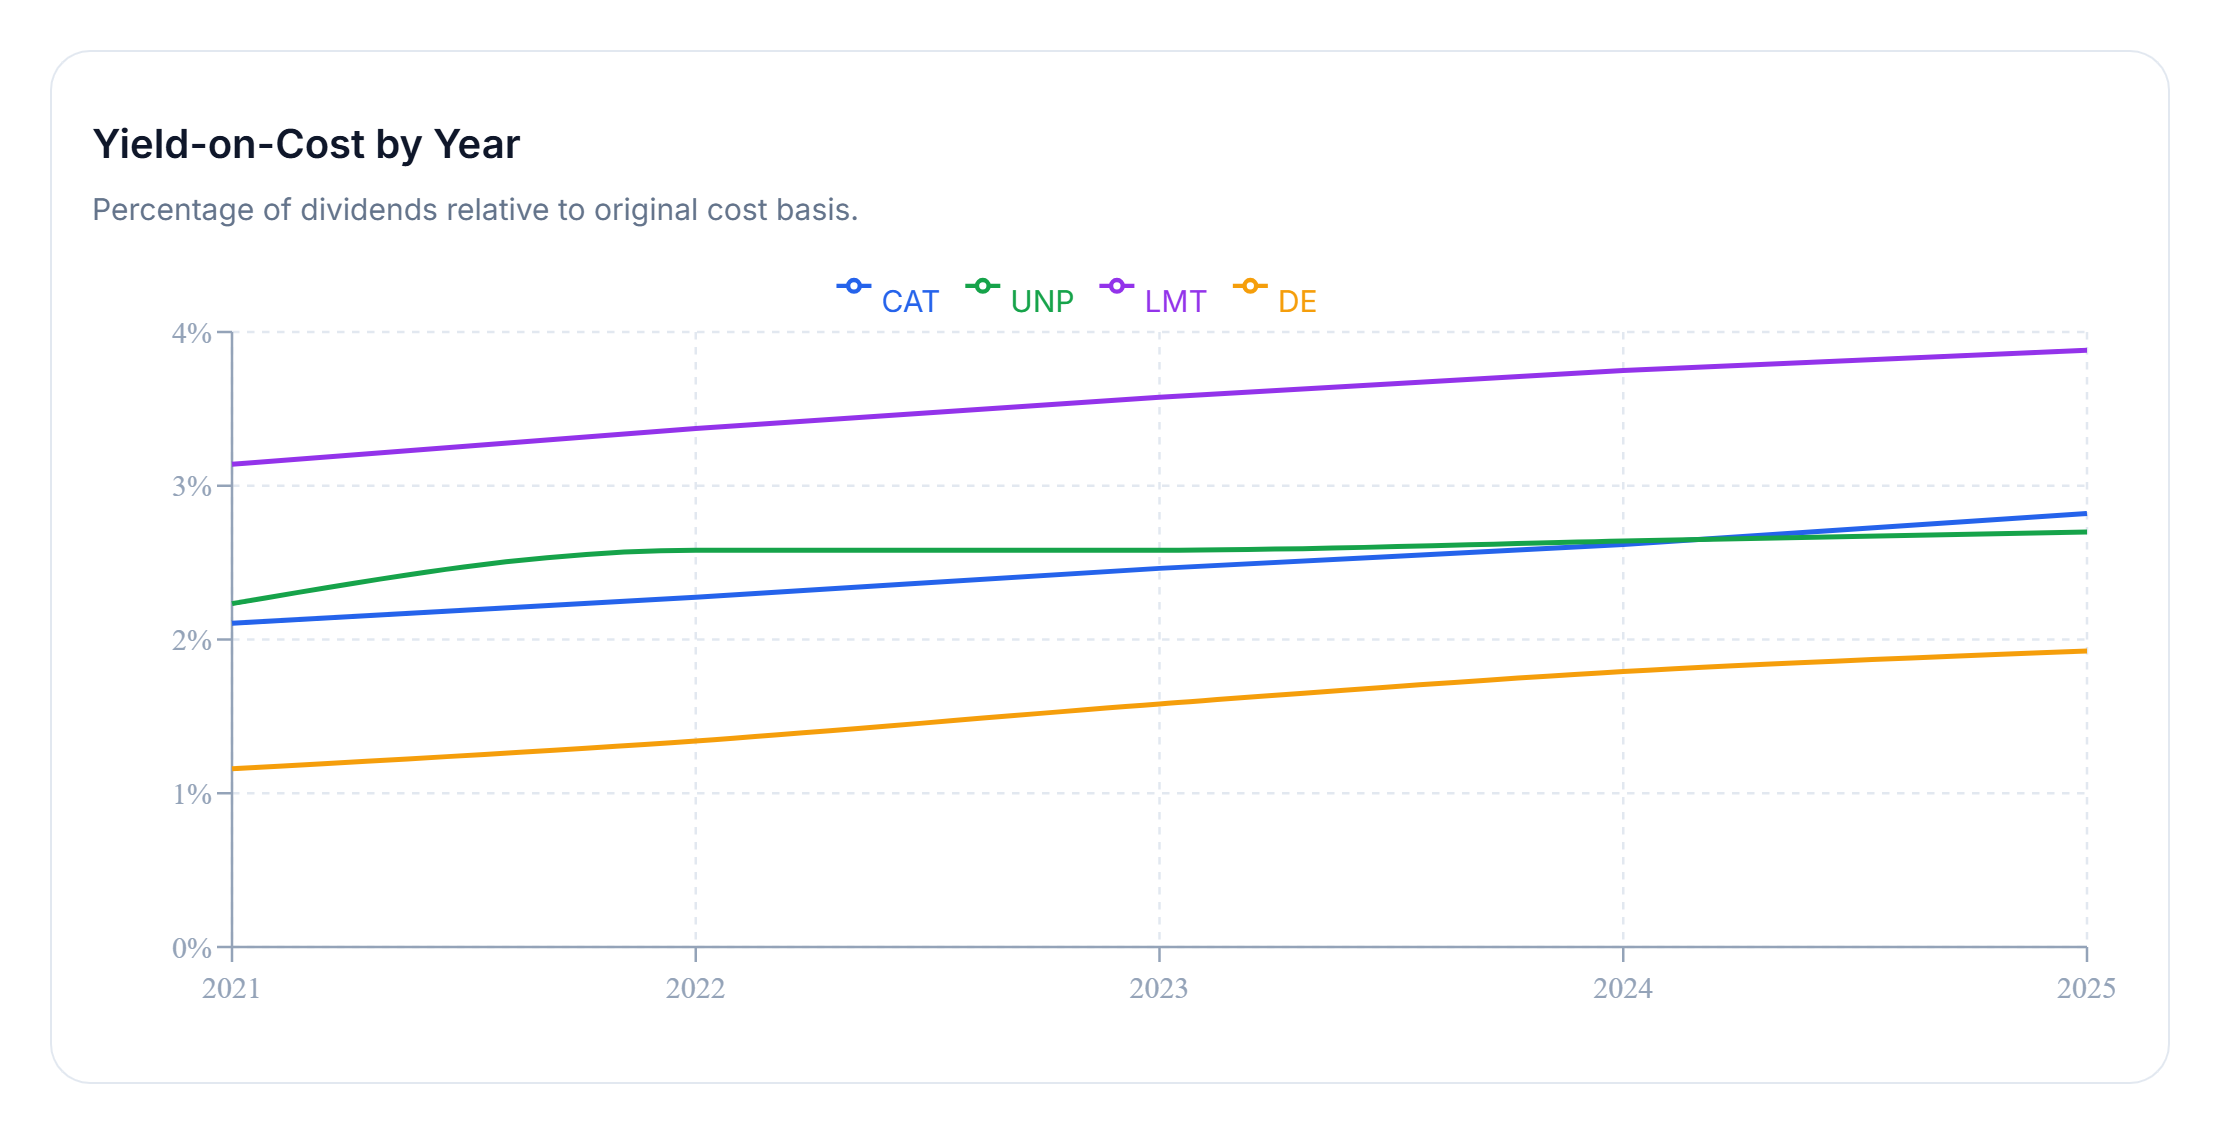
Yield-on-cost measures dividend income relative to the original capital invested. Unlike current yield, it focuses on how efficiently a holding grows income over time.
Over the five-year period, LMT stands out with the strongest income efficiency, reaching approximately 3.49% yield on cost by the end of the period.
DE, CAT, and UNP all demonstrate steady upward income trends as well, reflecting the benefits of consistent dividend growth and disciplined capital allocation. While annual increases may appear modest in isolation, their cumulative effect becomes increasingly meaningful over longer investment horizons.
For income-focused investors, yield-on-cost growth provides a useful perspective on how effectively a company converts dividend increases into higher future income without requiring additional capital contributions.
Final Takeaway
There is no single "perfect" industrial dividend stock. Each company offers a different blend of dividend growth, income efficiency, and capital appreciation potential.
This battle shows that DE currently dominates the dividend growth categories, while CAT delivers exceptional total return performance. LMT distinguishes itself through strong yield-on-cost efficiency, demonstrating how consistent dividend increases can enhance income generation over time.
Ultimately, the best choice depends on whether your primary objective is maximizing dividend growth, pursuing long-term capital appreciation, or balancing both within a diversified dividend portfolio.