Industrial Dividend Engine: CAT, LMT, UNP & DE Portfolio Analysis

Portfolio Overview
This portfolio is built around industrial leadership, infrastructure strength, and long-term dividend growth. It combines Caterpillar (CAT), Lockheed Martin (LMT), Union Pacific (UNP), and Deere & Company (DE) to create a diversified income engine tied to construction, defense, transportation, and agriculture.
CAT provides global exposure to construction and heavy equipment demand supported by long-term infrastructure spending trends. LMT contributes stable aerospace and defense cash flow backed by government contracts and defense budgets. UNP strengthens the portfolio through railroad pricing power and freight infrastructure income, while DE adds agricultural equipment exposure and industrial automation growth.
This mix creates a diversified industrial dividend portfolio focused on durable businesses with strong cash generation and steadily rising shareholder payouts.
Dividend Growth Trend
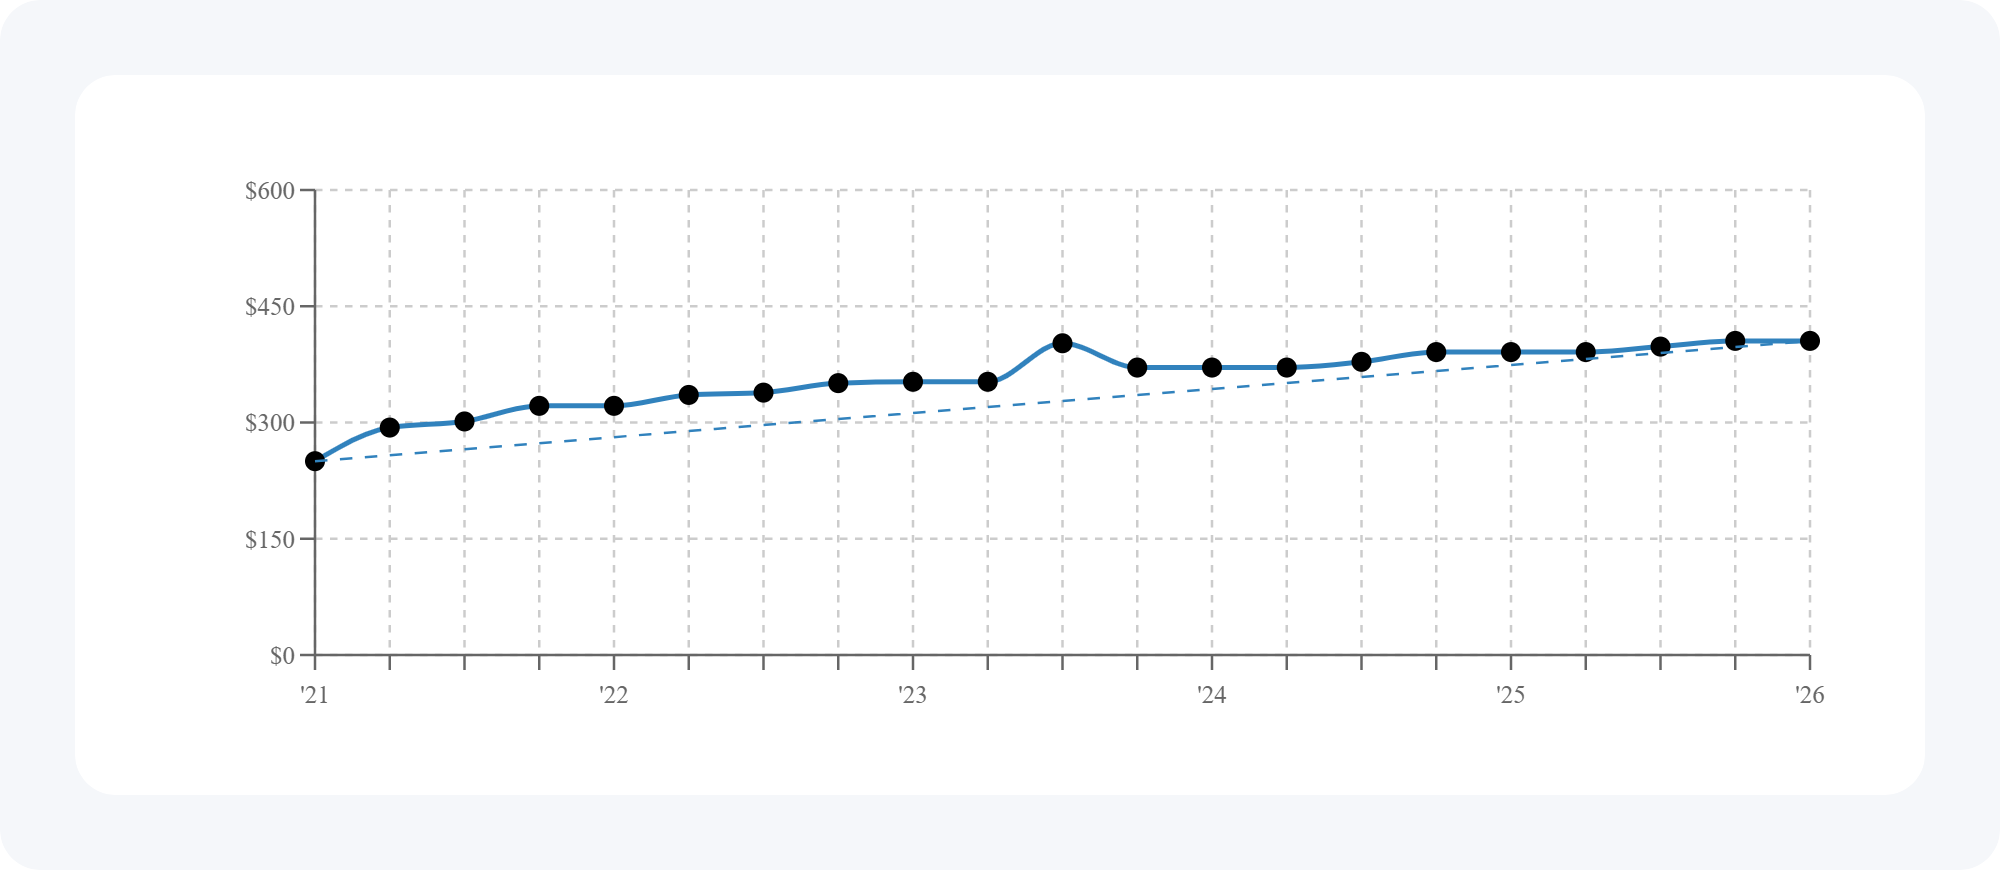
Here's the dividend growth trend for these holdings over the last five years.
Based on dividend history, the average quarterly income for this portfolio increased by roughly 37.1%, rising from approximately $292 to about $400 per quarter over the five-year period.
This illustrates the long-term strength of dividend growth investing. Even without adding new capital, businesses with durable earnings and consistent dividend increases can steadily grow portfolio income over time — helping improve both long-term cash flow and future yield on cost.
Portfolio Snapshot

Here's the quick snapshot for this portfolio:
- Yield on cost: 1.6%
- Annual dividend income: $1,621 per year
- Monthly dividend income: about $135 per month
- Dividend income growth: roughly 7.5% per year over five years
- Average ETF expense ratio: 0%
This portfolio emphasizes dividend growth and industrial stability rather than maximizing current yield. The focus is on building a long-term income stream supported by durable industrial businesses with strong competitive positioning.
Income Breakdown by Holding
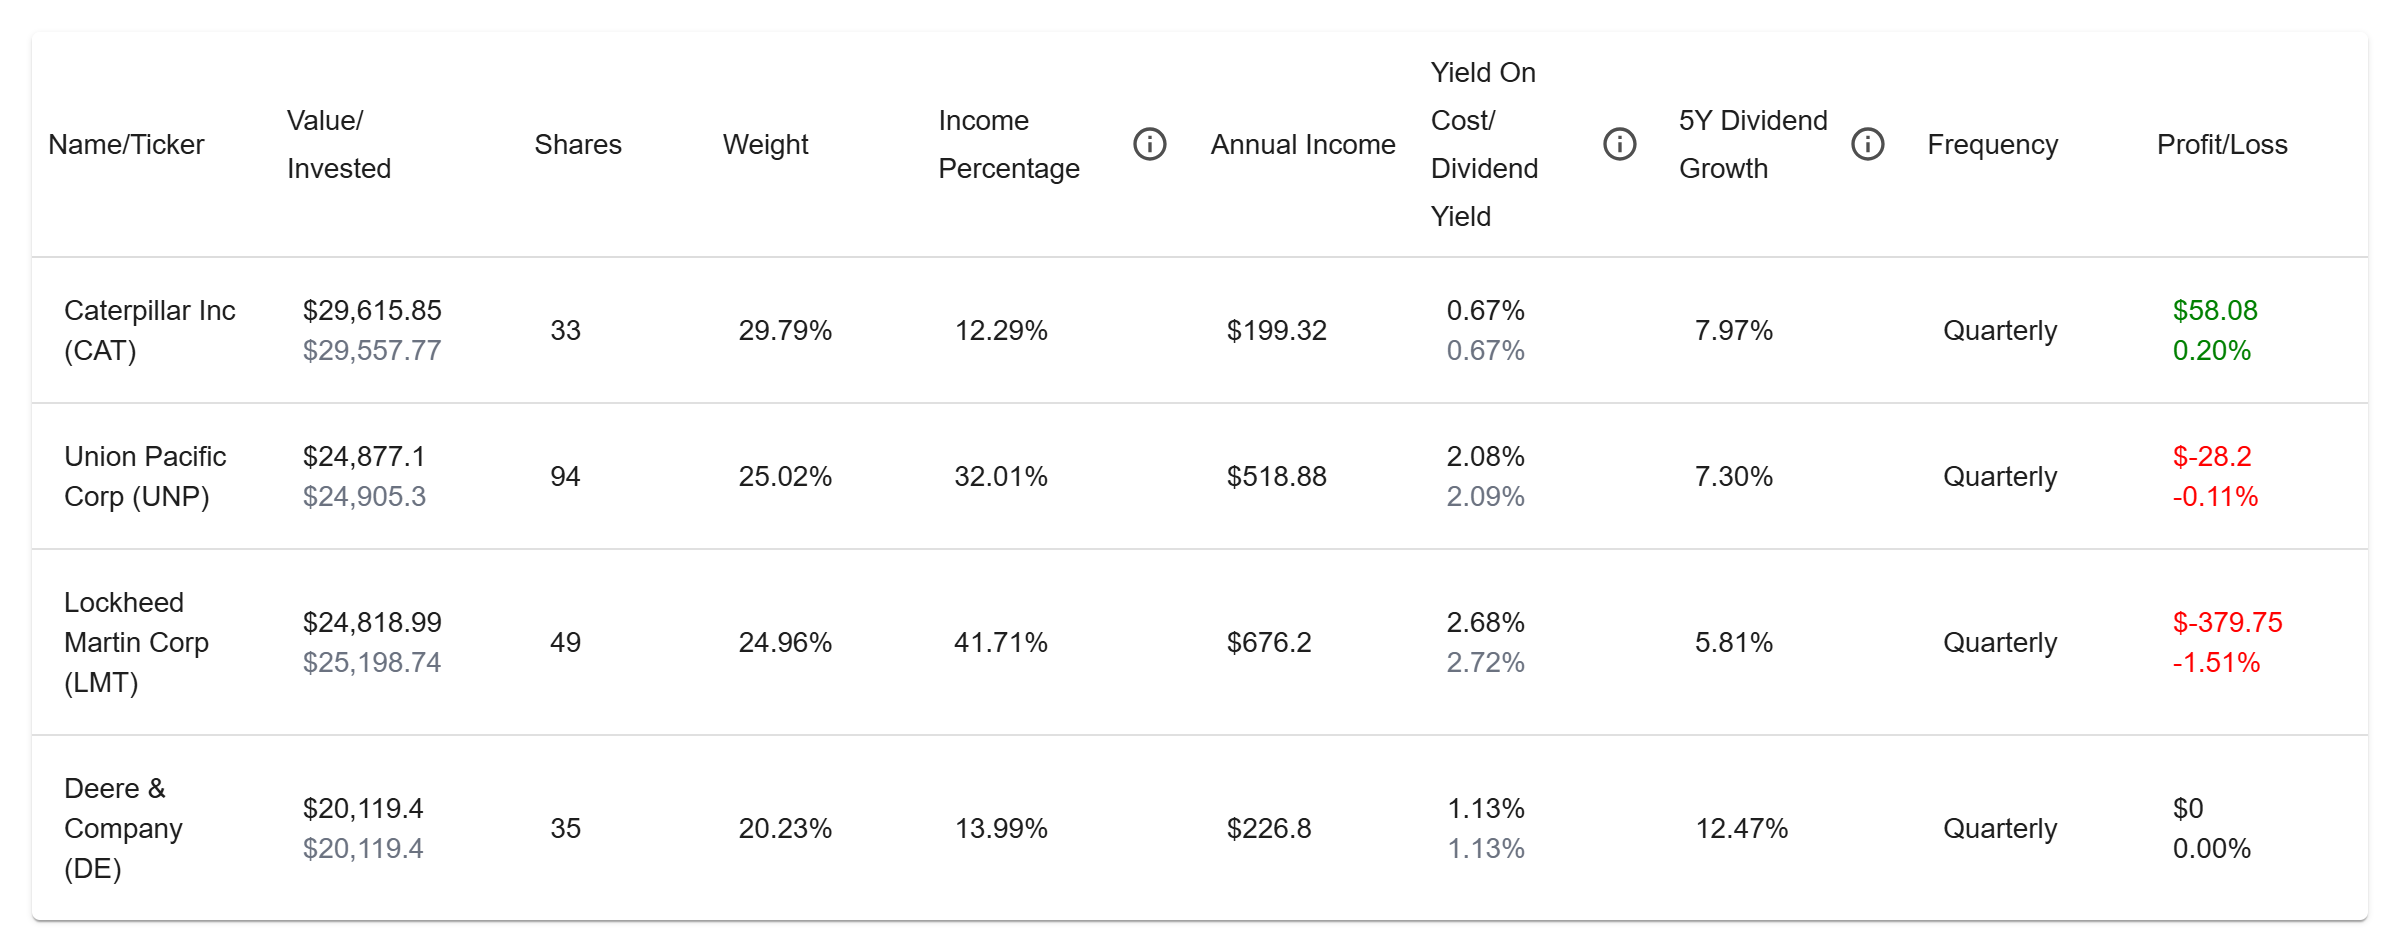
Here's how the portfolio's dividend income is split between the holdings:
- LMT: about 41.7% of the income (roughly $676 per year)
- UNP: about 32.0% (about $519 per year)
- DE: about 14.0% (about $227 per year)
- CAT: about 12.3% (about $199 per year)
All holdings pay quarterly.
5-year dividend growth rates included in this portfolio:
- LMT: 5.8%
- UNP: 7.3%
- DE: 12.5%
- CAT: 8.0%
This allocation creates a balanced industrial dividend engine: steady defense cash flow from LMT, infrastructure and railroad income from UNP, faster dividend growth from DE, and global construction exposure through CAT.
Forward Income Outlook
If income growth continues in line with recent history, this portfolio's cash flow could rise steadily over time.
- Yield on cost may grow from 1.6% today to about 2.3% in five years
- Annual income could increase from $1,621 to roughly $2,325
- Monthly income could rise from $135 to about $194
- And this projection is described as happening without adding new capital or reinvesting dividends
That's one of the key attractions of industrial dividend growth investing: stable businesses with rising cash flow can potentially produce steadily increasing income streams over long periods of time, even with a passive holding approach.