LLY vs MRK vs AMGN vs GILD: Dividend Growth vs Income
Portfolio Overview
In this DividendXray battle, we compare four major pharmaceutical and biotechnology companies — Eli Lilly (LLY), Merck (MRK), Amgen (AMGN), and Gilead Sciences (GILD) — across dividend growth, yield-on-cost expansion, and price return performance over a ten-year period.
Each company operates in the healthcare sector but brings a different business focus to the comparison:
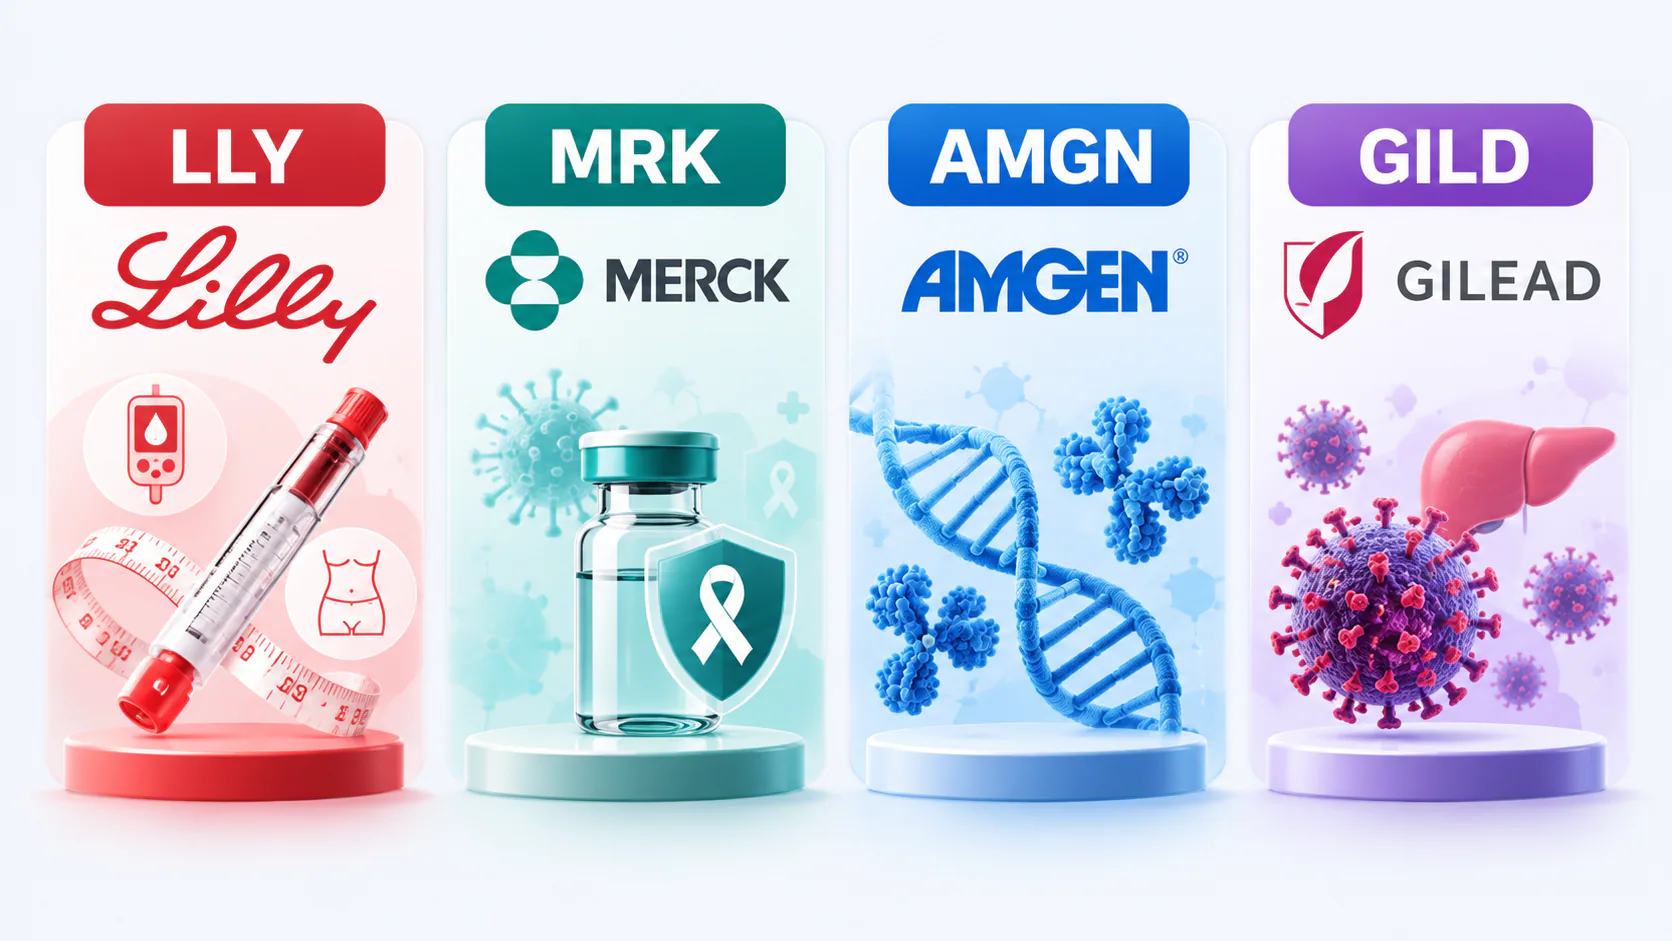
- Eli Lilly (LLY) develops treatments for diabetes, obesity, and other major health conditions, combining established pharmaceutical products with expanding therapeutic opportunities.
- Merck (MRK) is a global pharmaceutical company known for its cancer treatments and vaccines, with a broad portfolio of healthcare products.
- Amgen (AMGN) specializes in biotechnology, developing treatments for serious and chronic diseases across multiple therapeutic areas.
- Gilead Sciences (GILD) focuses heavily on antiviral medicines, particularly treatments for HIV and liver diseases.
Although all four companies operate in healthcare, their businesses, dividend policies, and historical growth trajectories differ.
This comparison explores those differences through three perspectives: historical investment performance, today's dividend income potential, and projected future income growth.
Category Winners
Looking at ten years of dividend growth, yield-on-cost expansion, and price appreciation, one company emerges as the clear historical leader.
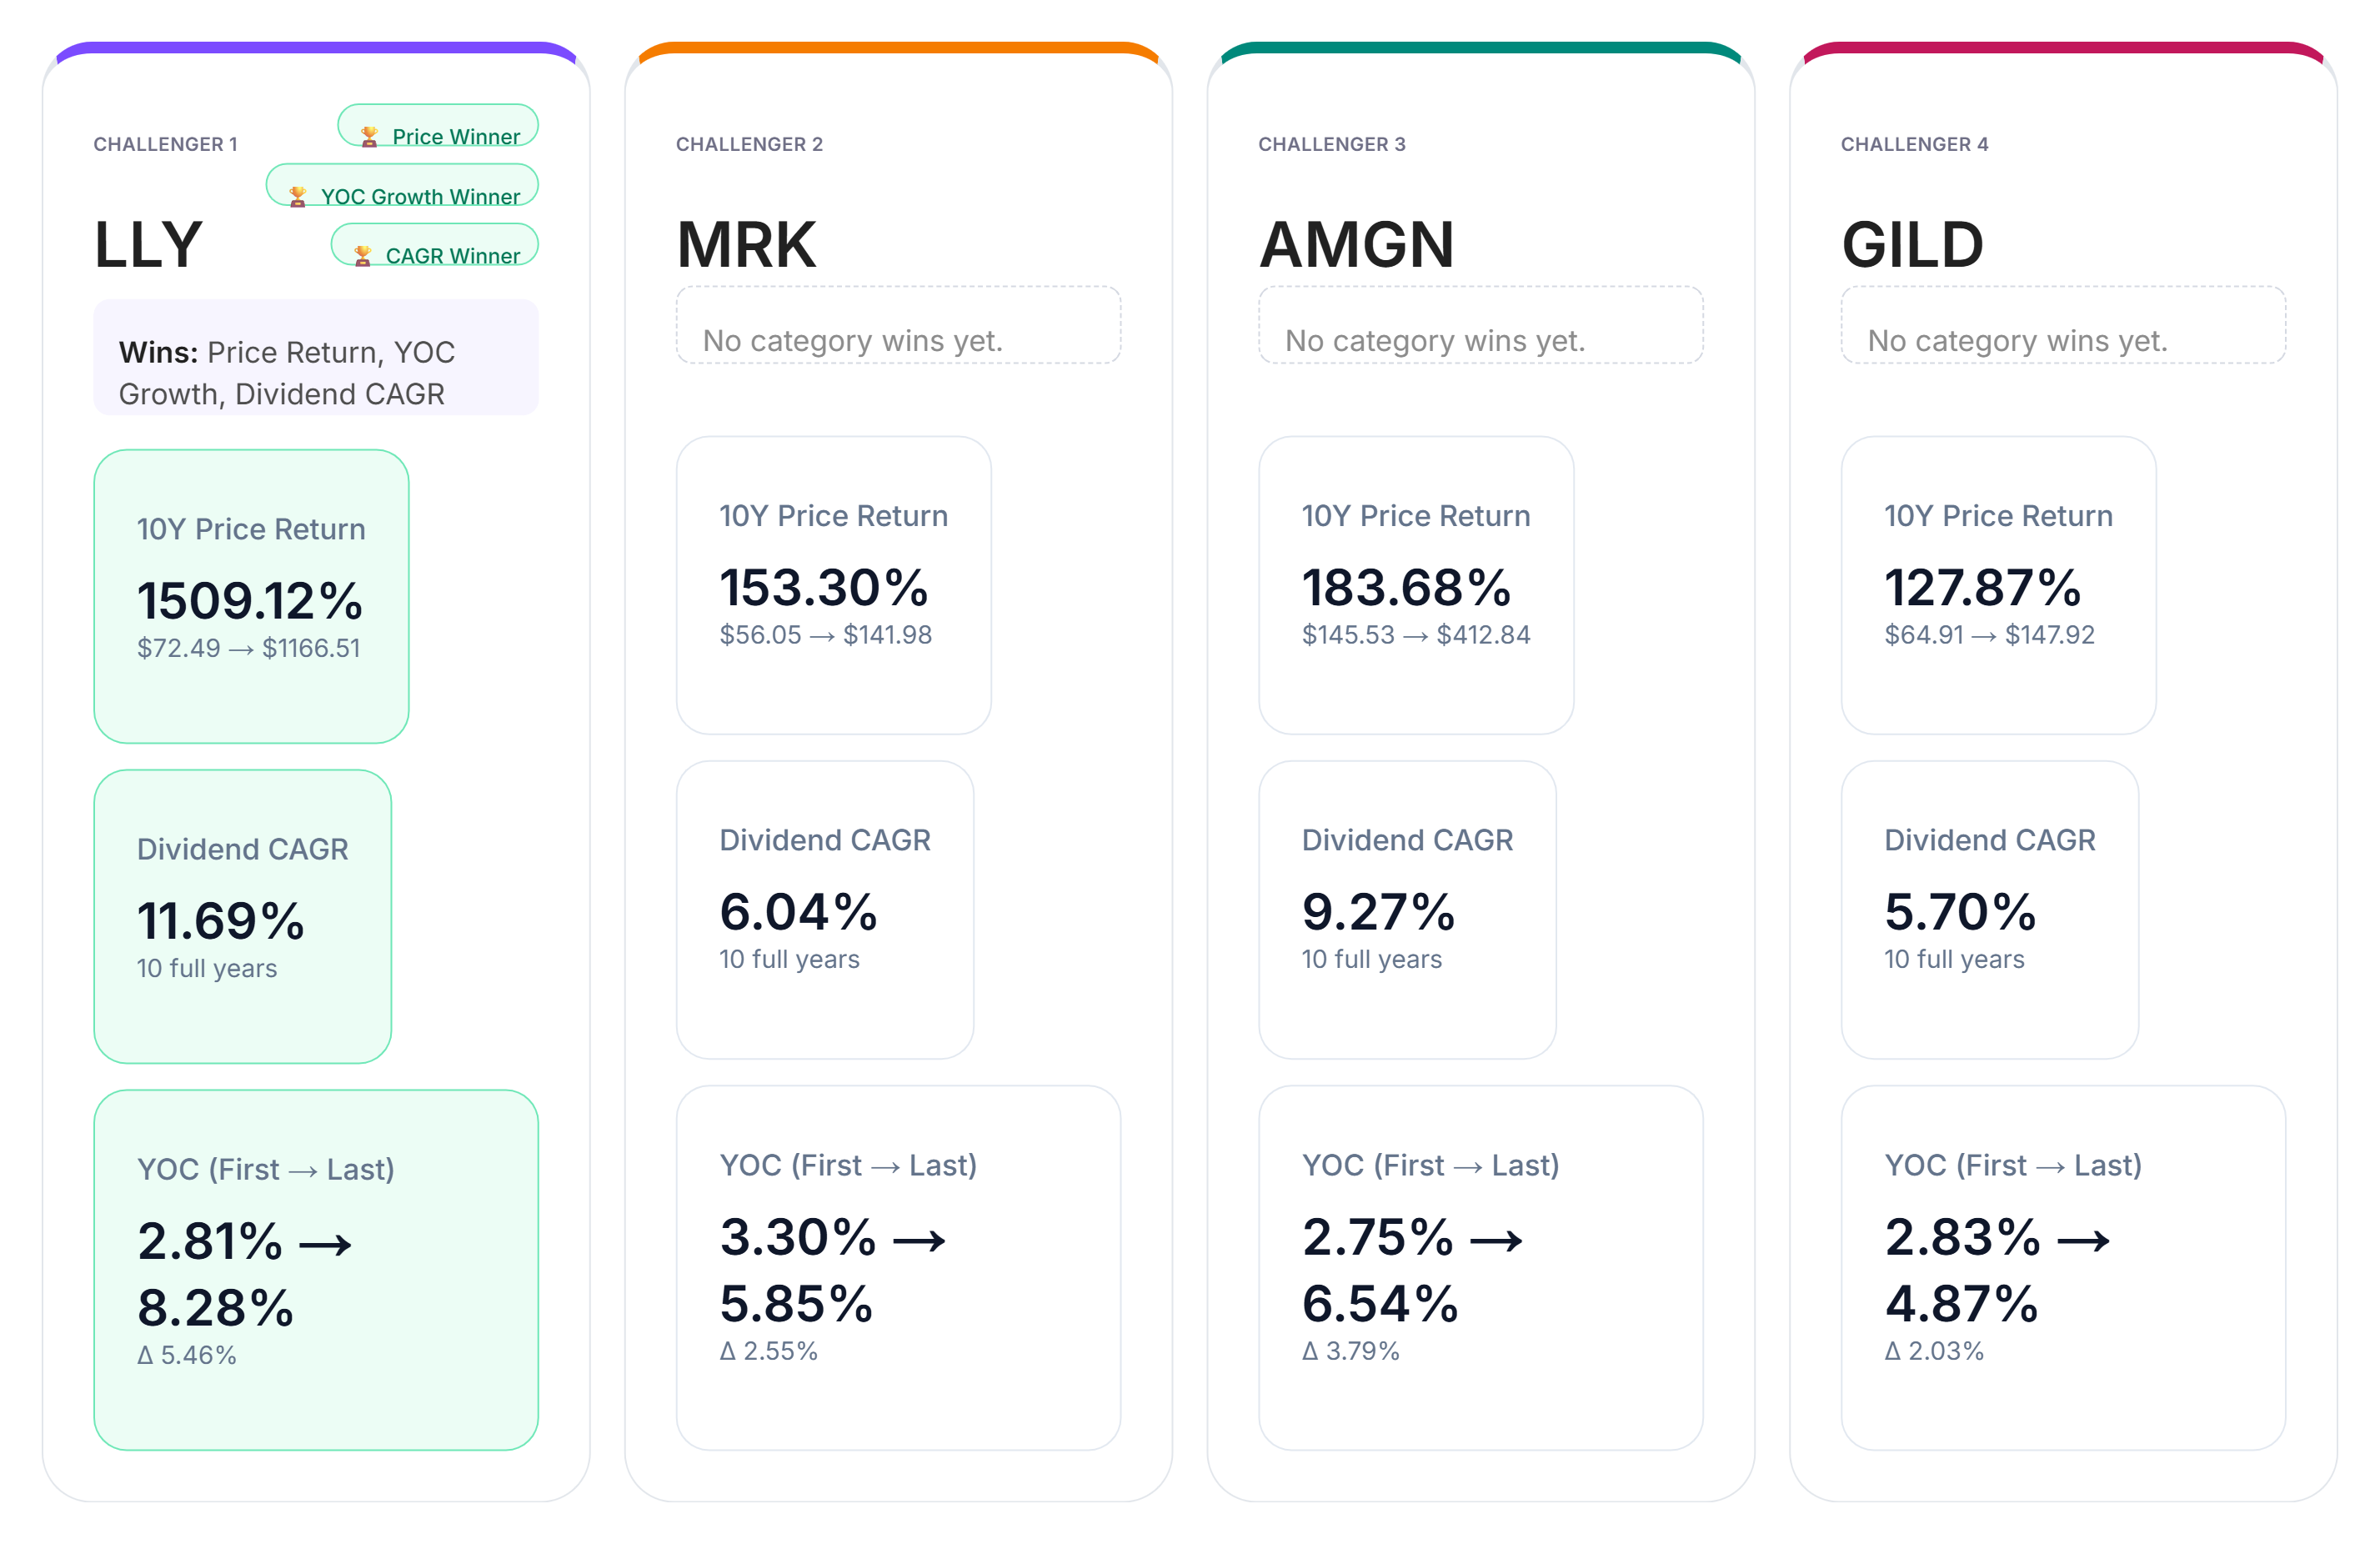
In dividend growth, Eli Lilly leads the group with a ten-year dividend CAGR of 11.69%. This reflects the company's strong historical pace of dividend increases compared with Merck, Amgen, and Gilead Sciences.
For yield-on-cost growth, Eli Lilly again takes the lead, recording the strongest improvement between the first and final years of the comparison. This shows how substantially its annual dividend income increased relative to the original investment.
The most dramatic difference appears in price return.
Eli Lilly delivered an extraordinary ten-year price gain exceeding 1,500%, substantially outperforming the other three companies in share-price appreciation.
Merck, Amgen, and Gilead each followed different performance paths, but none secured a category victory in this particular historical battle.
Eli Lilly wins all three categories: dividend CAGR, yield-on-cost growth, and price return.
However, historical leadership does not necessarily translate into the most attractive starting dividend income today.
That distinction becomes particularly important when comparing a company with exceptional historical growth against alternatives offering higher current dividend yields.
Yield-on-Cost by Year
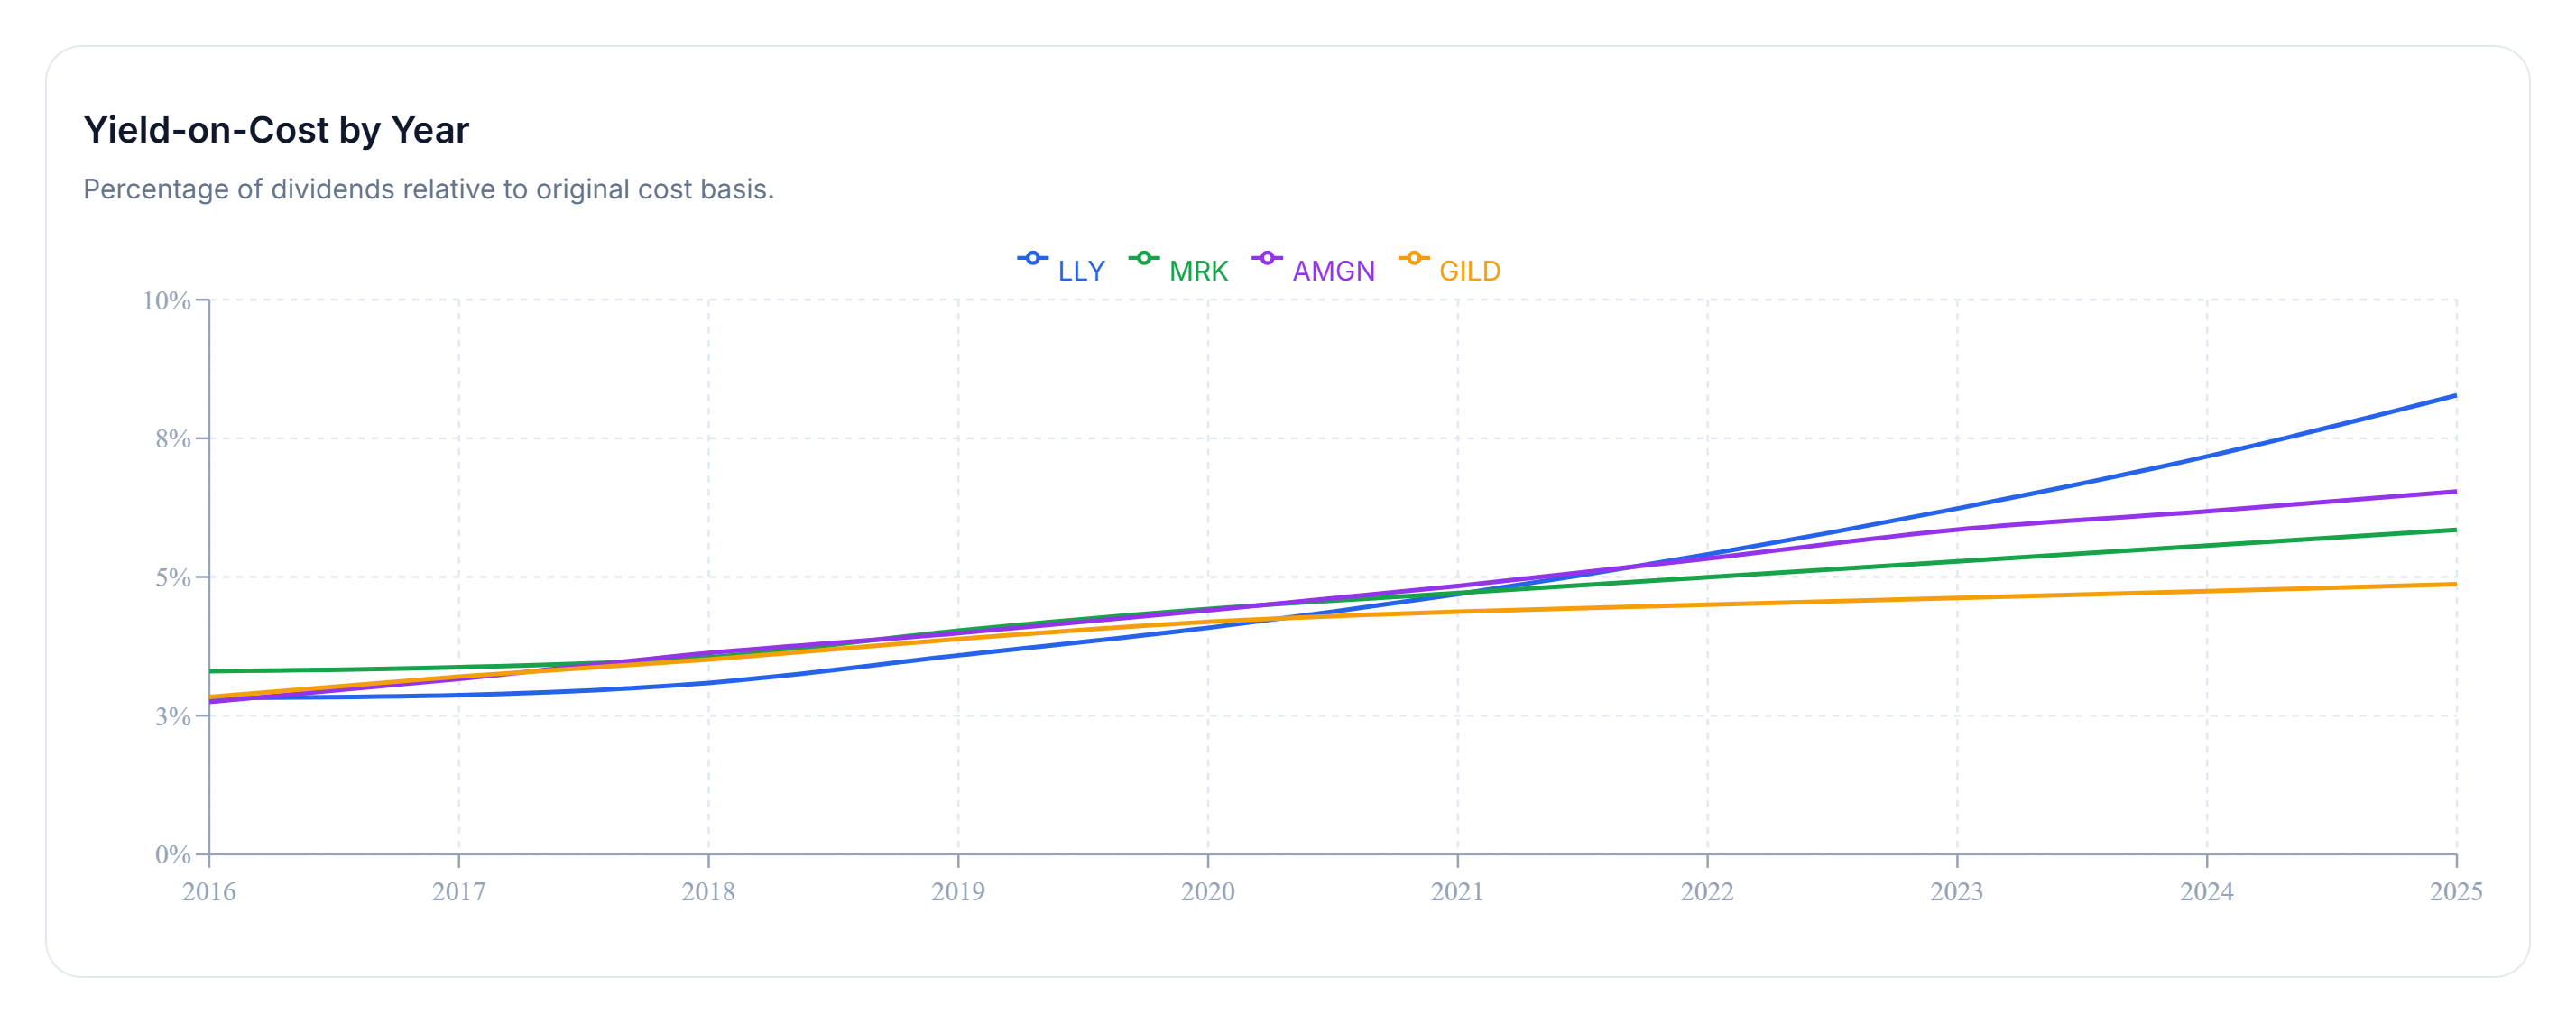
Yield on cost measures annual dividend income relative to the original purchase price of an investment.
Unlike current dividend yield, which changes as the market price moves, yield on cost helps illustrate how a company's dividend payments have grown relative to the capital initially invested.
Over the ten-year historical window, Eli Lilly stands out with the strongest yield-on-cost growth, reaching approximately 8.28% by the end of the period.
This result reflects the impact of sustained dividend increases on the income generated by an original investment.
Merck, Amgen, and Gilead Sciences also demonstrate upward income trends throughout the comparison, although their yield-on-cost trajectories are more gradual.
The differences highlight an important distinction for long-term dividend investors.
A stock does not need to offer the highest initial dividend yield to produce meaningful income growth over time. Companies that consistently increase their dividends can gradually improve the income generated by each dollar originally invested.
However, dividend growth is only part of the investment equation.
A company may produce excellent historical dividend growth while still offering a relatively low current yield to someone purchasing shares today.
That brings us to the second phase of the analysis: moving from ten years of historical performance to today's income picture.
Income Goal Comparison
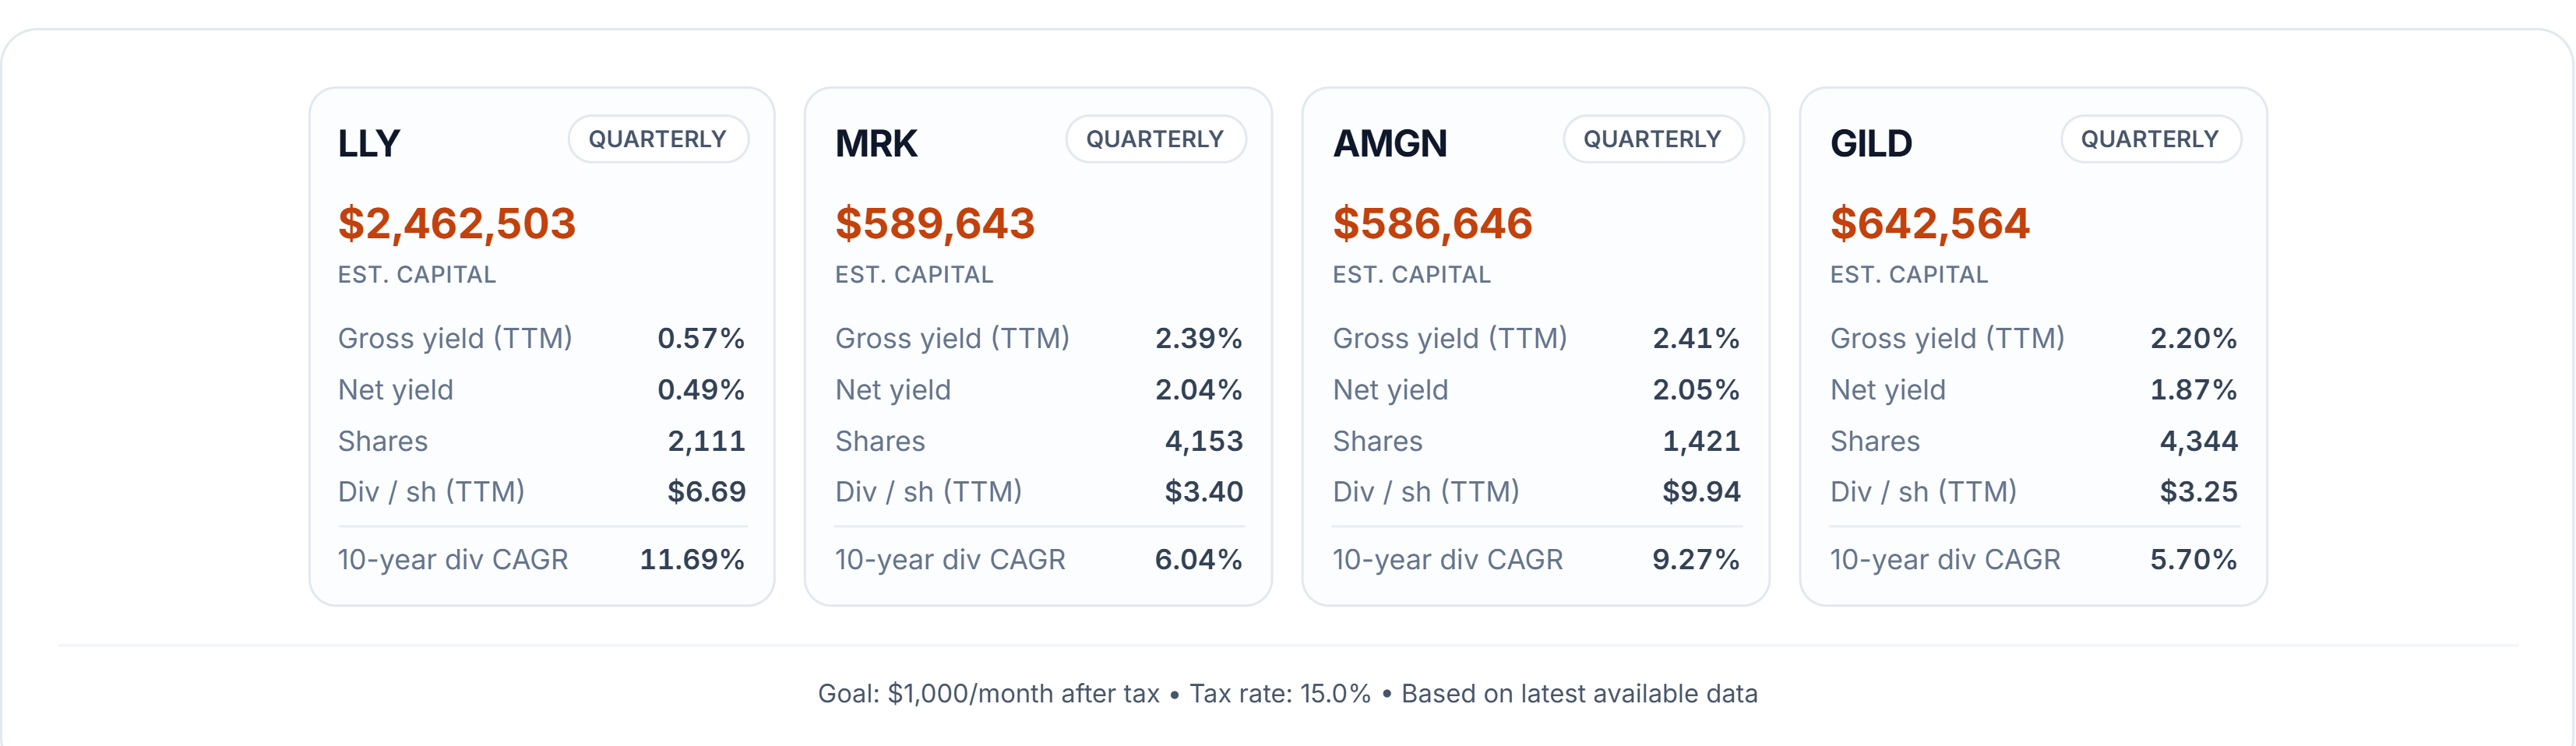
How much capital would an investor need today to generate $1,000 per month in after-tax dividend income from each of these four companies?
The answer depends primarily on each company's current dividend yield.
For this comparison, we assume a 15% dividend tax and calculate the approximate starting capital required to reach the same monthly income target.
The differences are substantial.
Amgen (AMGN) requires the least starting capital of the four companies, at approximately $587,000, supported by a dividend yield of around 2.4%.
For investors prioritizing immediate dividend income, this higher starting yield provides a significant advantage in capital efficiency.
At the opposite end of the comparison is Eli Lilly (LLY).
Despite dominating the historical growth categories, Eli Lilly requires approximately $2.46 million to generate the same monthly after-tax dividend income, reflecting its much lower starting dividend yield of around 0.6%.
Merck and Gilead Sciences fall between these two extremes, offering different combinations of current dividend income and historical dividend growth.
This comparison reveals one of the central tradeoffs in dividend investing.
A company can deliver exceptional historical share-price appreciation and dividend growth while still requiring substantially more capital to generate meaningful income at today's market price.
For investors who need dividend income immediately, starting yield matters enormously.
For those with longer investment horizons, the question becomes whether faster future dividend growth can eventually compensate for a lower initial yield.
That leads directly to the final phase of the analysis.
Yield Catch-Up Timeline
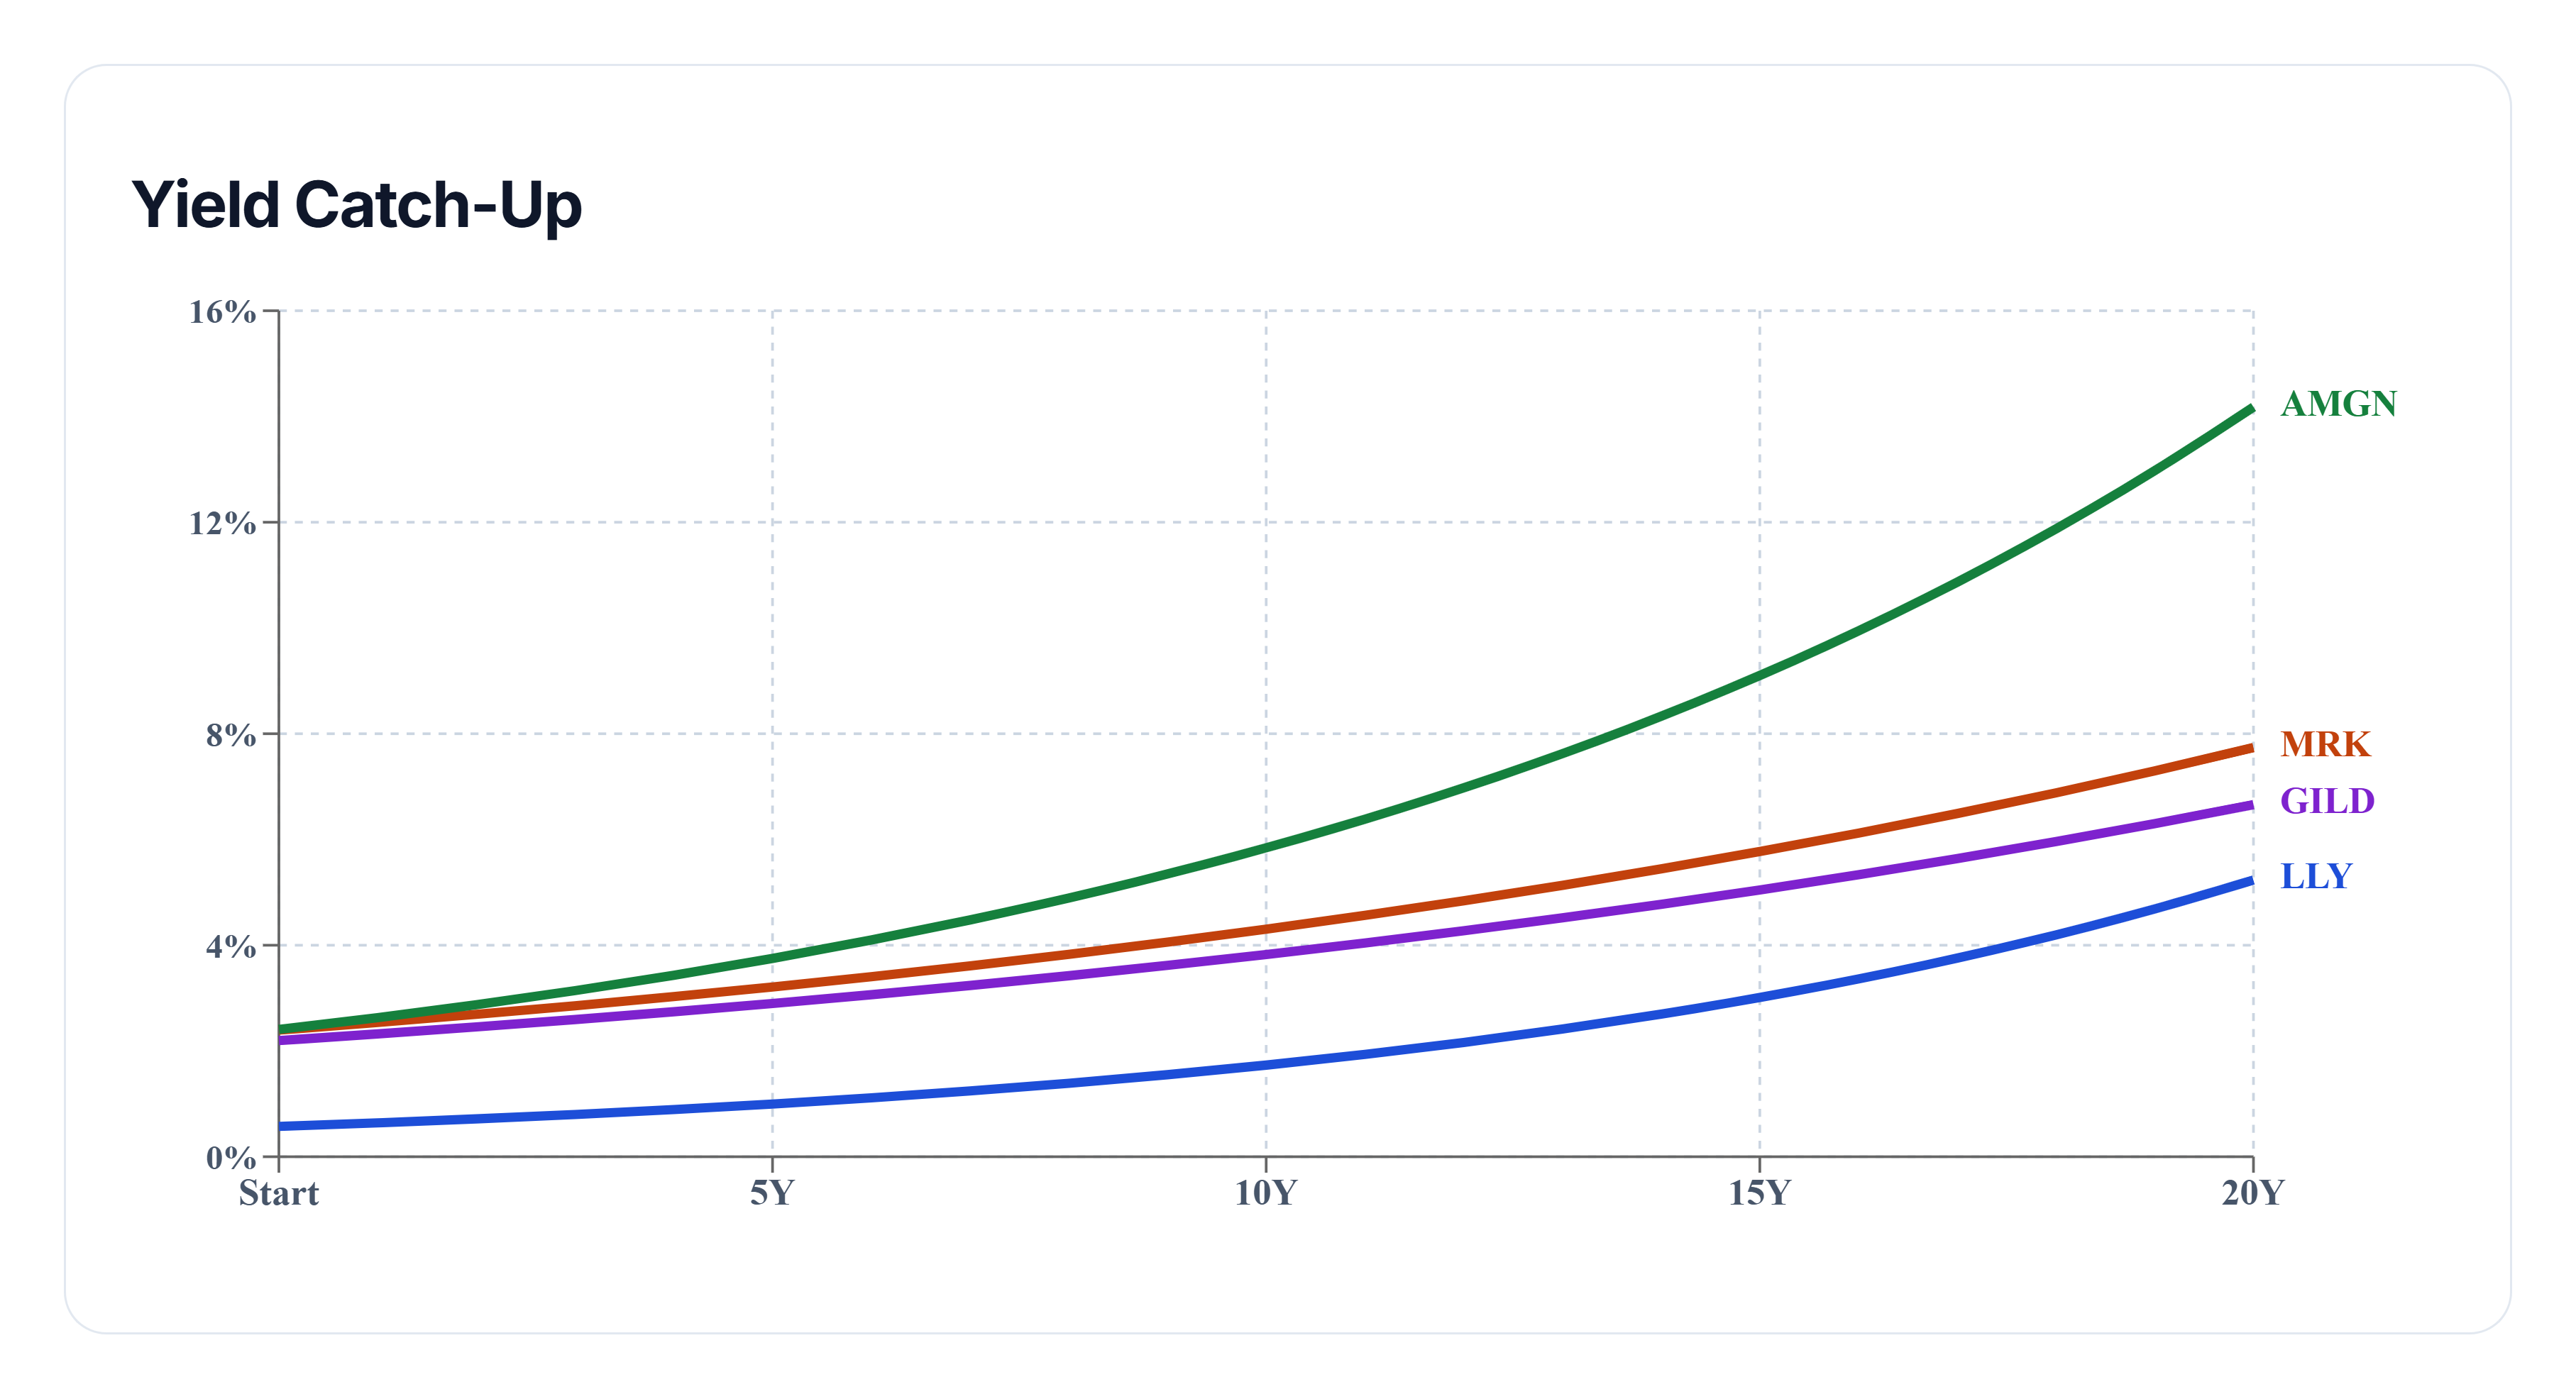
The yield catch-up timeline explores how dividend income efficiency might evolve if each company continues increasing its dividend at a rate similar to its historical ten-year average.
Rather than predicting future stock prices, the model focuses on yield on cost — the annual dividend income generated relative to the original investment.
At the beginning of the projection, Amgen offers the highest starting dividend yield, near 2.4%, while Eli Lilly begins at approximately 0.6%.
However, Eli Lilly enters the projection with a considerably faster historical dividend growth rate.
Using its ten-year dividend growth history, the model assumes Eli Lilly's dividend increases by approximately 11.7% annually.
Over time, this faster dividend growth helps Eli Lilly narrow the income-efficiency gap.
But the starting difference is substantial.
Even after twenty years of projected dividend growth, Eli Lilly's yield on cost still does not catch up with Amgen's in this model.
This is the most revealing result of the forward-looking comparison.
Faster dividend growth can improve income efficiency significantly, but it does not automatically overcome a much higher starting dividend yield.
The outcome depends on both variables: where the dividend yield begins and how quickly the dividend grows afterward.
For investors building toward a future income target, these differences can influence how they balance immediate income requirements against long-term dividend growth opportunities.
Importantly, these projections are hypothetical illustrations based on historical growth rates, not forecasts. Companies may increase, reduce, or suspend dividend payments, and historical growth patterns may not continue.
Final Takeaway
This pharmaceutical and biotechnology battle highlights the difference between historical investment performance, current dividend income, and potential future income growth.
Eli Lilly is the clear historical winner, leading all three categories with a ten-year dividend CAGR of 11.69%, a yield on cost reaching approximately 8.28%, and a price return exceeding 1,500%.
Yet the present-day income comparison tells a different story.
Amgen requires approximately $587,000 to generate $1,000 per month in after-tax dividends, while Eli Lilly requires roughly $2.46 million for the same income goal.
And when historical dividend growth rates are extended into a twenty-year projection, Eli Lilly's faster growth still does not overcome Amgen's starting yield advantage within the modeled period.
The strongest historical performer is not necessarily the most capital-efficient choice for current dividend income.
Merck and Gilead provide additional alternatives, each with its own balance of business exposure, dividend growth, and starting income potential.
Ultimately, the right approach depends on an investor's priorities: maximizing present income, seeking long-term dividend growth, pursuing capital appreciation, or balancing these objectives within a diversified portfolio.
Historical results and hypothetical projections are useful analytical tools, but neither guarantees future investment performance.
This analysis is for educational and informational purposes only and does not constitute financial advice.