High Dividend Yield vs Dividend Growth: 8 Years of Income
Dividend investors face a familiar trade-off: start with a higher yield today, or accept less income initially in exchange for faster dividend growth?
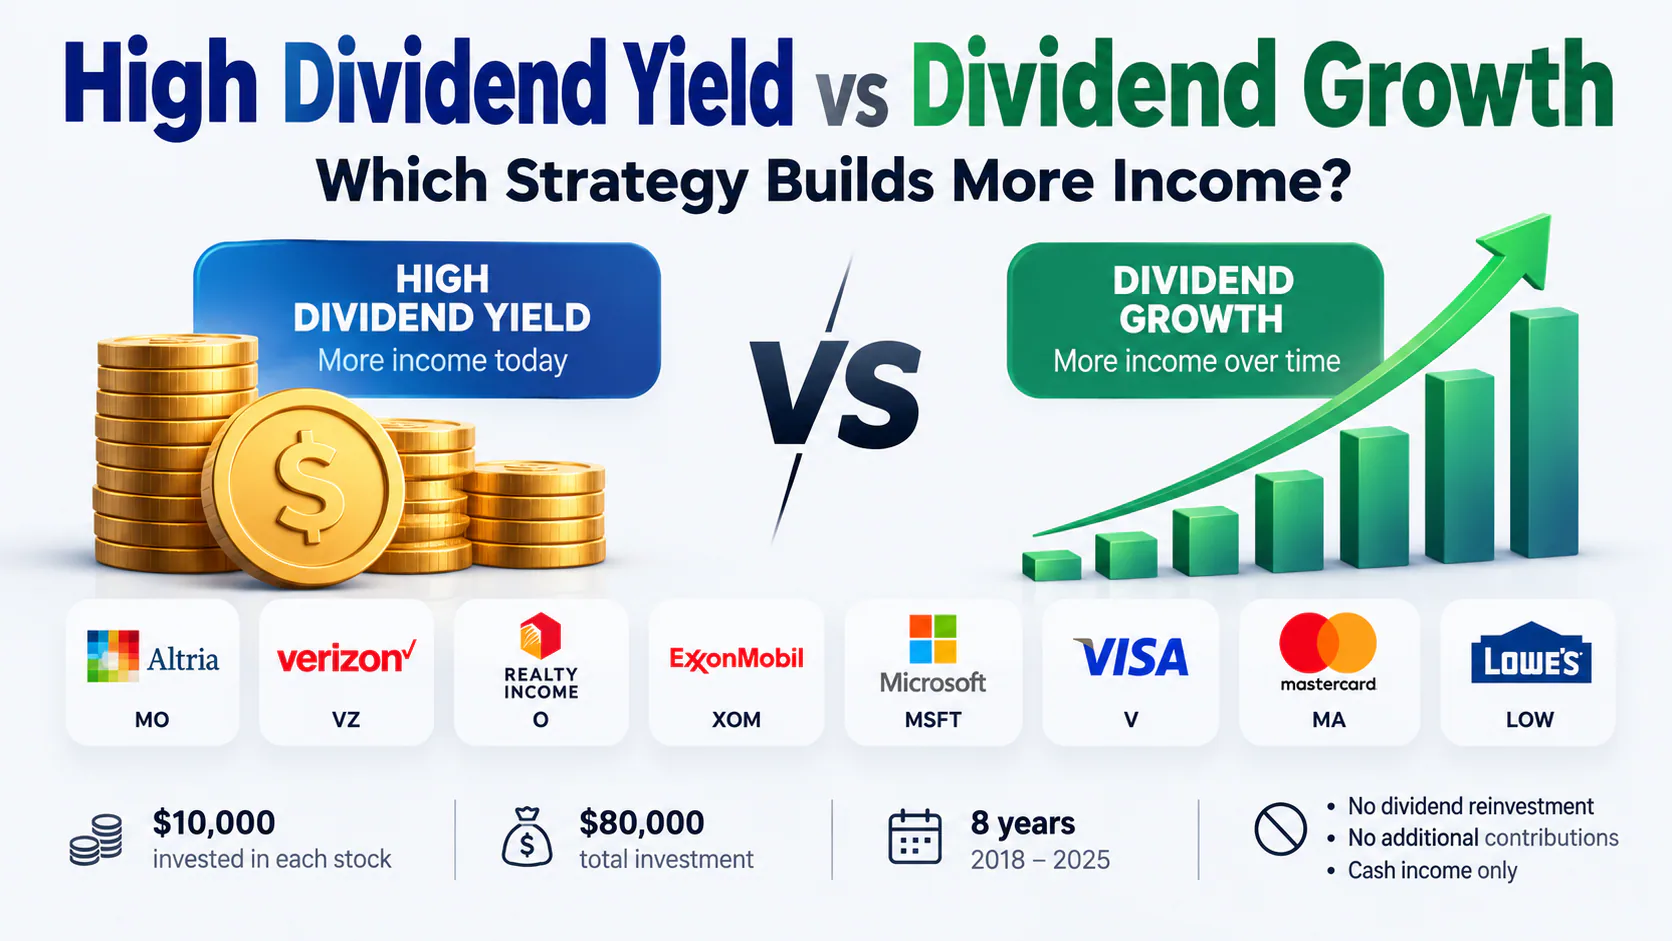
This analysis compares eight dividend-paying companies from 2018 through 2025: Altria (MO), Verizon (VZ), Realty Income (O), Exxon Mobil (XOM), Microsoft (MSFT), Visa (V), Mastercard (MA), and Lowe's (LOW).
We assume $10,000 invested in each stock at the end of 2017, for an $80,000 portfolio. With no dividend reinvestment or additional contributions, the comparison isolates how income from the original shares changed over eight years.
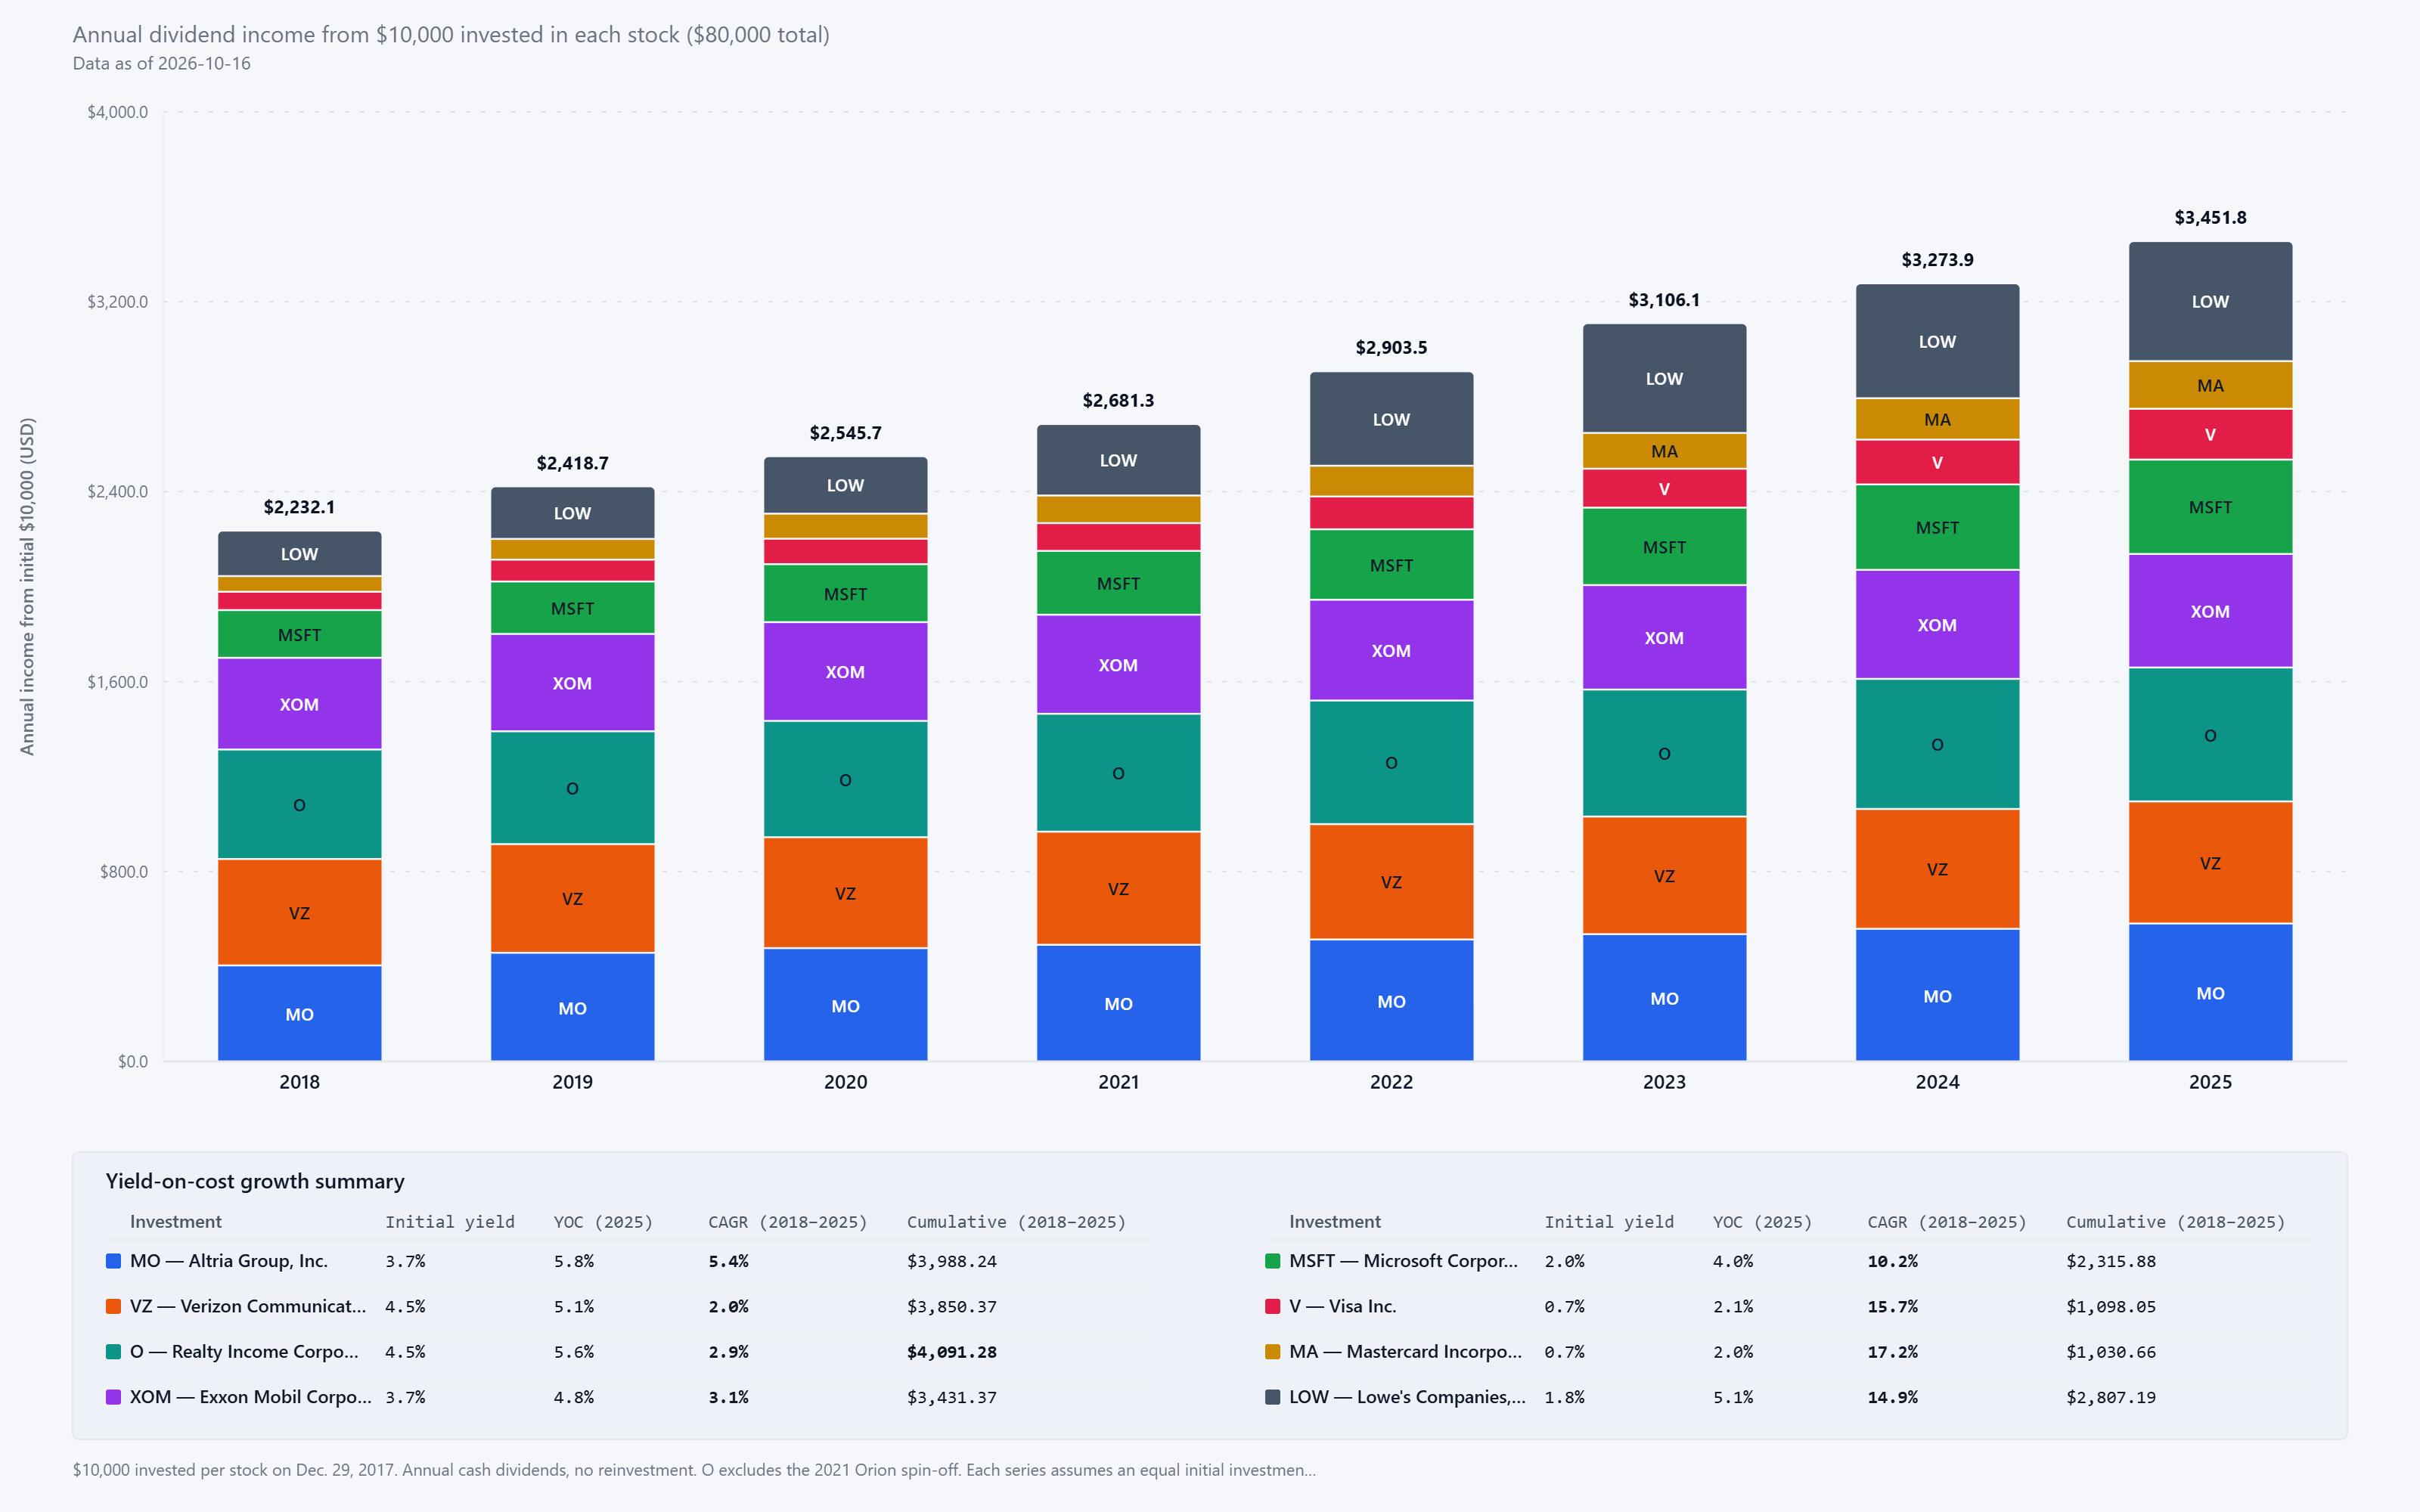
The stacked chart tracks annual cash dividends from all eight investments, with each color representing a different company.
In 2018, the portfolio generated approximately $2,232 in annual dividends. By 2025, that income had increased to approximately $3,452, a gain of nearly 55% without investing another dollar.
But the more interesting story is how differently those dividends grew.
High Starting Yield: The Early Advantage
Altria, Verizon, Realty Income, and Exxon Mobil began with relatively high dividend yields, providing meaningful income from the start.
Verizon, for example, started with a 4.5% yield but delivered only 2.0% annualized dividend growth over the comparison period. By 2025, its yield on cost had reached approximately 5.1%.
These higher starting yields created an immediate income advantage, even when dividend growth was relatively modest.
Dividend Growth: Closing the Gap
Lowe's provides a contrasting example.
Starting with a yield of just 1.8%, Lowe's delivered approximately 14.9% annualized dividend growth. By 2025, its yield on cost had climbed to 5.1%, nearly matching Verizon.
Visa and Mastercard started with yields below 1%, but their annualized dividend growth rates reached approximately 15.7% and 17.2%, respectively.
Microsoft also demonstrated strong income growth, averaging approximately 10.2% annually.
These companies began with smaller dividend payments, but faster growth helped narrow the annual income gap over time.
Annual Income vs. Cumulative Dividends
One important distinction is that catching up in annual income doesn't mean catching up in total cash collected.
Realty Income generated approximately $4,091 in cumulative dividends over the eight years, compared with just $1,098 from Visa.
Despite Visa's much faster dividend growth, Realty Income delivered substantially more cash income throughout the period.
This highlights the advantage of receiving larger dividends earlier: those payments accumulate while lower-yielding investments are still growing their distributions.
What This Comparison Doesn't Show
The chart measures dividend income, not total investment returns.
Share-price appreciation, dividend reinvestment, taxes, and inflation are excluded. Realty Income's 2021 Orion spin-off is also excluded.
Including capital appreciation could produce a very different ranking, particularly for companies such as Microsoft, Visa, and Mastercard.
A higher cumulative dividend total does not necessarily mean a better overall investment outcome.
Final Takeaway
High starting yields provide income immediately, while faster dividend growth can gradually close the gap.
But catching up in annual income and catching up in cumulative income are two different milestones.
The right balance depends on how much income an investor needs today, how quickly they want that income to grow, and how long they're willing to wait.
Explore more dividend income comparisons and interactive visualizations at DividendXray.