ENB vs TRP vs EPD vs ET: 10-Year Dividend & Income Battle
Portfolio Overview
In this DividendXray battle, we compare four major North American energy infrastructure companies across dividend growth, yield-on-cost expansion, and price return over a ten-year period. We then shift from historical performance to today's income potential before looking at how yield on cost could evolve in the future.
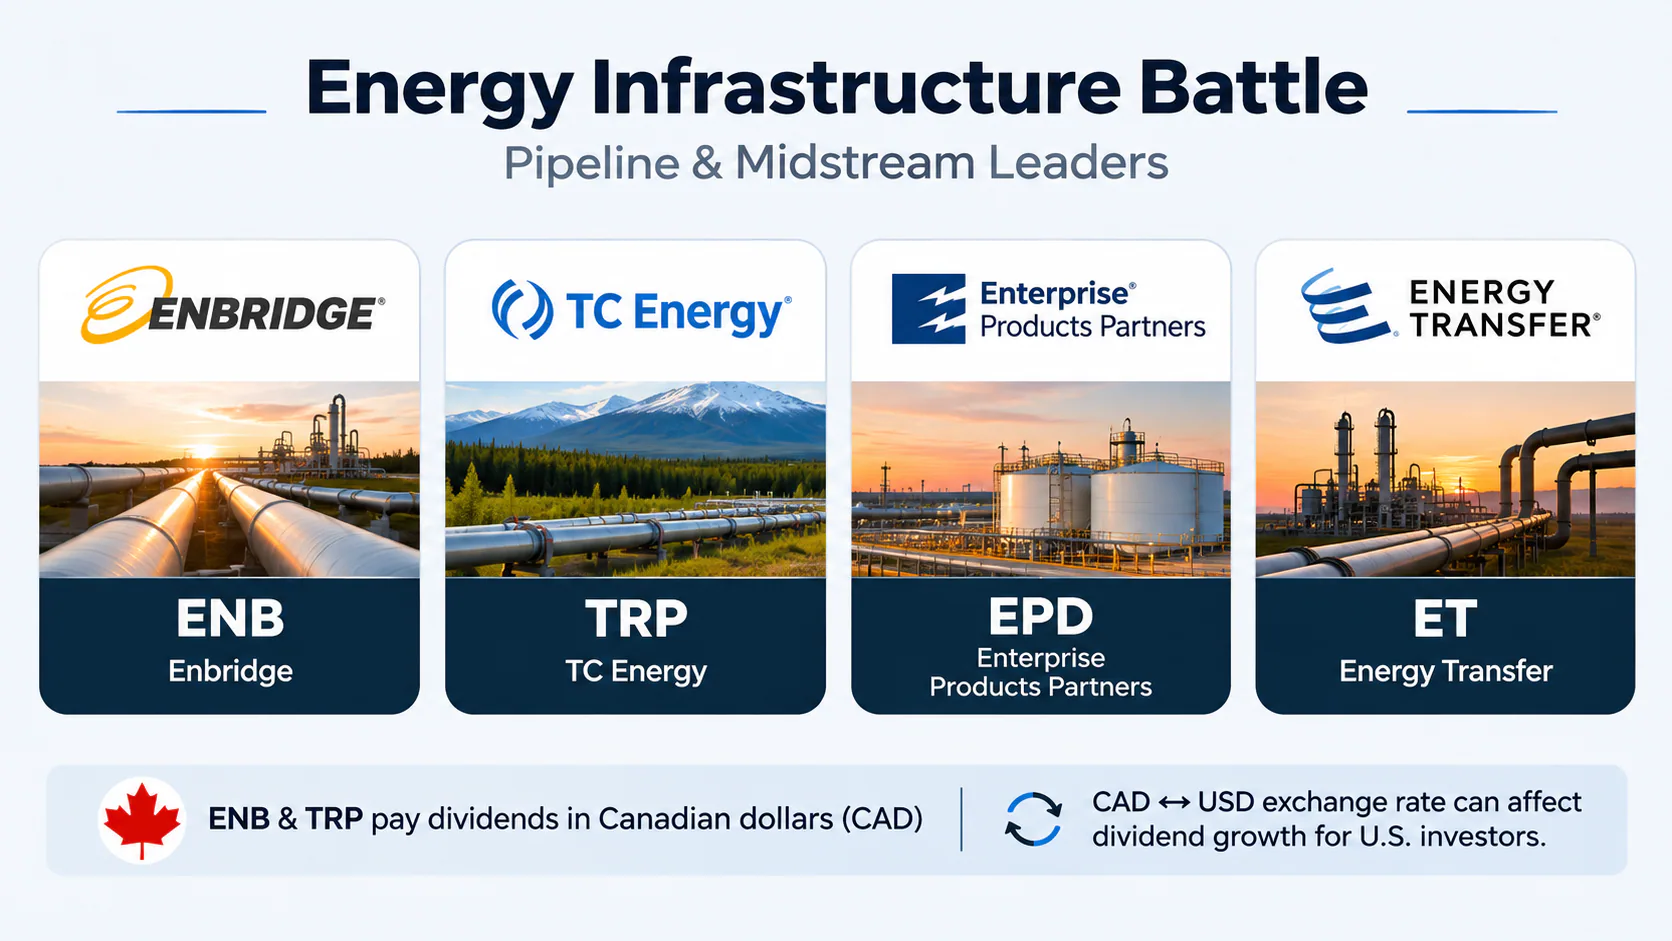
- Enbridge (ENB) is one of North America's largest pipeline and energy infrastructure companies, known for its high dividend yield.
- TC Energy (TRP) operates major natural gas and energy infrastructure networks across North America.
- Enterprise Products Partners (EPD) is a large midstream partnership focused on pipelines, storage, and processing, with a long history of distribution growth.
- Energy Transfer (ET) operates an extensive energy infrastructure network, combining a high yield with broad exposure to U.S. energy markets.
One important consideration is currency. ENB and TRP pay their dividends in Canadian dollars, so changes in the CAD-to-USD exchange rate can affect the dividend growth experienced by a U.S. investor.
Each company provides exposure to energy infrastructure, but differences in starting yield, dividend growth, and historical price performance create very different outcomes for income-focused investors.
Category Winners
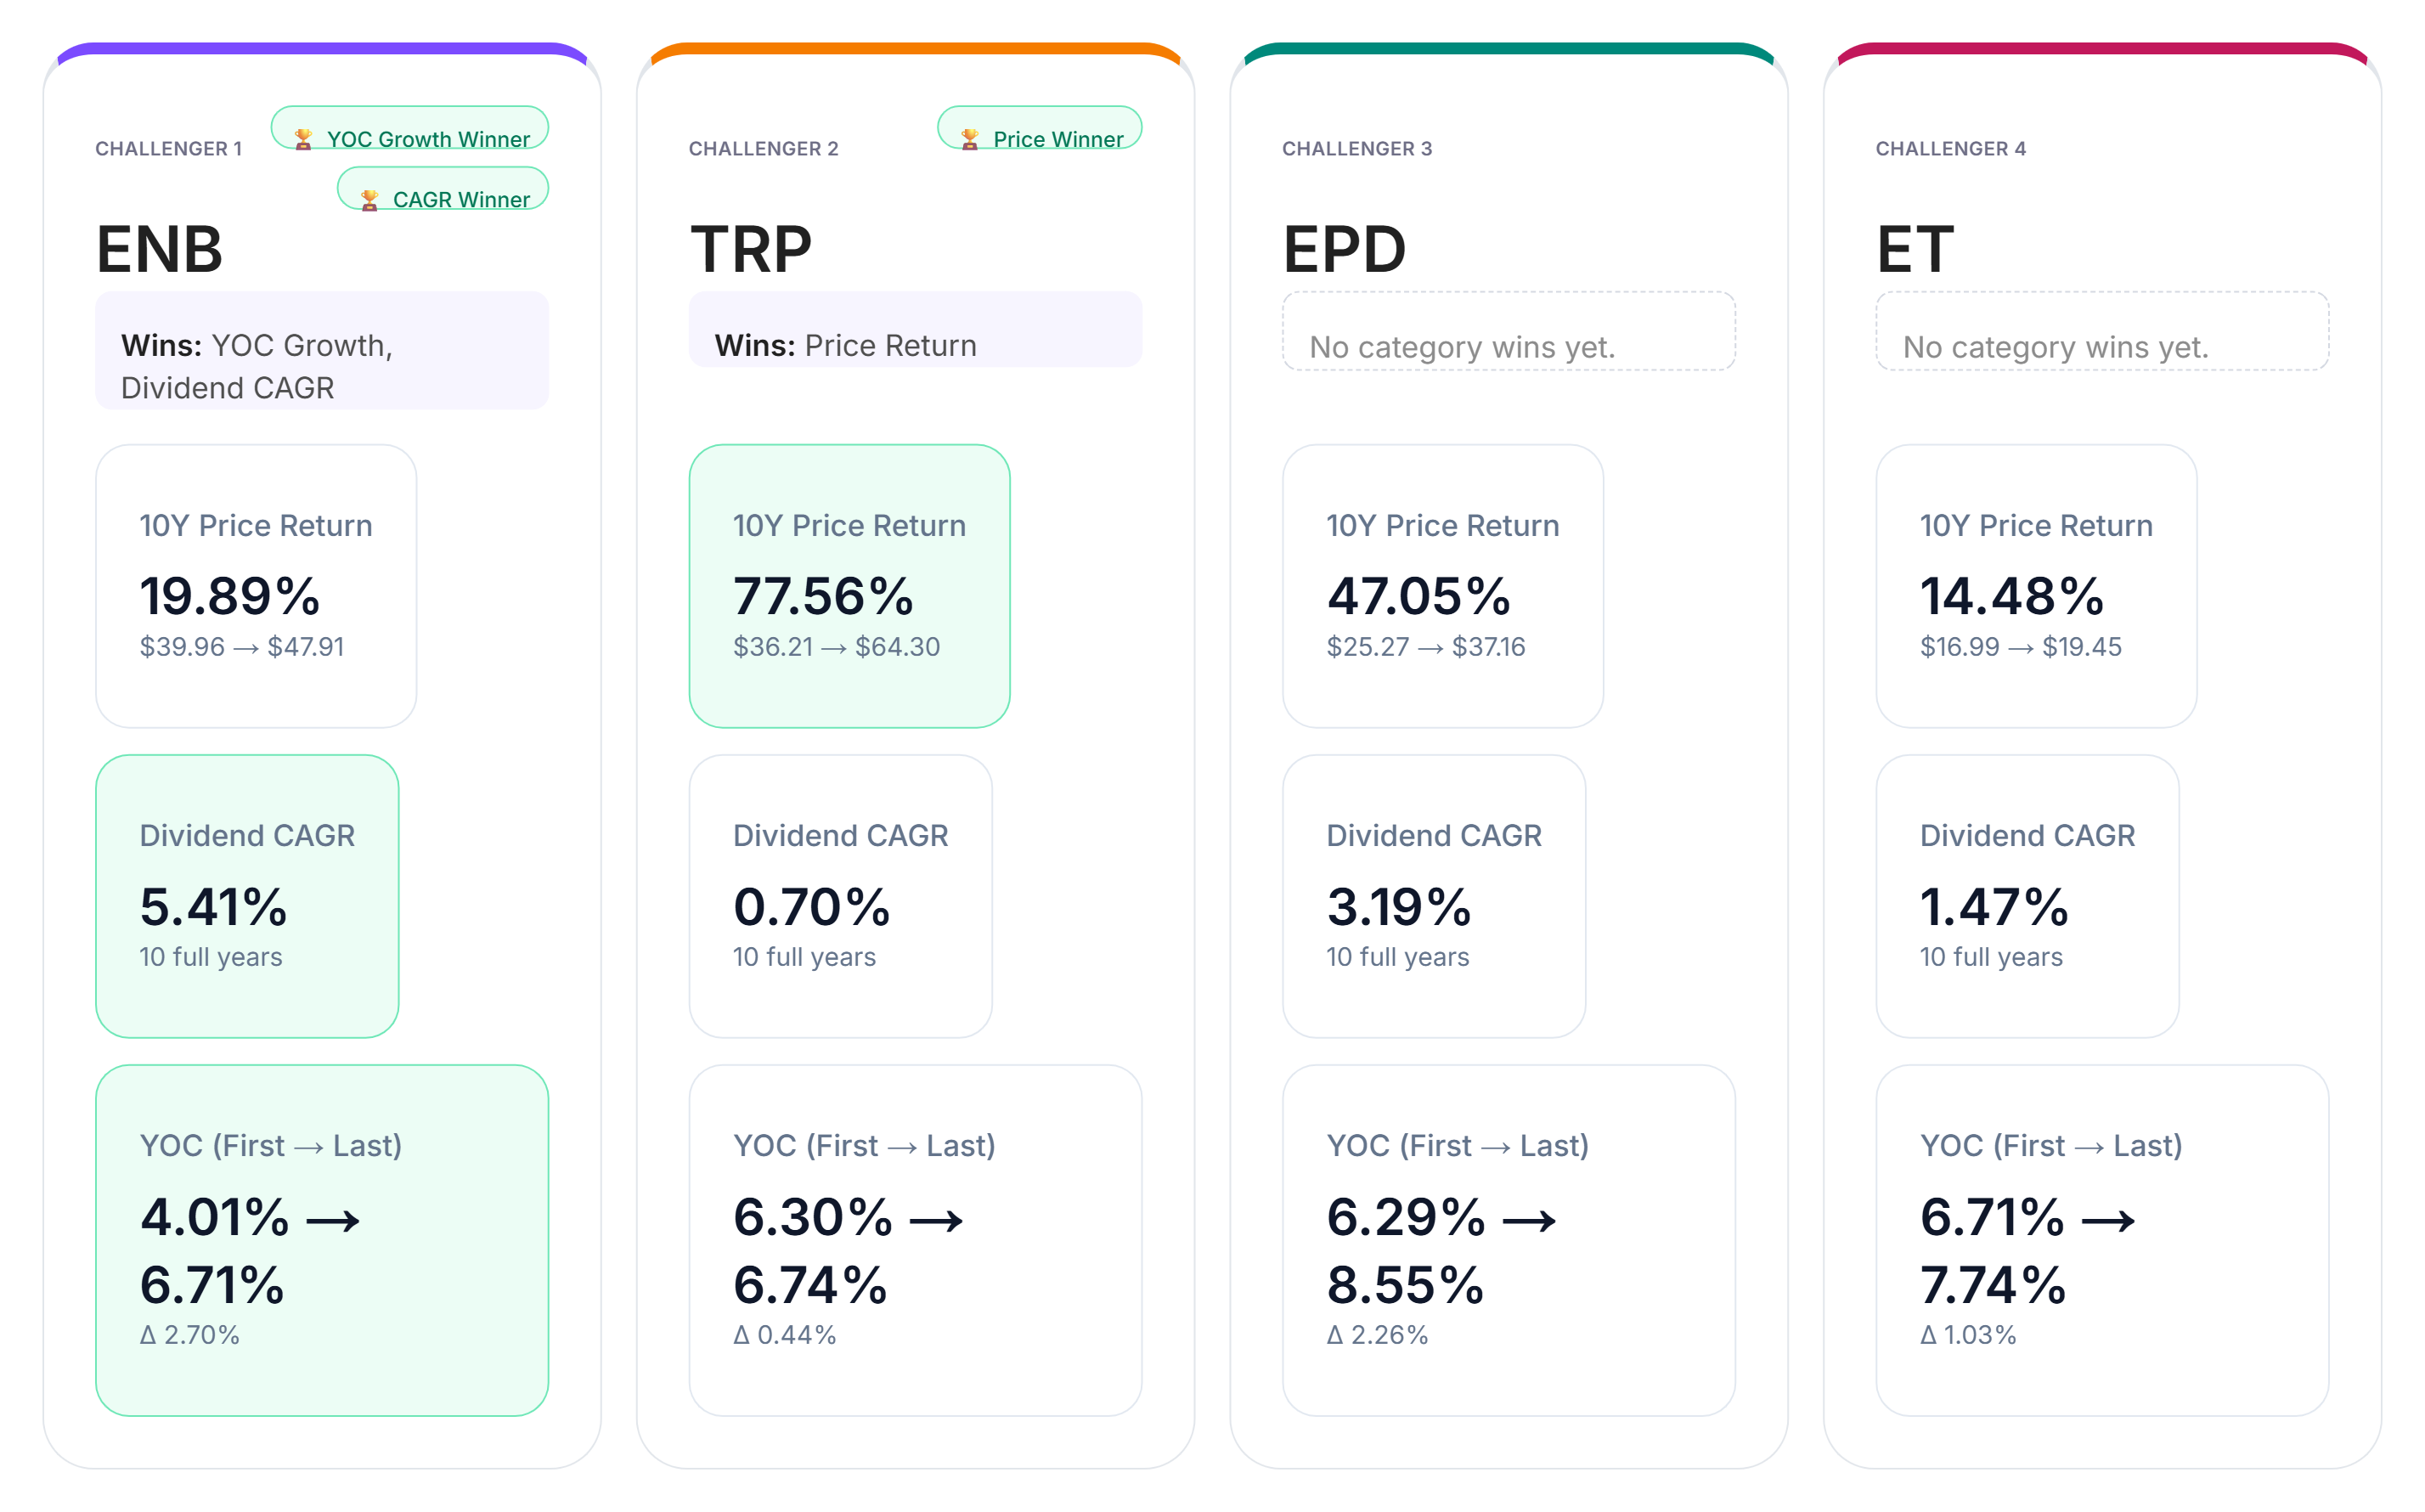
Looking at the ten-year results across dividend growth, yield-on-cost improvement, and price return, different leaders emerge depending on the metric.
In dividend growth, ENB leads the group with a ten-year dividend CAGR of 5.41%.
For yield-on-cost growth, ENB again takes the category win, showing the strongest improvement from the first year to the last.
In price return, however, TRP comes out ahead with a ten-year gain of 77.56%.
The results show why comparing these companies on a single metric can miss part of the story. Historical dividend growth, income efficiency, and share-price performance can point to different winners.
Yield-on-Cost by Year
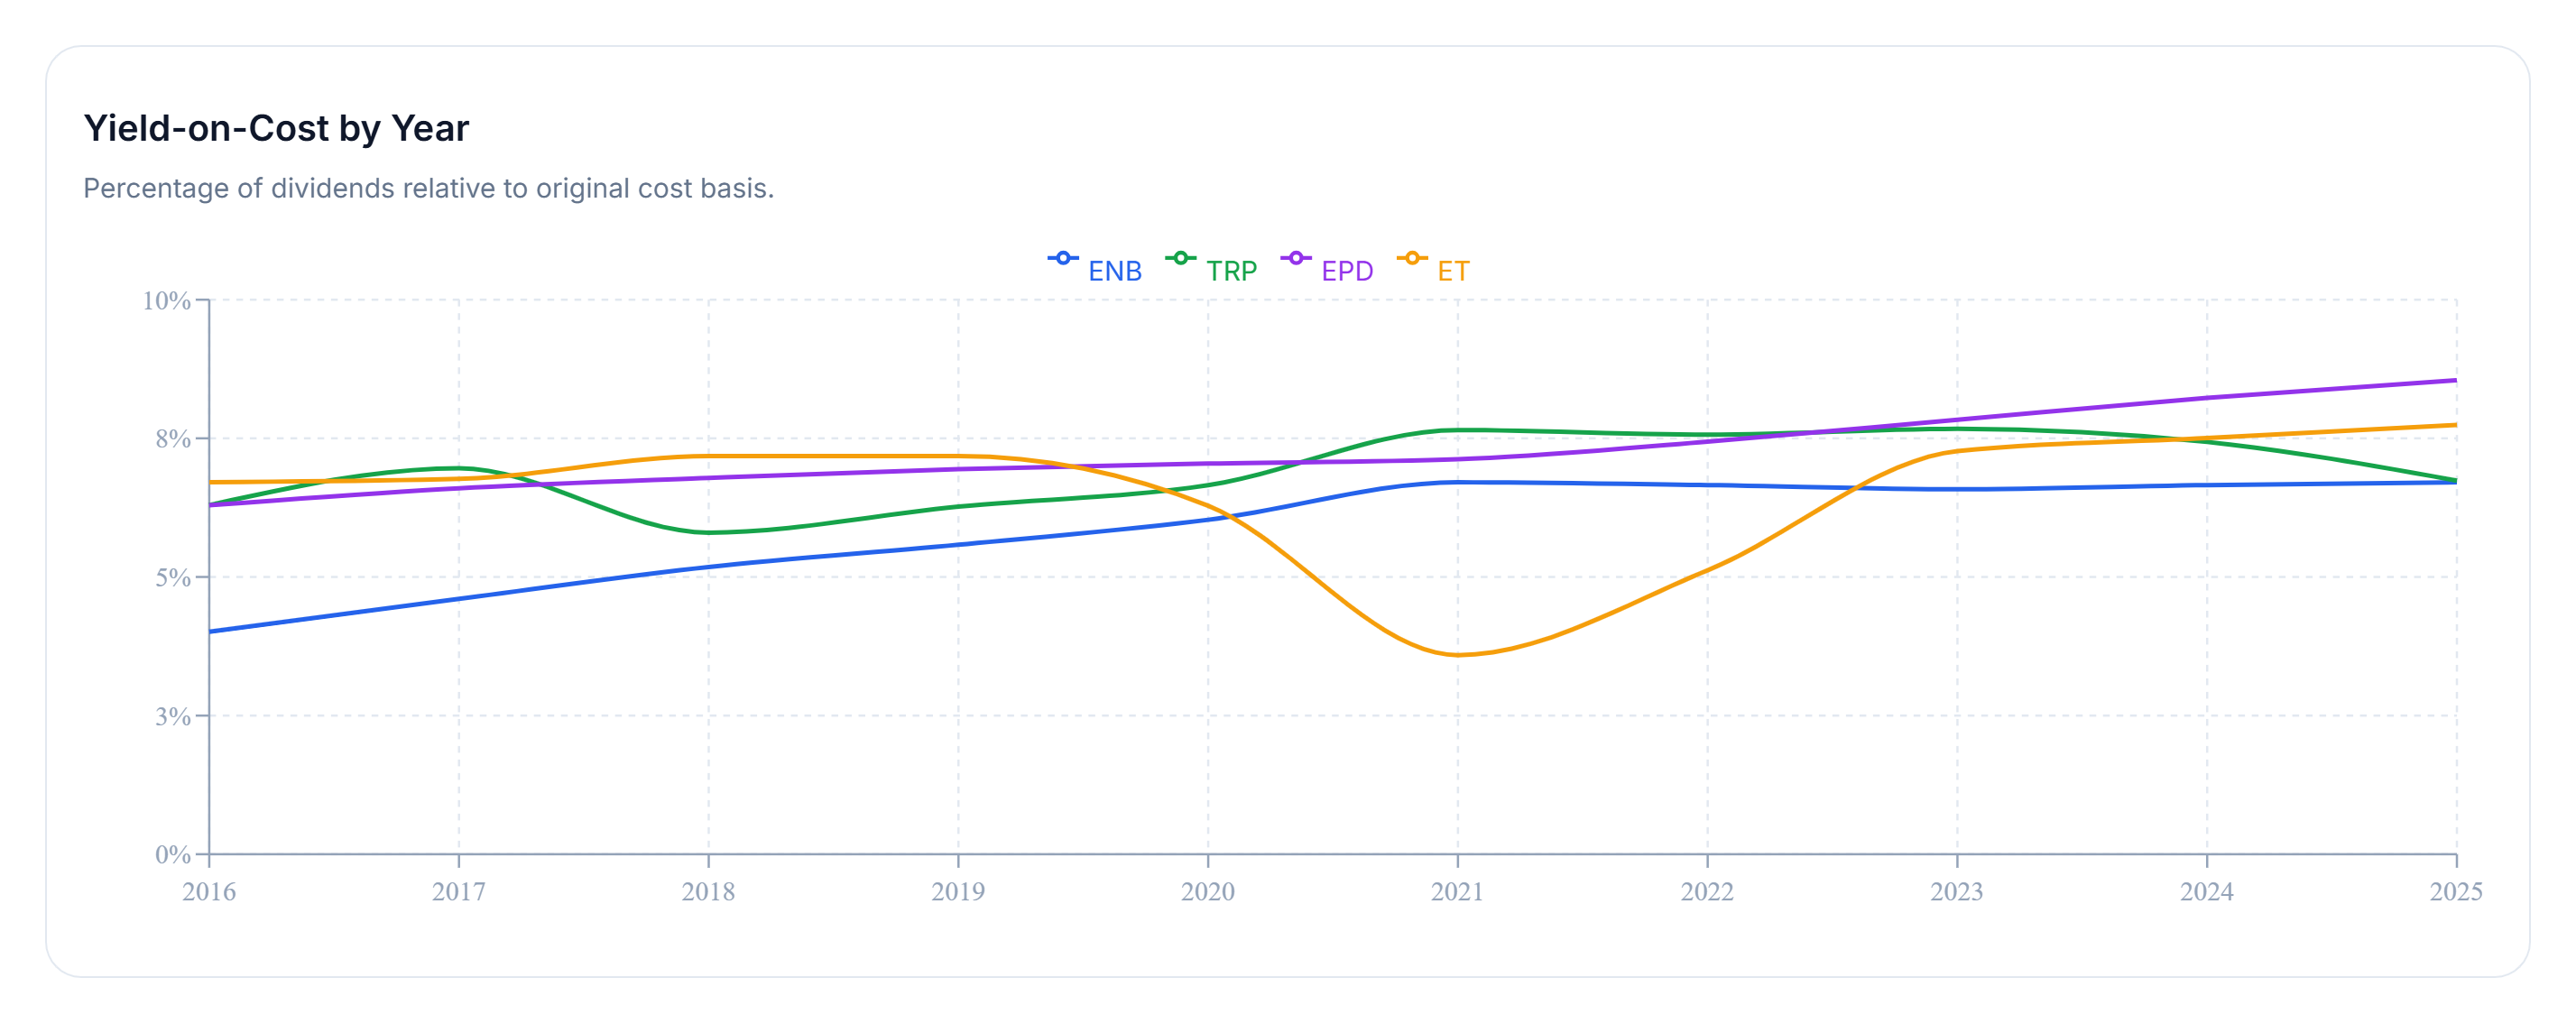
Yield on cost measures the dividend income generated relative to the original investment rather than the holding's current market price.
Across the ten-year period, EPD stands out for income efficiency, reaching approximately 8.55% yield on cost by the end of the window.
This adds another dimension to the category results. ENB records the strongest improvement in yield on cost from the first year to the last, while EPD finishes the period at about 8.55%.
For an income investor, this distinction matters. Yield on cost helps illustrate what happened to the income generated by the original capital as distributions changed over time.
Now let's shift from historical performance to today's income picture.
Income Goal Comparison
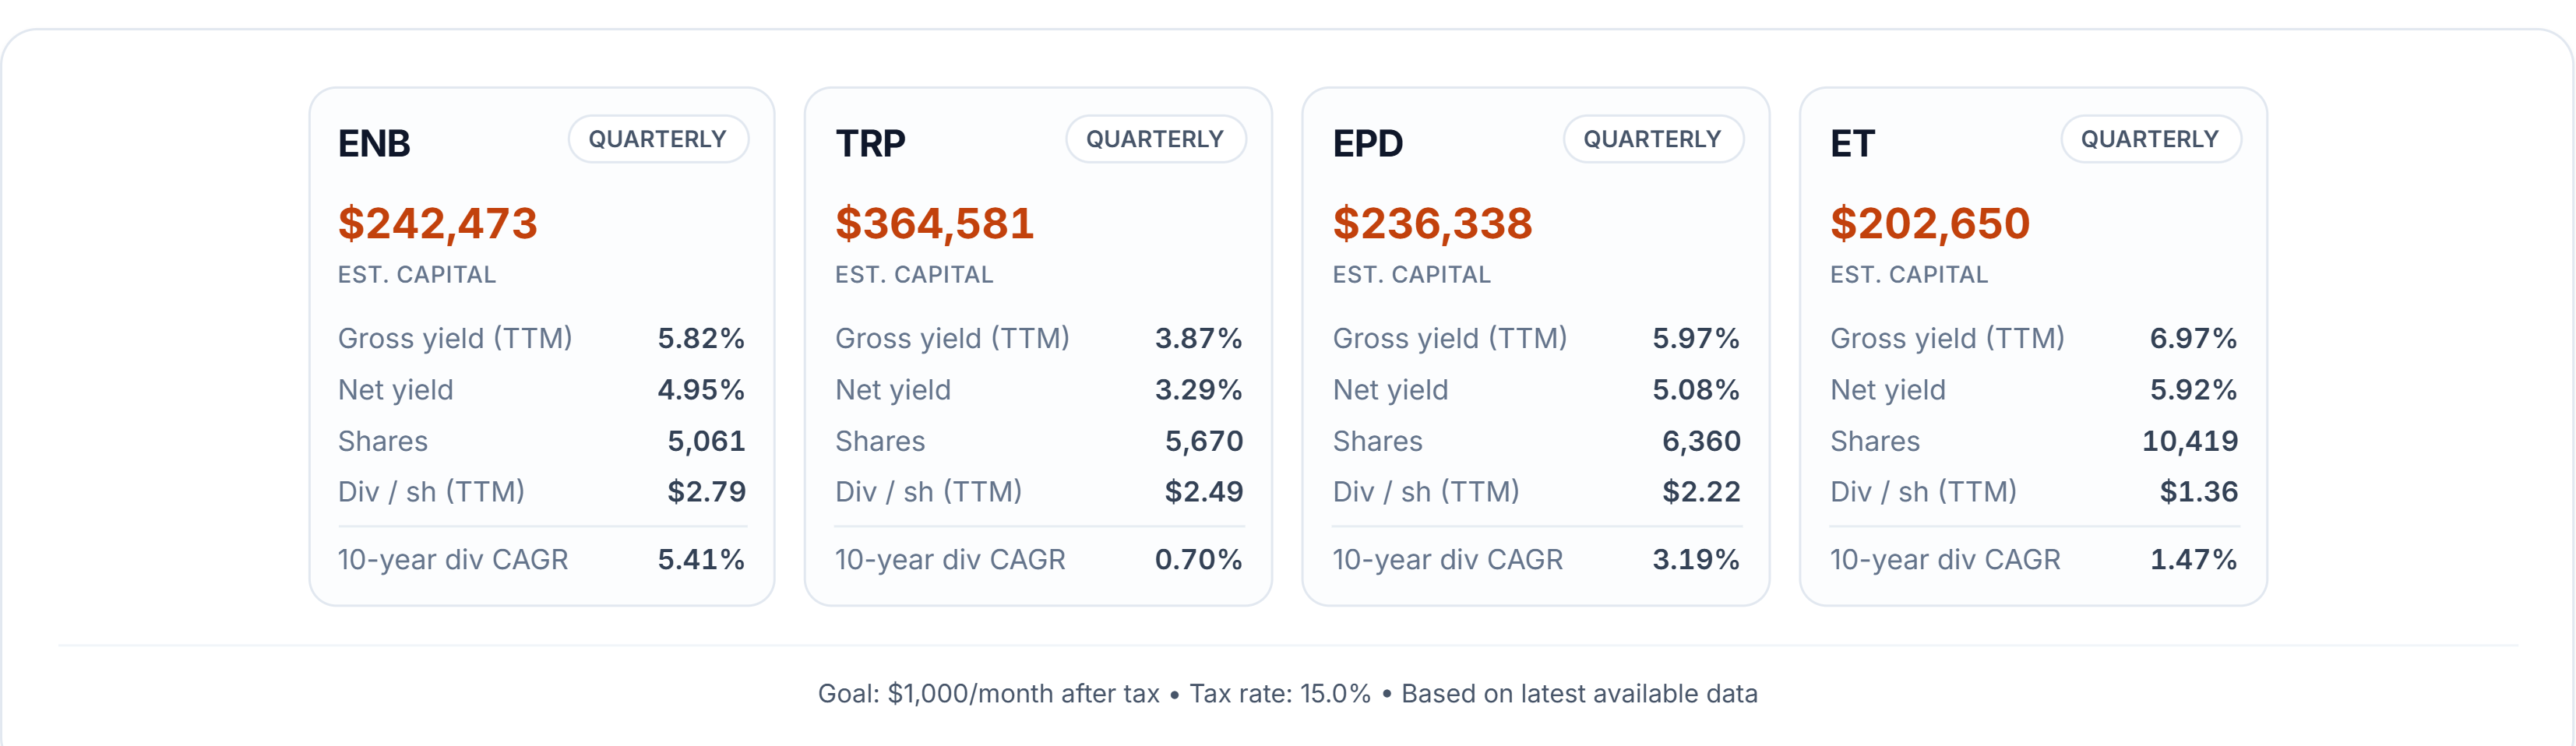
How much capital would each holding require today to generate $1,000 per month after tax?
Using a 15% tax assumption, ET requires the least capital of the four at roughly $202,650, supported by a current yield near 7%.
At the other end of the comparison, TRP requires the most capital at approximately $364,581, with a current yield near 3.9%.
ENB and EPD fall between those two extremes.
This highlights the immediate advantage of a higher starting yield when the objective is current income. A higher yield can reduce the amount of capital required to reach a specific income target today.
But today's yield is only one part of the equation. Dividend growth can change how much income the original investment generates in the years ahead.
Yield Catch-Up Timeline
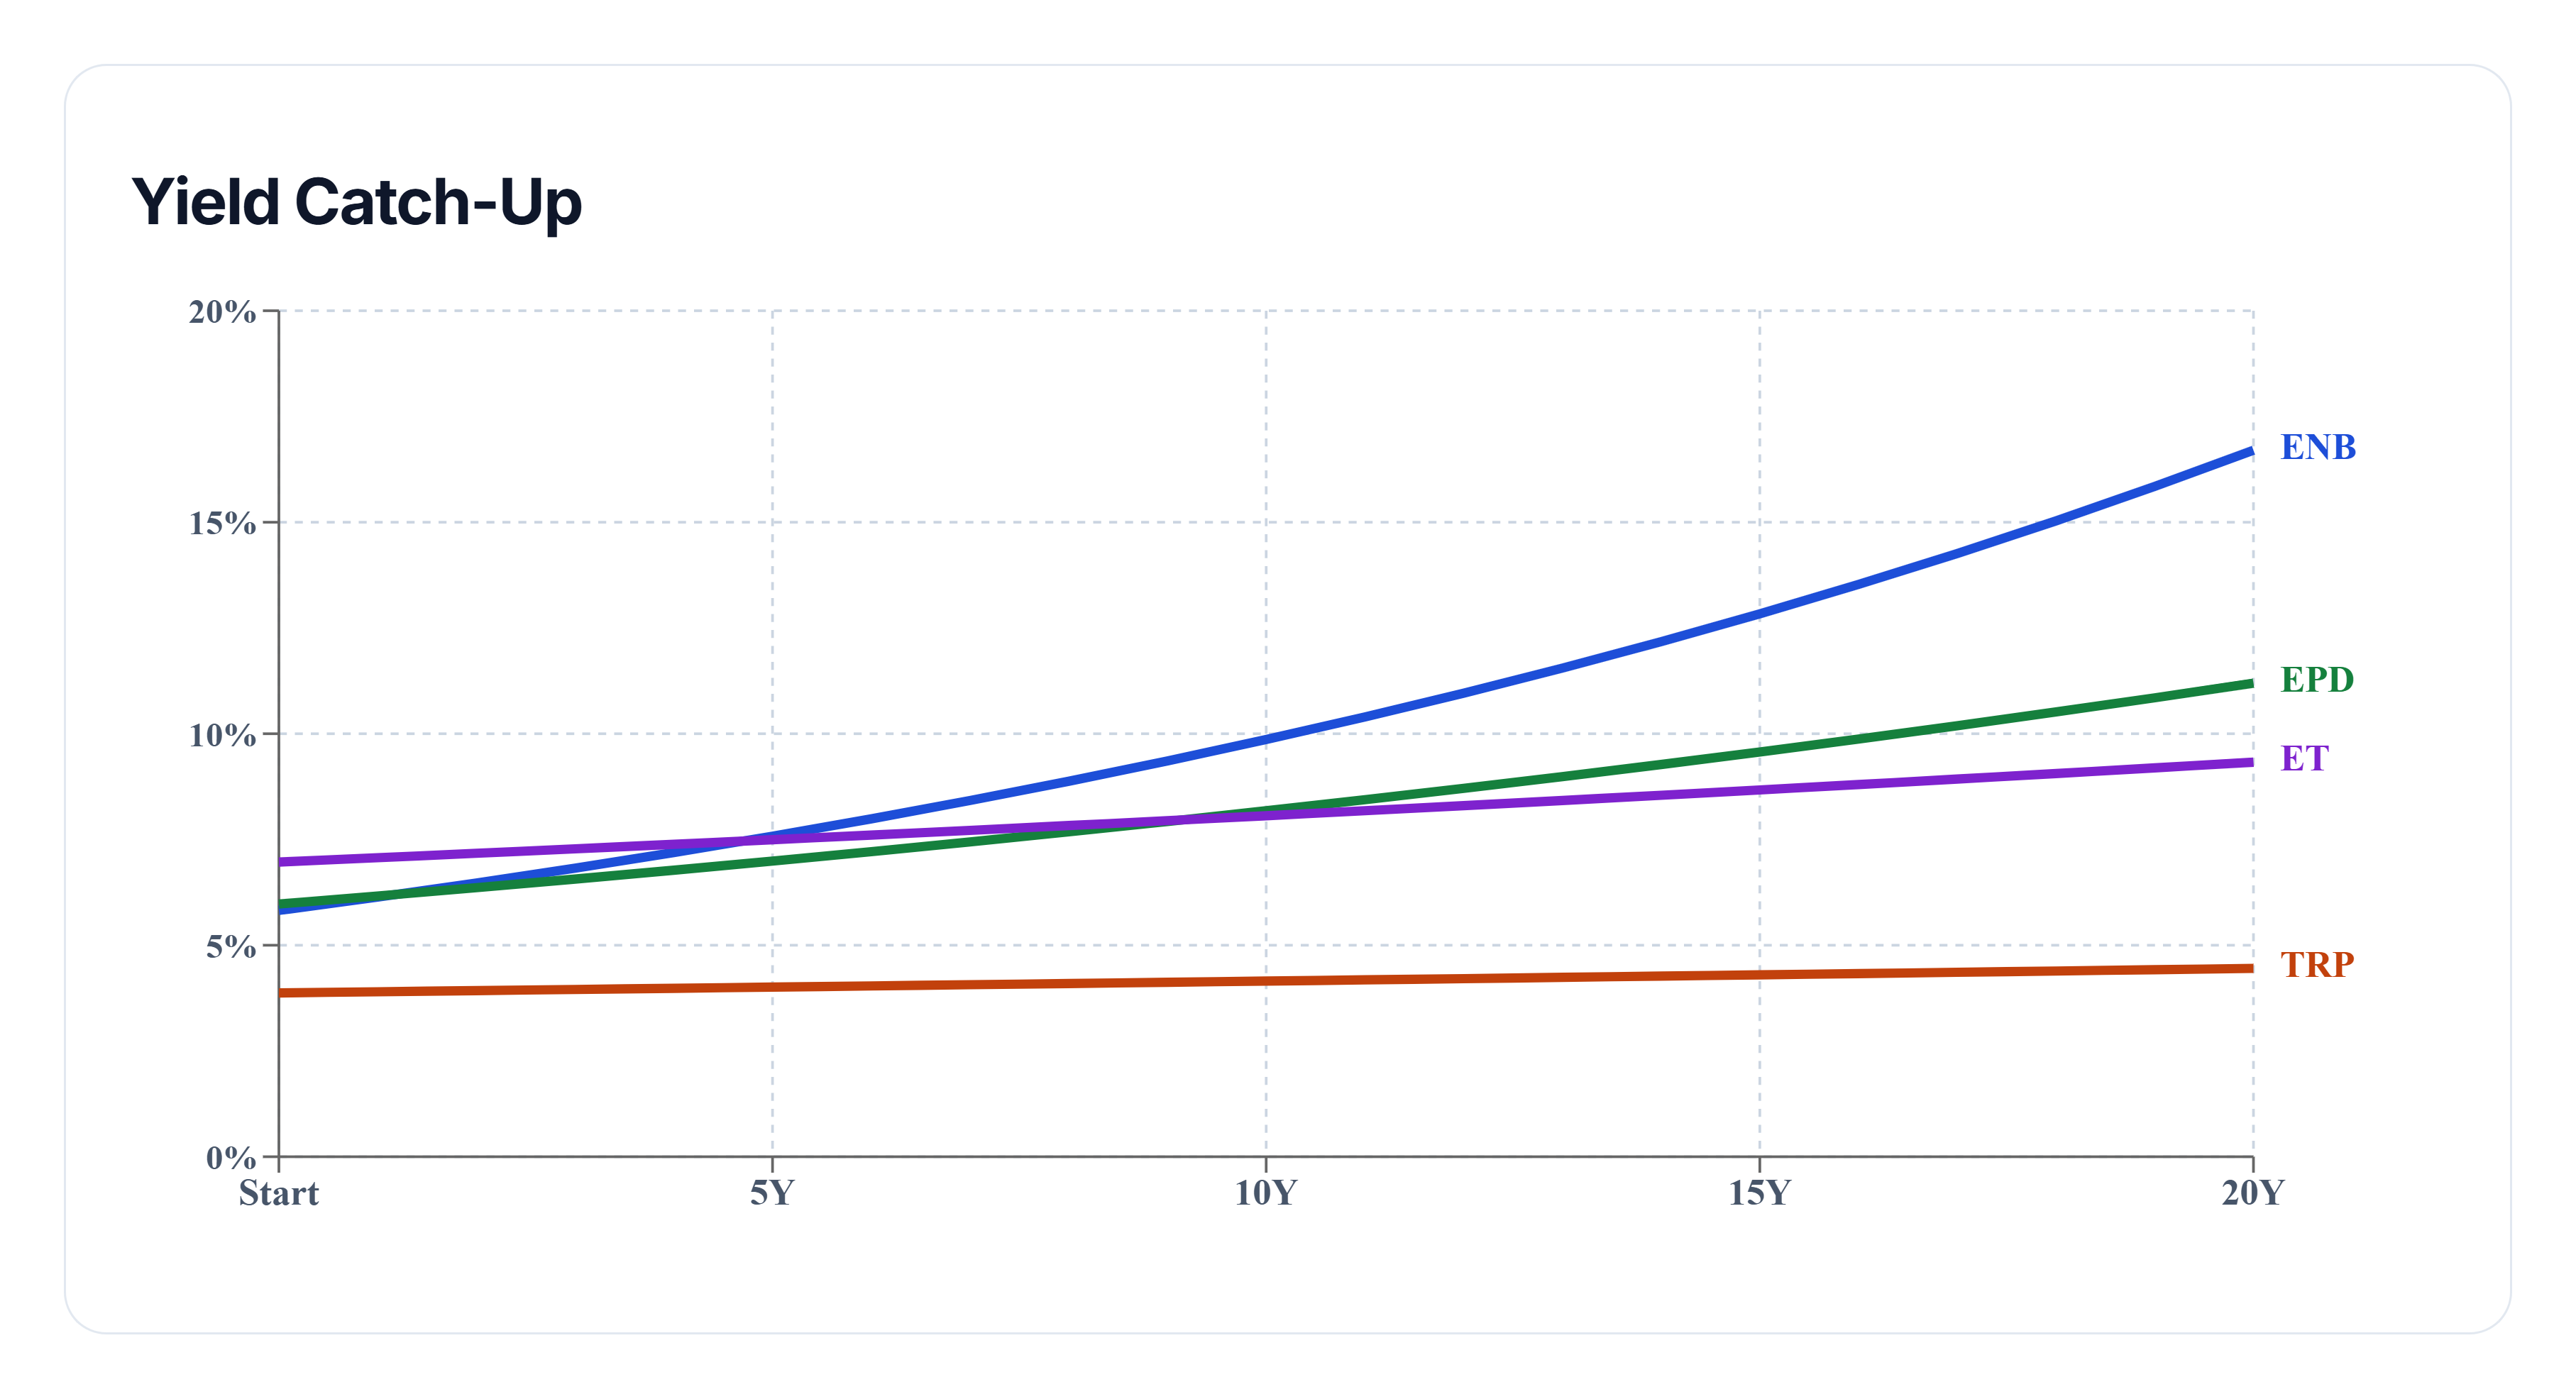
The catch-up projection shifts the comparison from today's income to how income efficiency could develop over time.
The model assumes future dividend growth continues at approximately each holding's historical ten-year dividend CAGR. This is a projection based on historical growth, not a prediction that those growth rates will continue.
ENB enters the model with the strongest historical dividend growth rate of the group at around 5.4%, while ET begins with the advantage of the highest current yield at approximately 7%. TRP starts at a current yield near 3.9%.
The key question is whether stronger dividend growth can eventually overcome the advantage of a higher starting yield.
In the modeled period, ET's starting-yield advantage proves significant. Even after 20 years, TRP still does not catch ET in projected yield on cost.
The timeline demonstrates an important tradeoff in dividend investing: stronger dividend growth can narrow an income gap over time, but a sufficiently large starting-yield advantage can take many years to overcome — and sometimes may not be overcome within the modeled period.
Final Takeaway
There is no single winner across every part of this energy infrastructure battle.
ENB leads the ten-year dividend growth comparison with a 5.41% CAGR and also records the strongest improvement in yield on cost from the first year to the last. TRP leads ten-year price return with a 77.56% gain, while EPD reaches approximately 8.55% yield on cost by the end of the historical period.
When the focus shifts from historical results to income today, ET requires the least capital — roughly $202,650 — to generate $1,000 per month after tax under the 15% tax assumption. TRP requires the most at approximately $364,581.
The future projection then adds another layer. ENB brings the strongest historical dividend growth rate into the model, while ET begins with the advantage of the highest current yield. In TRP's case, the gap is large enough that it still does not catch ET on projected yield on cost within 20 years.
Taken together, the comparison illustrates the tradeoff between starting yield, dividend growth, and the amount of capital required to generate income today. Historical performance and modeled projections cannot determine which investment will perform best in the future, but they can make those tradeoffs much easier to see.