Energy Dividend Portfolio Analysis: XOM, CVX, ENB & MPLX Income Breakdown

Portfolio Overview
This portfolio is built around large energy producers and midstream infrastructure companies designed to generate strong cash flow. It combines Exxon Mobil (XOM), Chevron (CVX), Enbridge (ENB), and MPLX (MPLX) to create a dividend income engine supported by global energy production and pipeline infrastructure.
XOM and CVX provide diversified exposure to global oil and gas markets through large integrated energy operations. ENB and MPLX strengthen the portfolio's income profile through midstream infrastructure assets, including pipelines and energy transportation networks that generate steady cash flows.
Together, these companies form a portfolio focused on high current income combined with moderate dividend growth, supported by long-term demand for global energy infrastructure.
Dividend Growth Trend
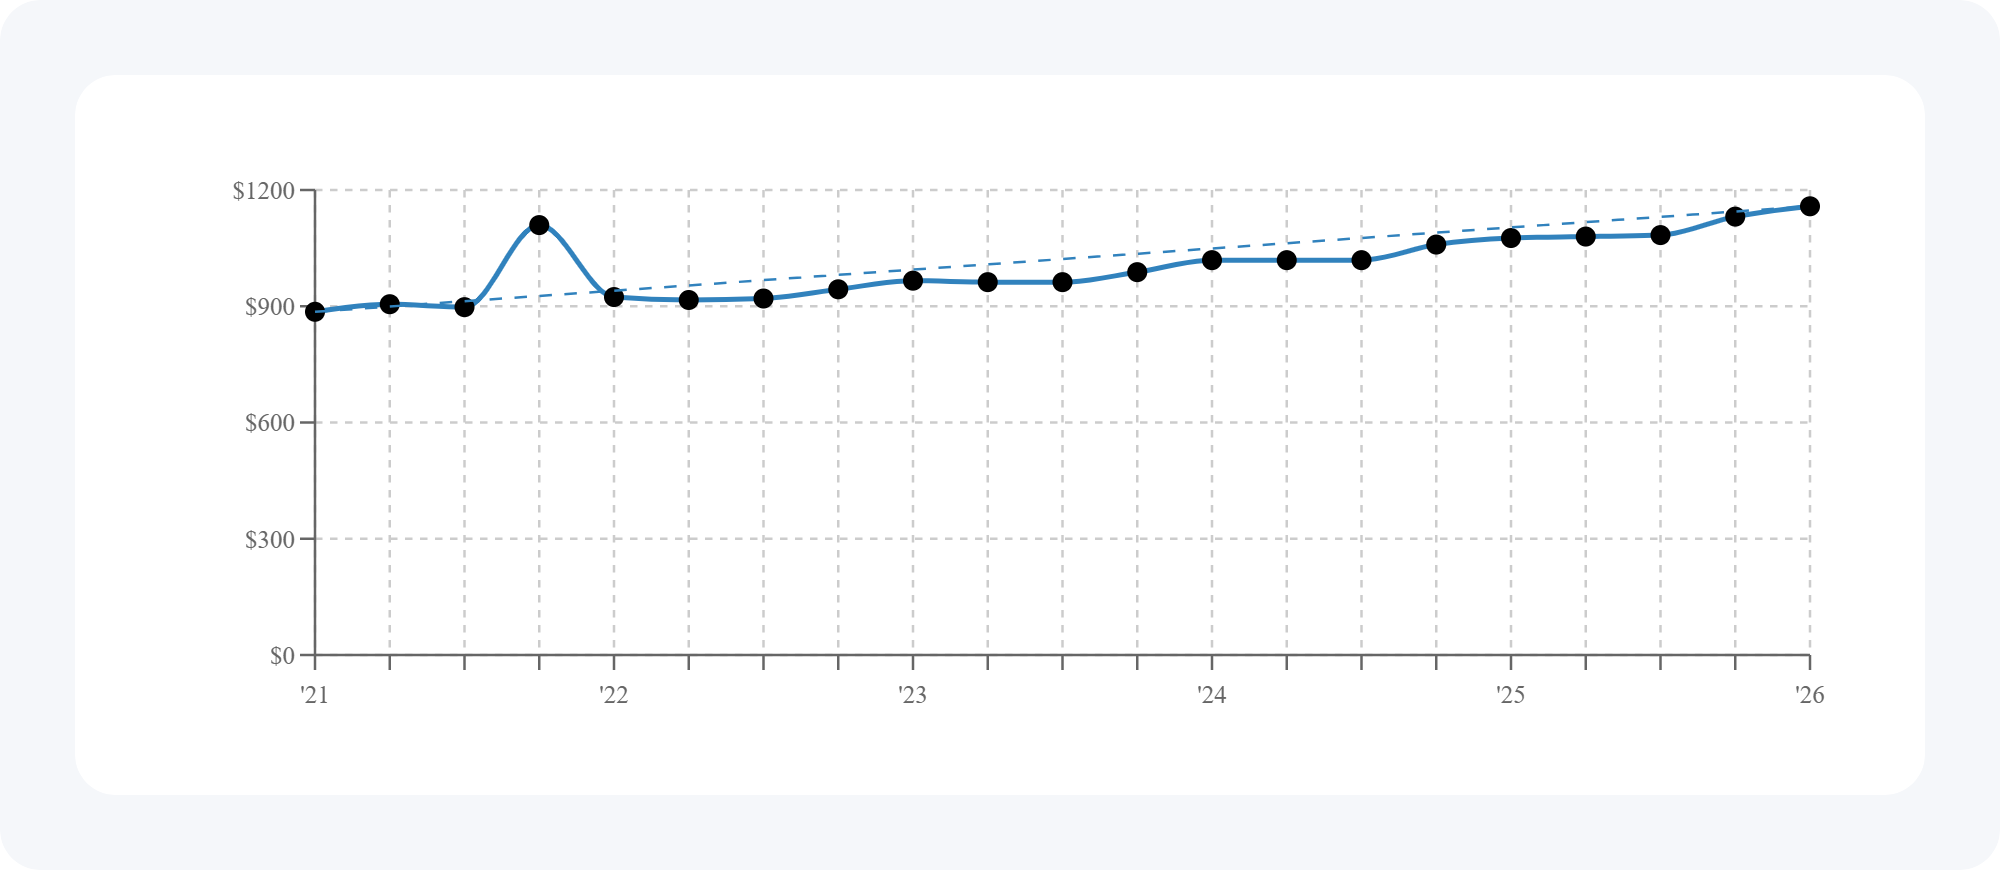
Here's the dividend growth trend for these holdings over the last five years.
The overall trend shows steady dividend growth, reflecting the strong cash flow generated by major energy producers and pipeline operators. The increase observed in 2021 is attributable to a special distribution paid by MPLX, which temporarily boosted portfolio income that year.
Even with the volatility often associated with energy markets, many large energy companies have maintained their commitment to dividend payouts, creating a relatively resilient income stream for investors.
Portfolio Snapshot

Here's the quick snapshot for this portfolio:
- Yield on cost: 4.6%
- Annual dividend income: $4,632 per year
- Monthly dividend income: about $386 per month
- Dividend income growth: roughly 5.8% per year over five years
- Average ETF expense ratio: 0% (there are no ETFs in this portfolio)
This portfolio represents a high-income dividend strategy driven by companies that generate substantial operating cash flow from energy production and transportation infrastructure.
Income Breakdown by Holding
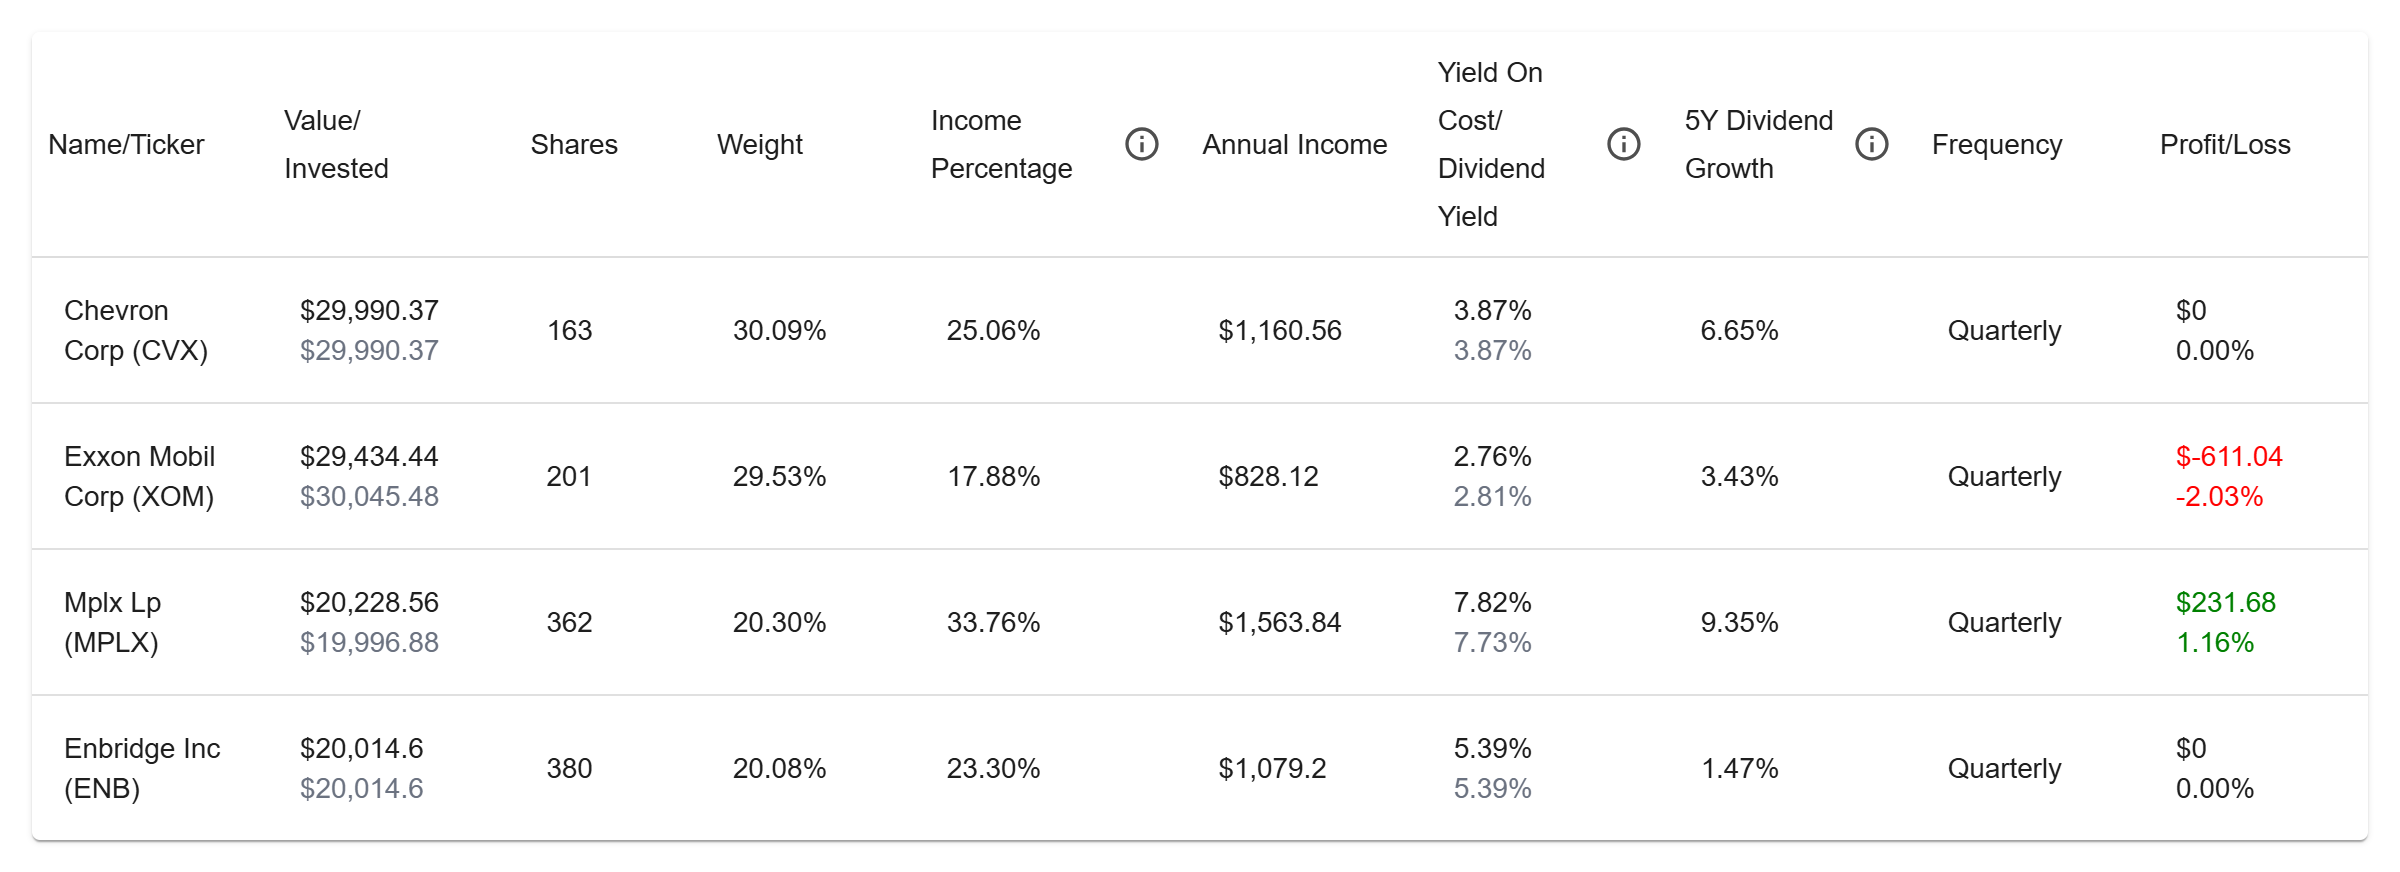
Here's how the portfolio's dividend income is split between the holdings:
- MPLX: about 33.8% of the income (roughly $1,564 per year)
- CVX: about 25.1% (about $1,161 per year)
- ENB: about 23.3% (about $1,079 per year)
- XOM: about 17.9% (about $828 per year)
All holdings pay quarterly.
5-year dividend growth rates included in this portfolio:
- MPLX: 9.3%
- CVX: 6.7%
- ENB: 1.5%
- XOM: 3.4%
This structure creates an income mix where pipeline infrastructure and integrated energy companies work together to provide both current income and gradual dividend growth.
Forward Income Outlook
If income growth continues in line with recent history, this portfolio's cash flow could rise steadily over time.
- Yield on cost may grow from 4.6% today to about 6.1% in five years
- Annual income could increase from $4,632 to roughly $6,135
- Monthly income could rise from $386 to about $511
- And this projection is described as happening without adding new capital or reinvesting dividends
This illustrates the potential compounding effect of dividend growth. Even modest annual increases in dividends can meaningfully expand a portfolio's income stream over time.