$100,000 Infrastructure Dividend Portfolio Analysis: $335 Monthly Income from KMI, WMB, EPD & TRP
Portfolio Overview
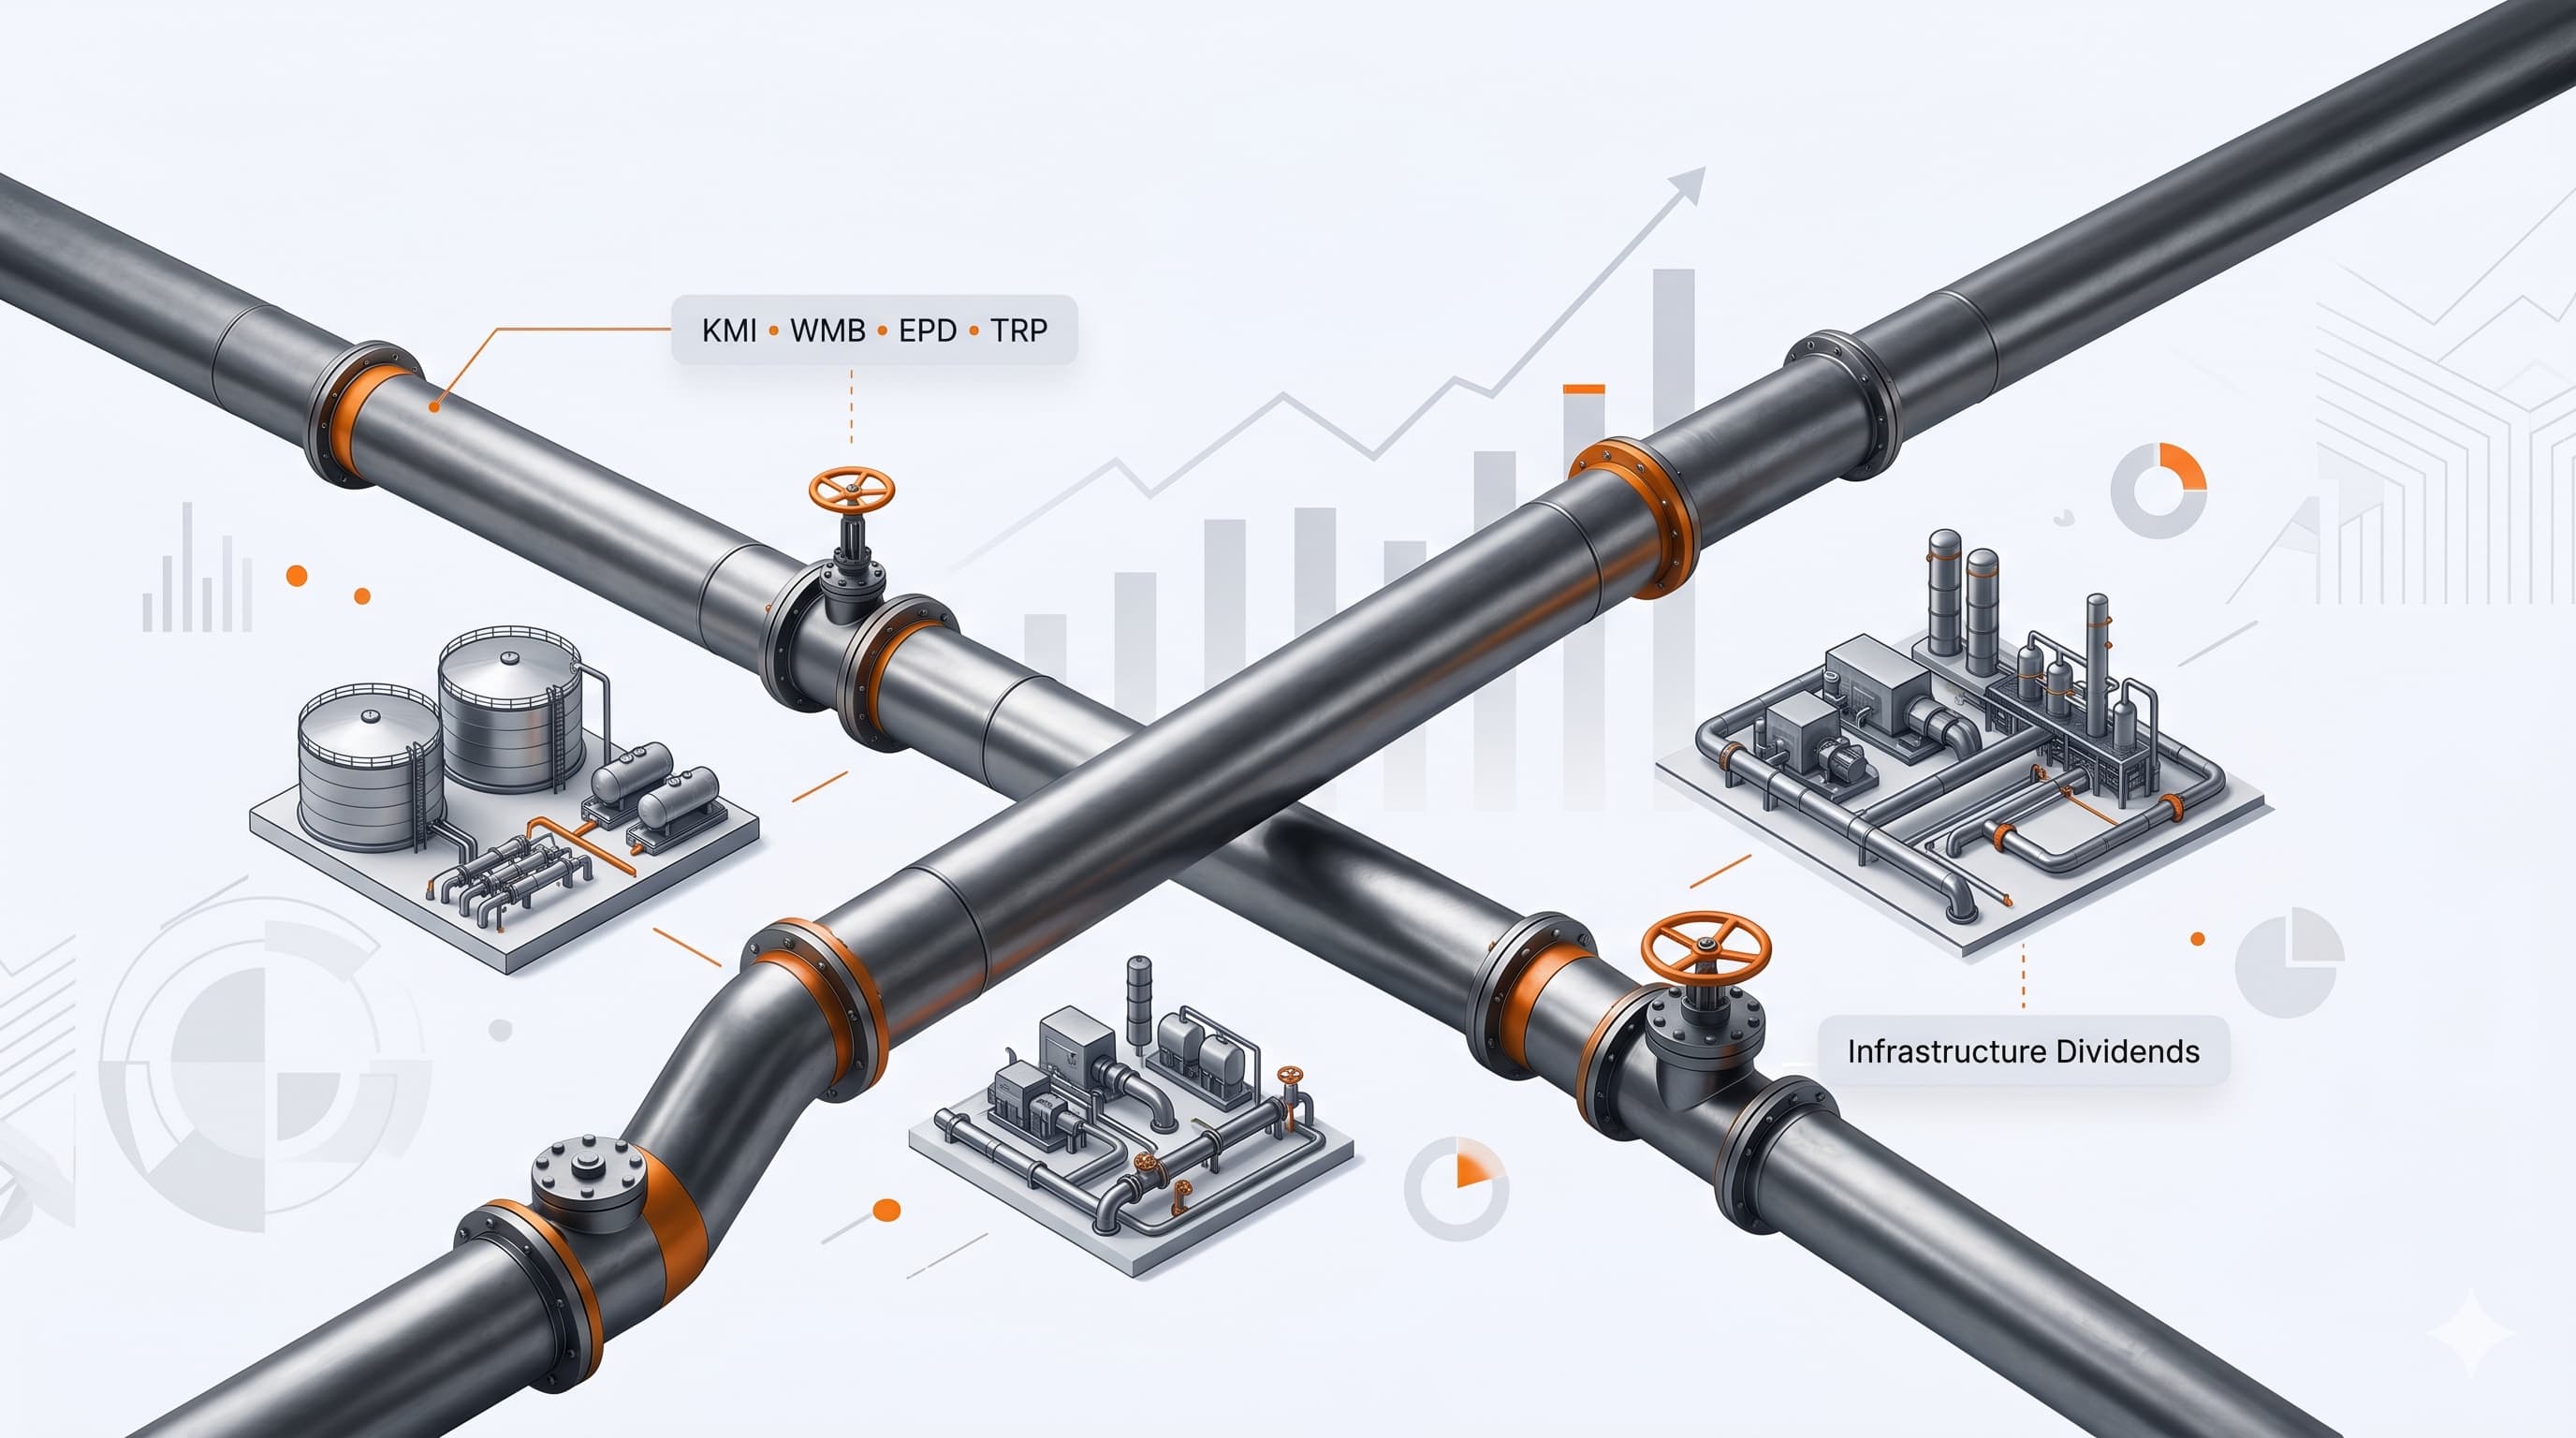
This portfolio is built around North American energy infrastructure companies designed to generate reliable cash flow. It combines Kinder Morgan (KMI), The Williams Companies (WMB), Enterprise Products Partners (EPD), and TC Energy (TRP) to provide exposure to pipelines, storage facilities, transportation networks, and utility infrastructure that help support the continent's energy needs.
KMI, WMB, and EPD provide direct exposure to the infrastructure that transports and stores oil, natural gas, and related energy products. TRP adds further diversification through its extensive pipeline and utility infrastructure network operating throughout North America. Together, these holdings are designed to deliver steady dividend income backed by long-lived infrastructure assets and essential energy networks.
Dividend Growth Trend
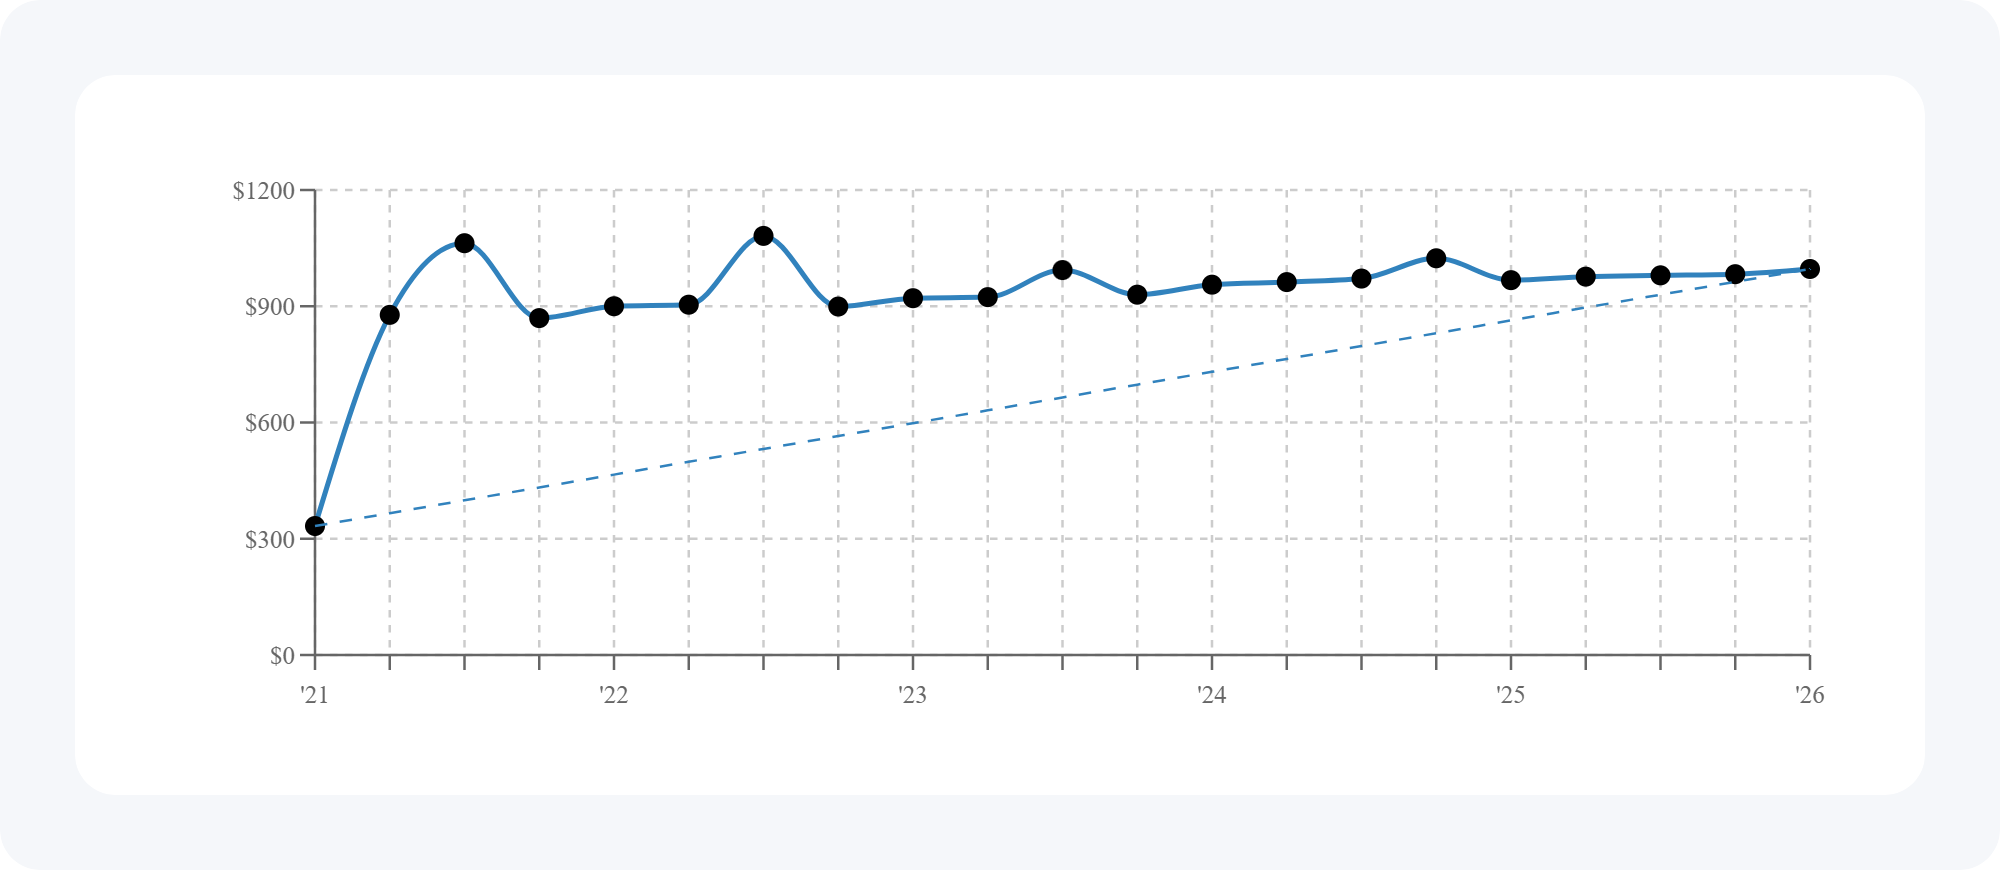
Here's the dividend growth trend for these holdings over the last five years.
Energy infrastructure companies are often valued for their ability to generate stable cash flow from essential assets. While dividend growth may not be as rapid as some dividend growth portfolios, the combination of reliable income and gradual dividend increases can create an attractive long-term income stream.
Portfolio Snapshot

Here's the quick snapshot for this portfolio:
- Yield on cost: 4%
- Annual dividend income: $4,023 per year
- Monthly dividend income: about $335 per month
- Dividend income growth: roughly 2.6% per year over five years
- Average ETF expense ratio: 0% (about $0 per year in fees)
This portfolio emphasizes reliable infrastructure-backed cash flow, offering a higher starting yield than many traditional dividend growth portfolios while still maintaining modest income growth over time.
Income Breakdown by Holding
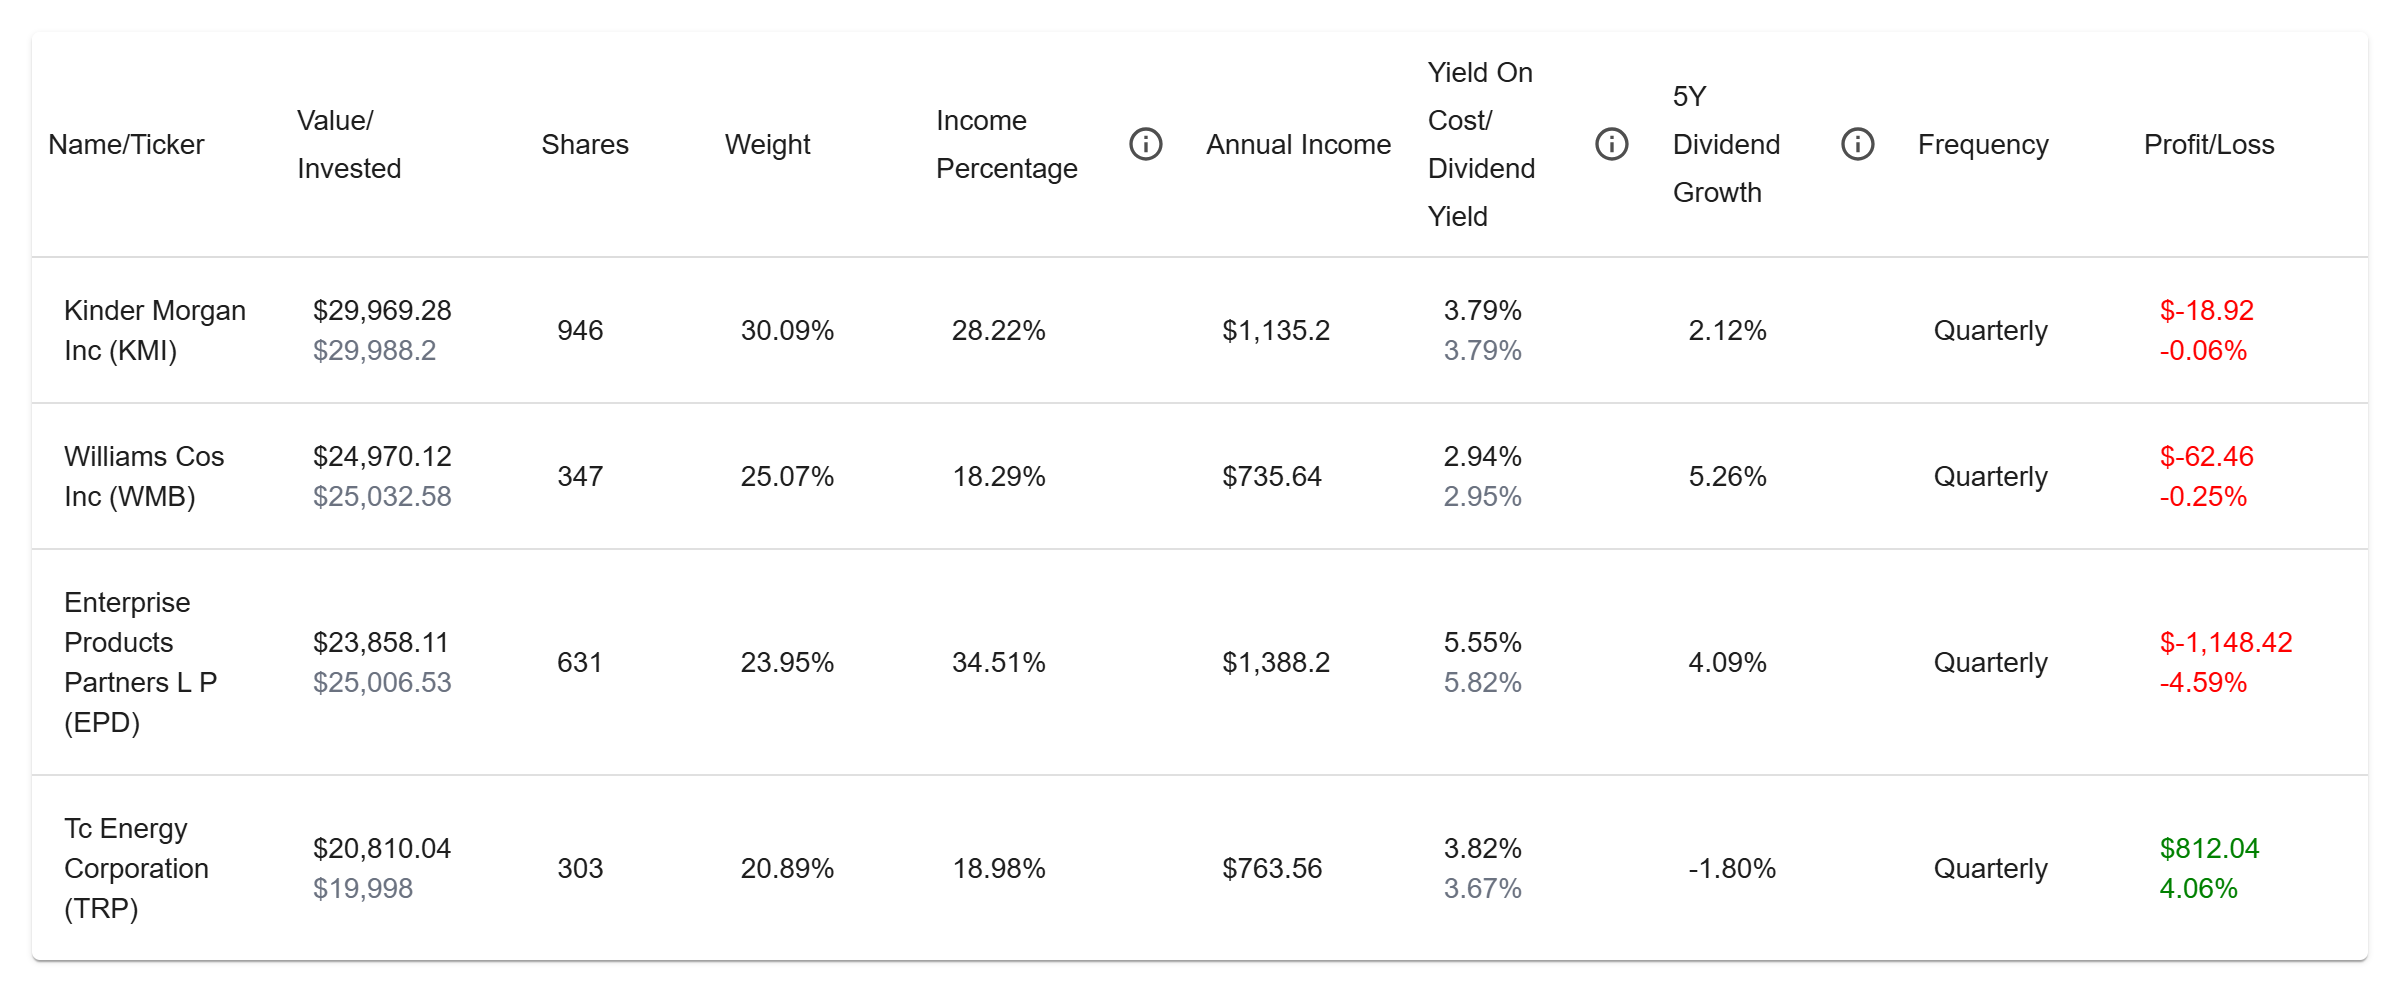
Here's how the portfolio's dividend income is split between the holdings:
- EPD: about 34.5% of the income (roughly $1,388 per year)
- KMI: about 28.2% (about $1,135 per year)
- TRP: about 19.0% (about $764 per year)
- WMB: about 18.3% (about $736 per year)
All holdings pay quarterly.
5-year dividend growth rates included in this portfolio:
- EPD: 4.1%
- KMI: 2.1%
- TRP: -1.8%
- WMB: 5.3%
The income stream is diversified across multiple energy infrastructure operators, with no single holding accounting for a majority of the portfolio's cash flow.
Forward Income Outlook
If income growth continues in line with recent history, this portfolio's cash flow could rise steadily over time.
- Yield on cost may grow from 4% today to about 4.6% in five years
- Annual income could increase from $4,023 to roughly $4,581
- Monthly income could rise from $335 to about $382
- And this projection is described as happening without adding new capital or reinvesting dividends
For investors seeking income from essential infrastructure assets, this portfolio demonstrates how pipelines and energy transportation networks can potentially provide both dependable cash flow today and moderate income growth over time.