15 Dividend Growth Stocks Ranked by Yield on Cost (Bought in 2017)
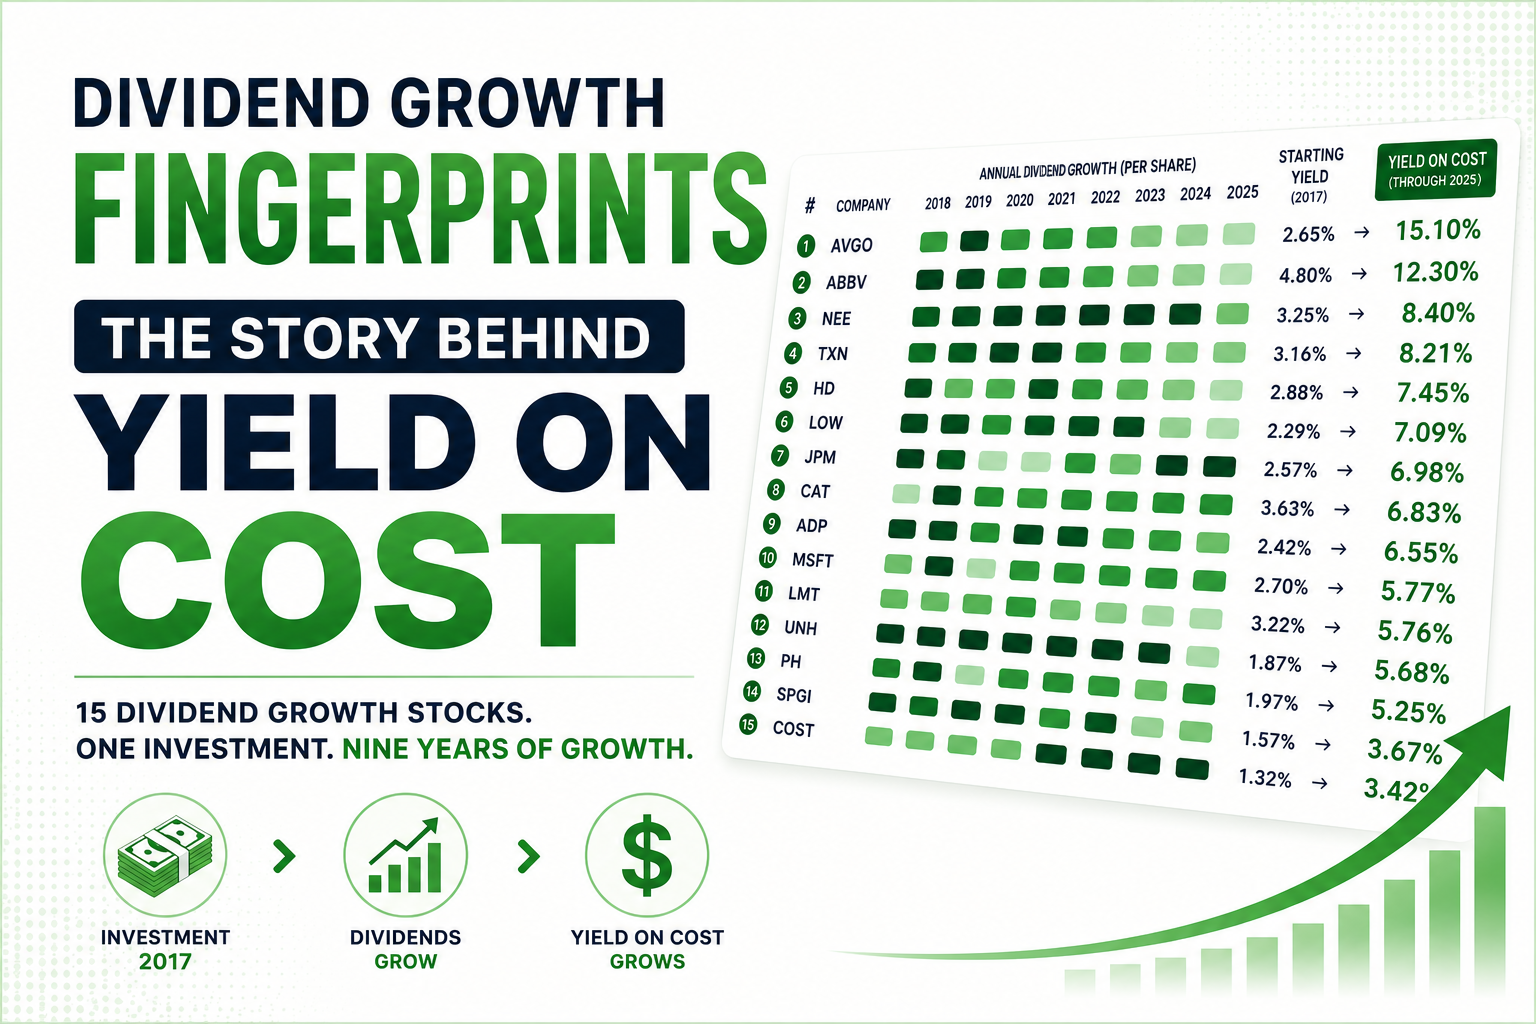
Most dividend investors compare stocks using today's dividend yield.
While that number is useful, it only tells part of the story.
Long-term dividend investors often care even more about Yield on Cost—the annual dividend income they're receiving today compared to the price they originally paid for their shares.
This visualization follows fifteen well-known dividend growth companies from a hypothetical purchase at the beginning of 2017 through the end of 2025. Instead of focusing only on the final result, it reveals the dividend growth pattern that produced it.
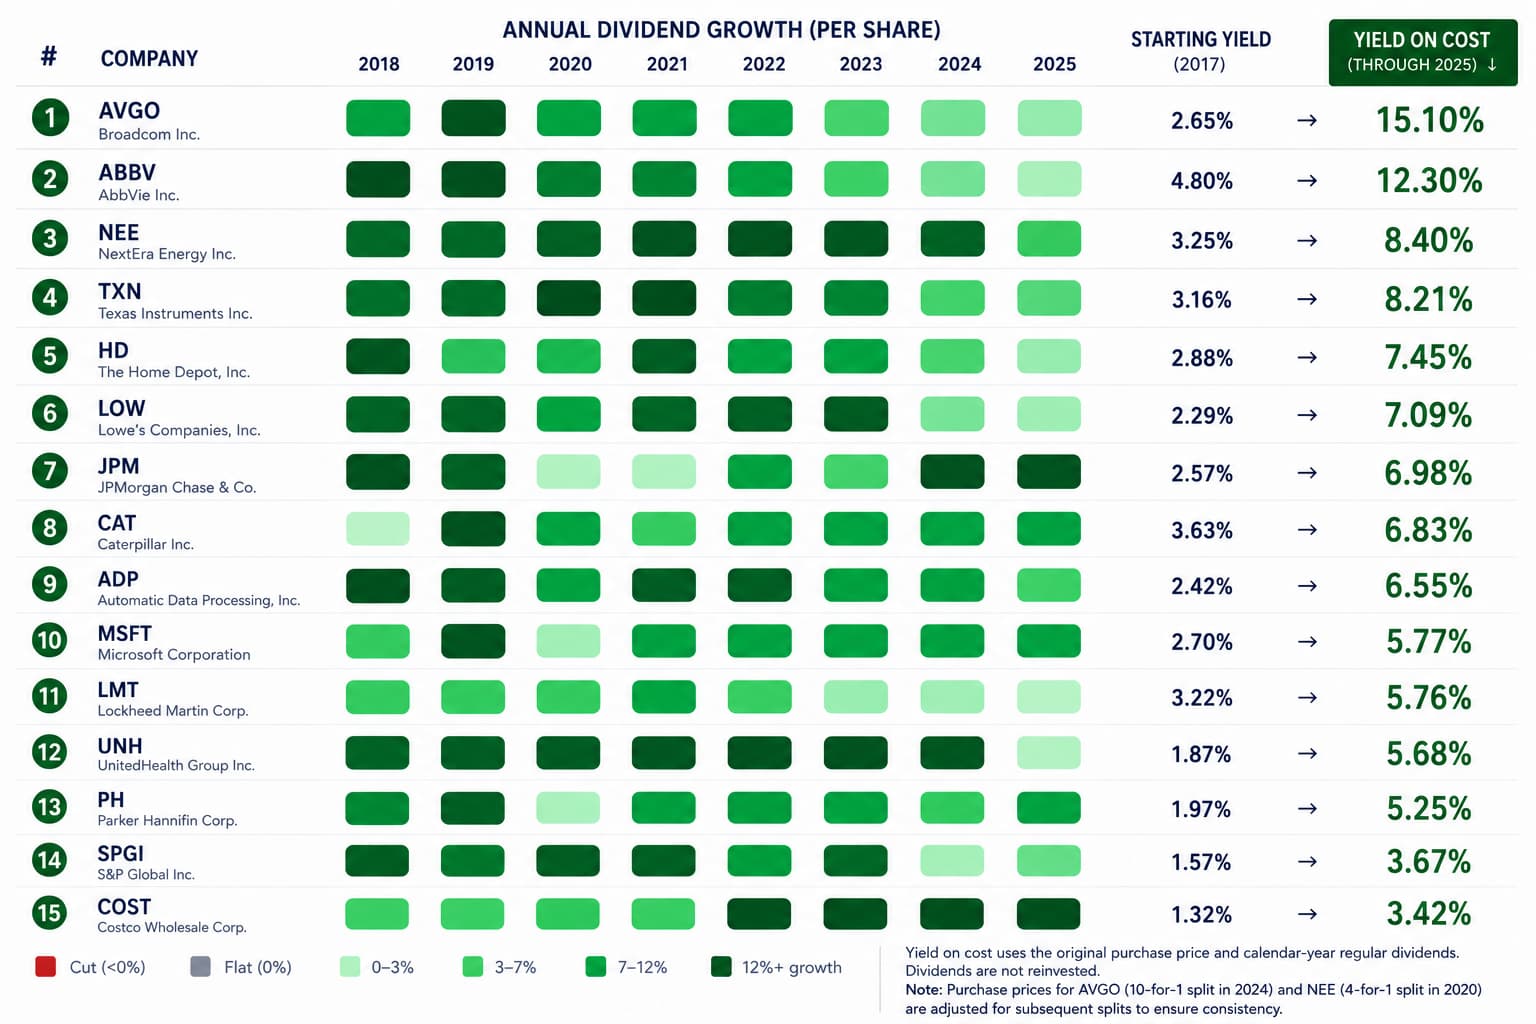
Each row represents one company.
The first columns show its ranking and original dividend yield at the beginning of 2017.
Next comes the company's dividend growth fingerprint. Every capsule represents one year's dividend increase between 2018 and 2025. Lighter capsules indicate smaller increases, while darker capsules highlight years of stronger dividend growth.
Taken together, these annual increases create a visual fingerprint unique to each company.
The final column shows the resulting Yield on Cost at the end of 2025.
One company immediately stands out.
Broadcom began with a respectable—but not extraordinary—starting yield of roughly 2.65%. Years of exceptional dividend growth eventually transformed that into a Yield on Cost exceeding 15%, demonstrating how powerful sustained dividend increases can become over time.
AbbVie reached the top of the rankings through a different combination of strengths. A relatively attractive starting yield paired with consistently strong dividend growth produced another outstanding long-term income outcome.
Home Depot and Lowe's illustrate yet another path. Neither relied on unusually high initial yields. Instead, steady dividend increases year after year gradually compounded into Yield on Cost figures above 7%.
Further down the ranking are companies such as Microsoft, S&P Global, and Costco. All three have impressive records of dividend growth, yet their much lower starting yields make it more difficult to achieve the same Yield on Cost within the same time period.
The visualization highlights an important principle: dividend growth matters, but where the journey begins matters too.
Final Takeaway
Yield on Cost is the product of two forces working together: a company's starting dividend yield and its ability to consistently raise that dividend over many years.
Looking only at today's yield misses much of that story.
The dividend growth fingerprint makes the journey visible, helping investors understand not only which companies generated the highest Yield on Cost, but also the dividend growth patterns that produced those results.
If you'd like to analyze dividend growth, Yield on Cost, and income trends across your own portfolio, DividendXray provides interactive visualizations designed to make long-term dividend investing easier to understand.
This article is for educational purposes only and should not be considered financial advice.