AMT vs CCI vs EQIX vs DLR: 10 Years of REIT Dividend Growth and Income
Portfolio Overview
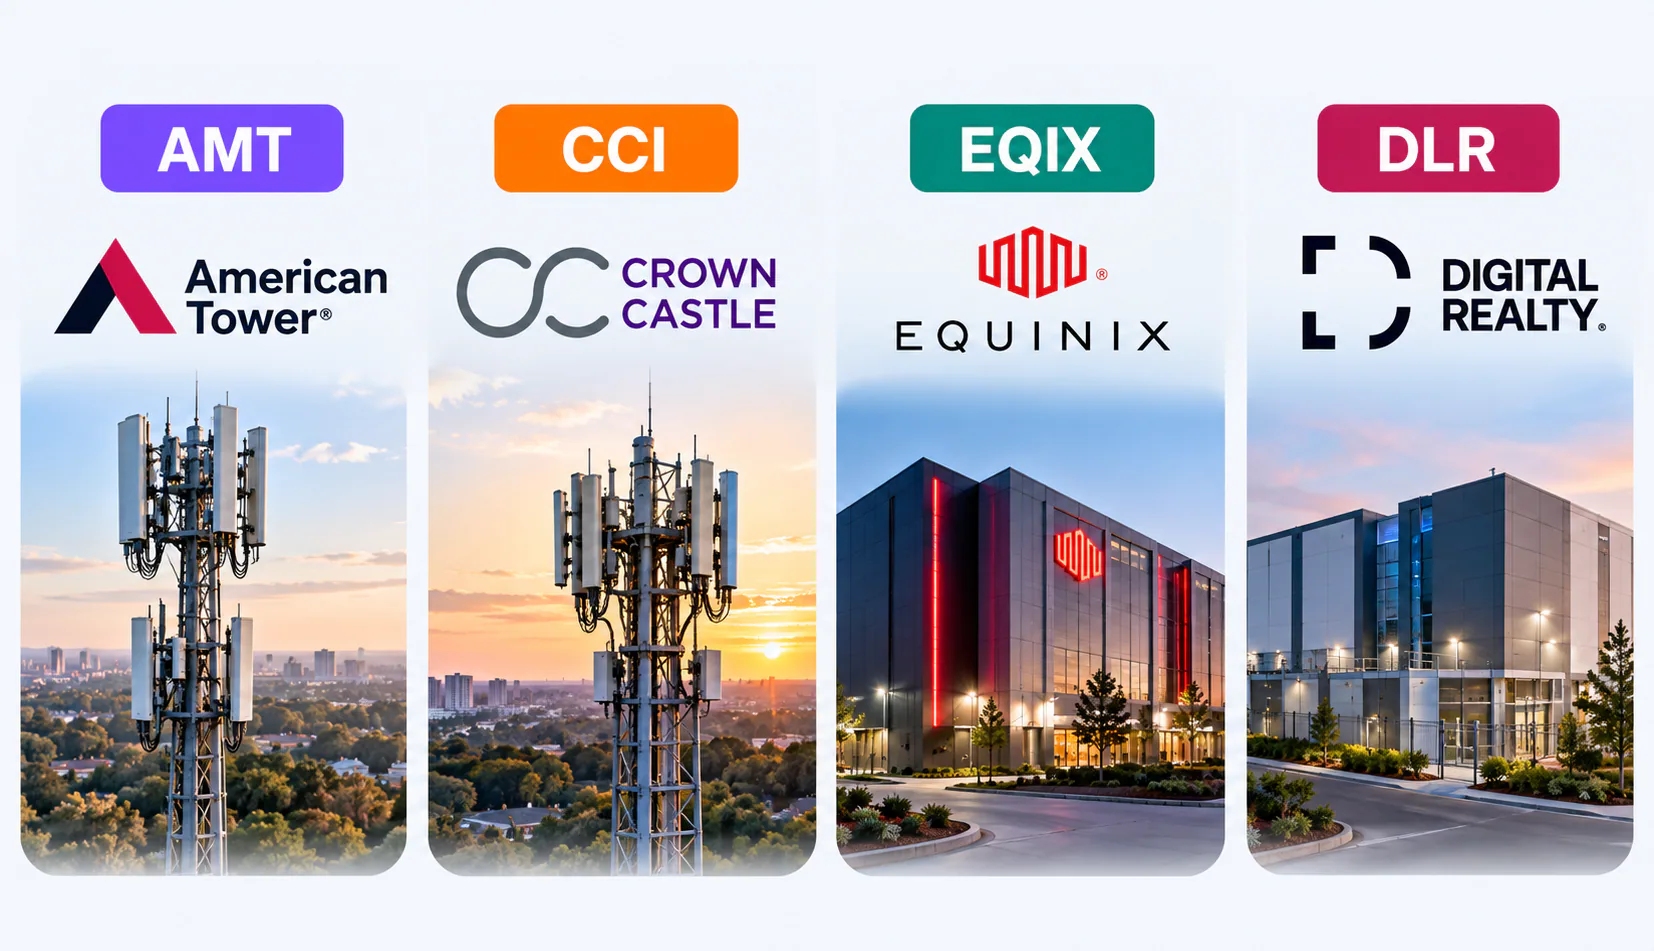
In this DividendXray battle, we compare four major infrastructure REITs — American Tower (AMT), Crown Castle (CCI), Equinix (EQIX), and Digital Realty (DLR) — across dividend growth, yield-on-cost expansion, and price appreciation over a ten-year period.
Although all four operate as real estate investment trusts, their underlying businesses serve different areas of digital infrastructure.
- American Tower (AMT) owns and operates wireless communication towers supporting mobile networks around the world.
- Crown Castle (CCI) focuses on U.S. communications infrastructure, primarily wireless towers.
- Equinix (EQIX) operates data centers that connect businesses, cloud providers, and digital networks.
- Digital Realty (DLR) specializes in data center real estate, supporting cloud computing and enterprise technology.
These differences make for an interesting comparison. Telecommunications infrastructure and data centers serve distinct markets, and their dividend policies, starting yields, and historical growth profiles can produce very different outcomes for income-focused investors.
The analysis begins with historical performance before shifting to today's income requirements and a forward-looking dividend growth projection.
Category Winners
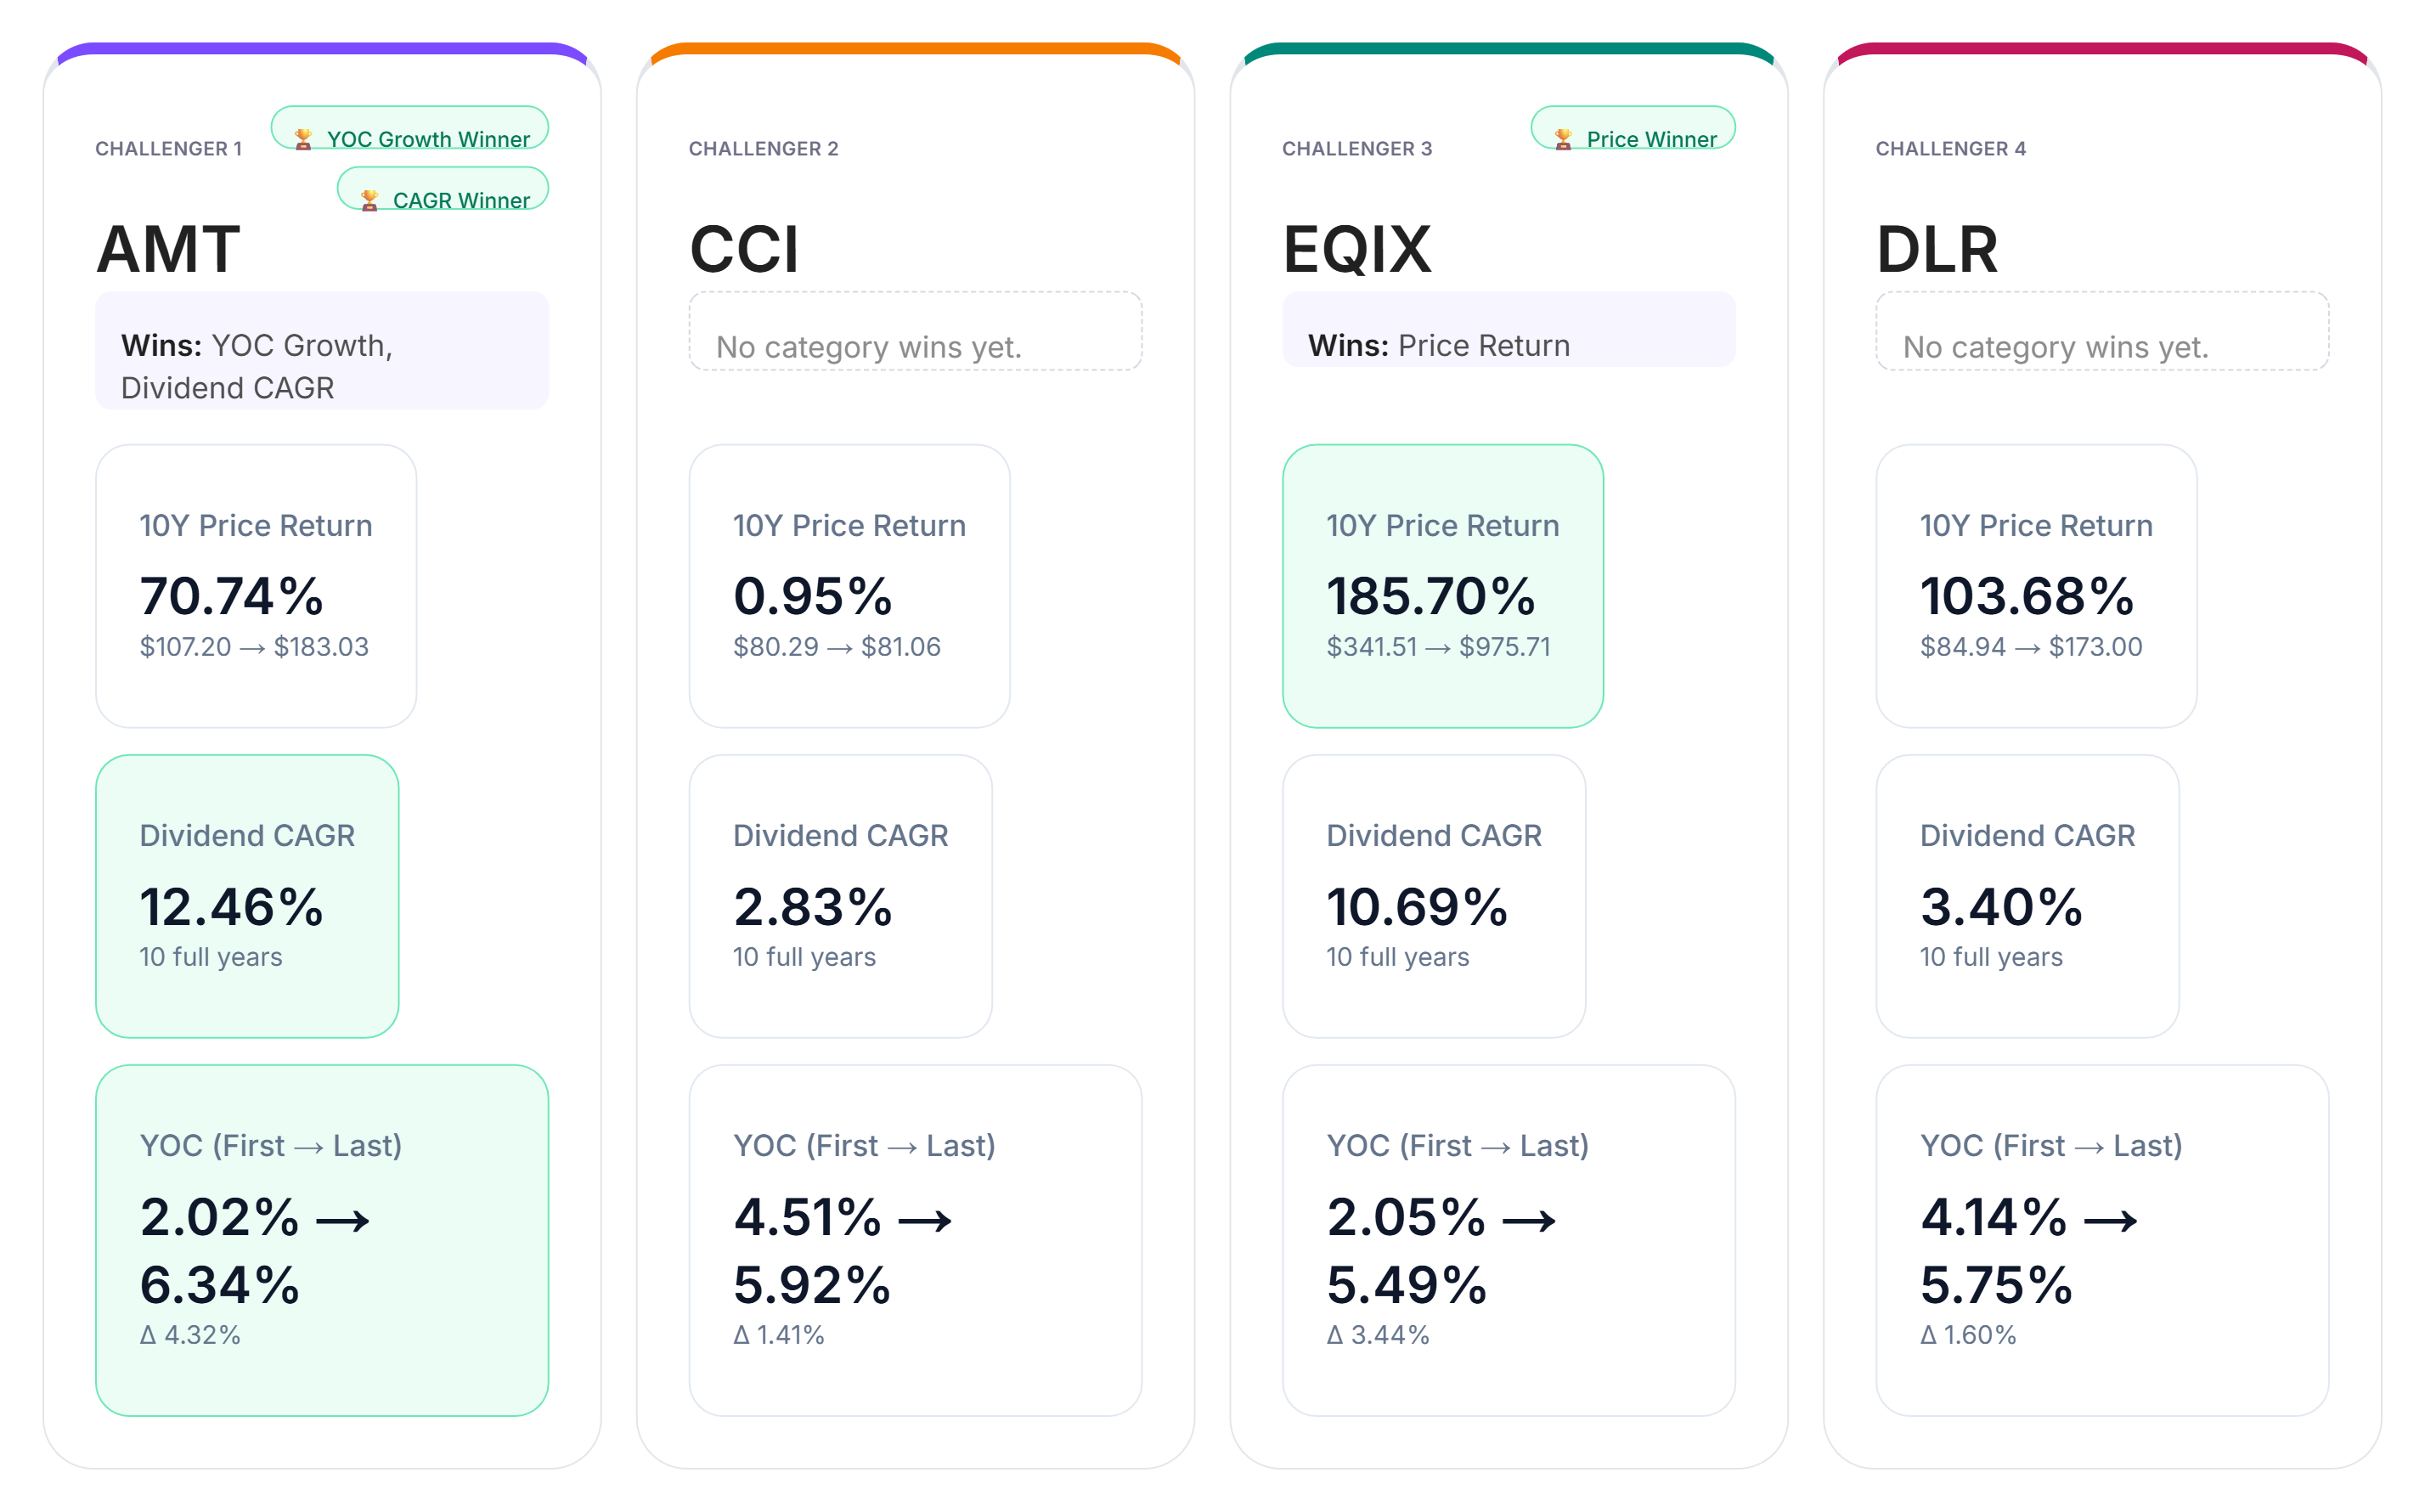
Looking at the ten-year results across dividend CAGR, yield-on-cost growth, and price return, two REITs emerge as category leaders.
In dividend growth, American Tower (AMT) takes the lead with a ten-year dividend CAGR of 12.46%, the strongest among the four holdings.
AMT also wins in yield-on-cost growth, demonstrating the largest improvement between the first and final years of the comparison. Its historical dividend expansion translates into a meaningful increase in income relative to the original investment.
In price return, however, Equinix (EQIX) takes the top position with a ten-year gain of 185.70%.
Crown Castle (CCI) and Digital Realty (DLR) do not secure a category win in this battle, but their results remain relevant when evaluating current income potential.
The comparison highlights an important distinction: the REIT delivering the strongest dividend growth is not necessarily the one generating the greatest price appreciation.
Price return also measures a different outcome from dividend income. It reflects changes in share price rather than the total investment return including distributions.
Yield-on-Cost by Year
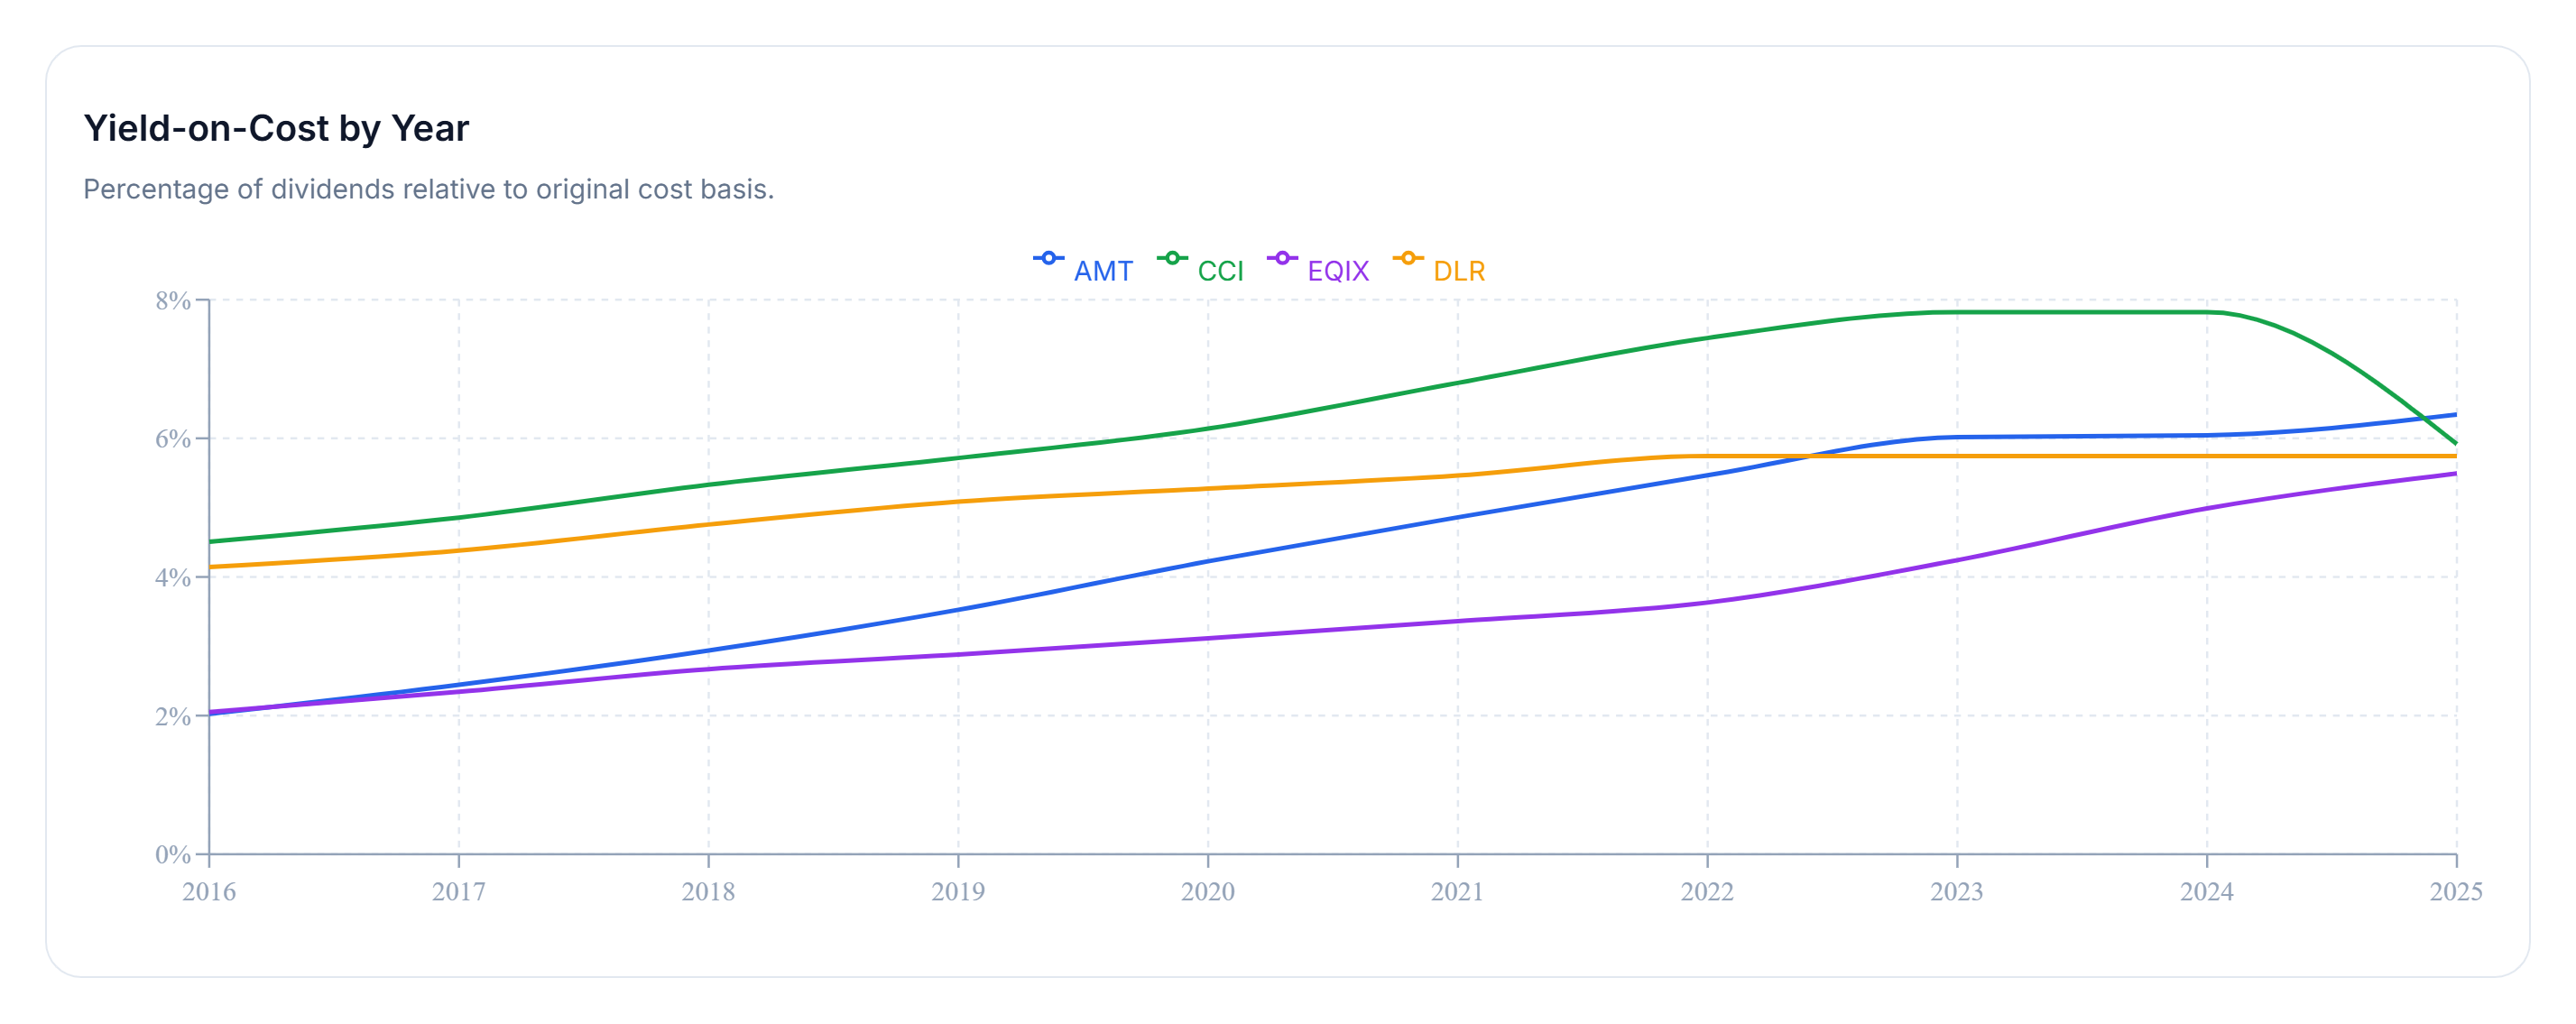
Yield on cost measures annual dividend income relative to the original purchase price. Unlike current dividend yield, which changes with the market price, yield on cost helps illustrate how a holding's income generation evolves relative to the initial investment.
Over the ten-year comparison, American Tower stands out with the strongest yield-on-cost improvement, reaching approximately 6.34% by the end of the period.
This result is consistent with AMT's leadership in historical dividend growth. Rising distributions can increase the income generated per dollar of original capital, even without additional purchases.
However, not every REIT follows a consistently upward dividend trajectory.
Crown Castle reduced its quarterly dividend by approximately 32% in 2025, interrupting its long-term income growth trend.
This is an important distinction for dividend investors. A holding can maintain a positive long-term dividend growth rate while experiencing a significant reduction in income during an individual year.
The yield-on-cost chart helps make these differences visible, showing how the four REITs' income histories developed rather than focusing only on their latest distributions.
For investors seeking growing income, both the magnitude and consistency of dividend growth deserve attention. Historical growth can be informative, but it does not eliminate the possibility of future dividend cuts.
With the historical results established, the next question is more practical: how much capital would each REIT require to generate a specific amount of dividend income today?
Income Goal Comparison
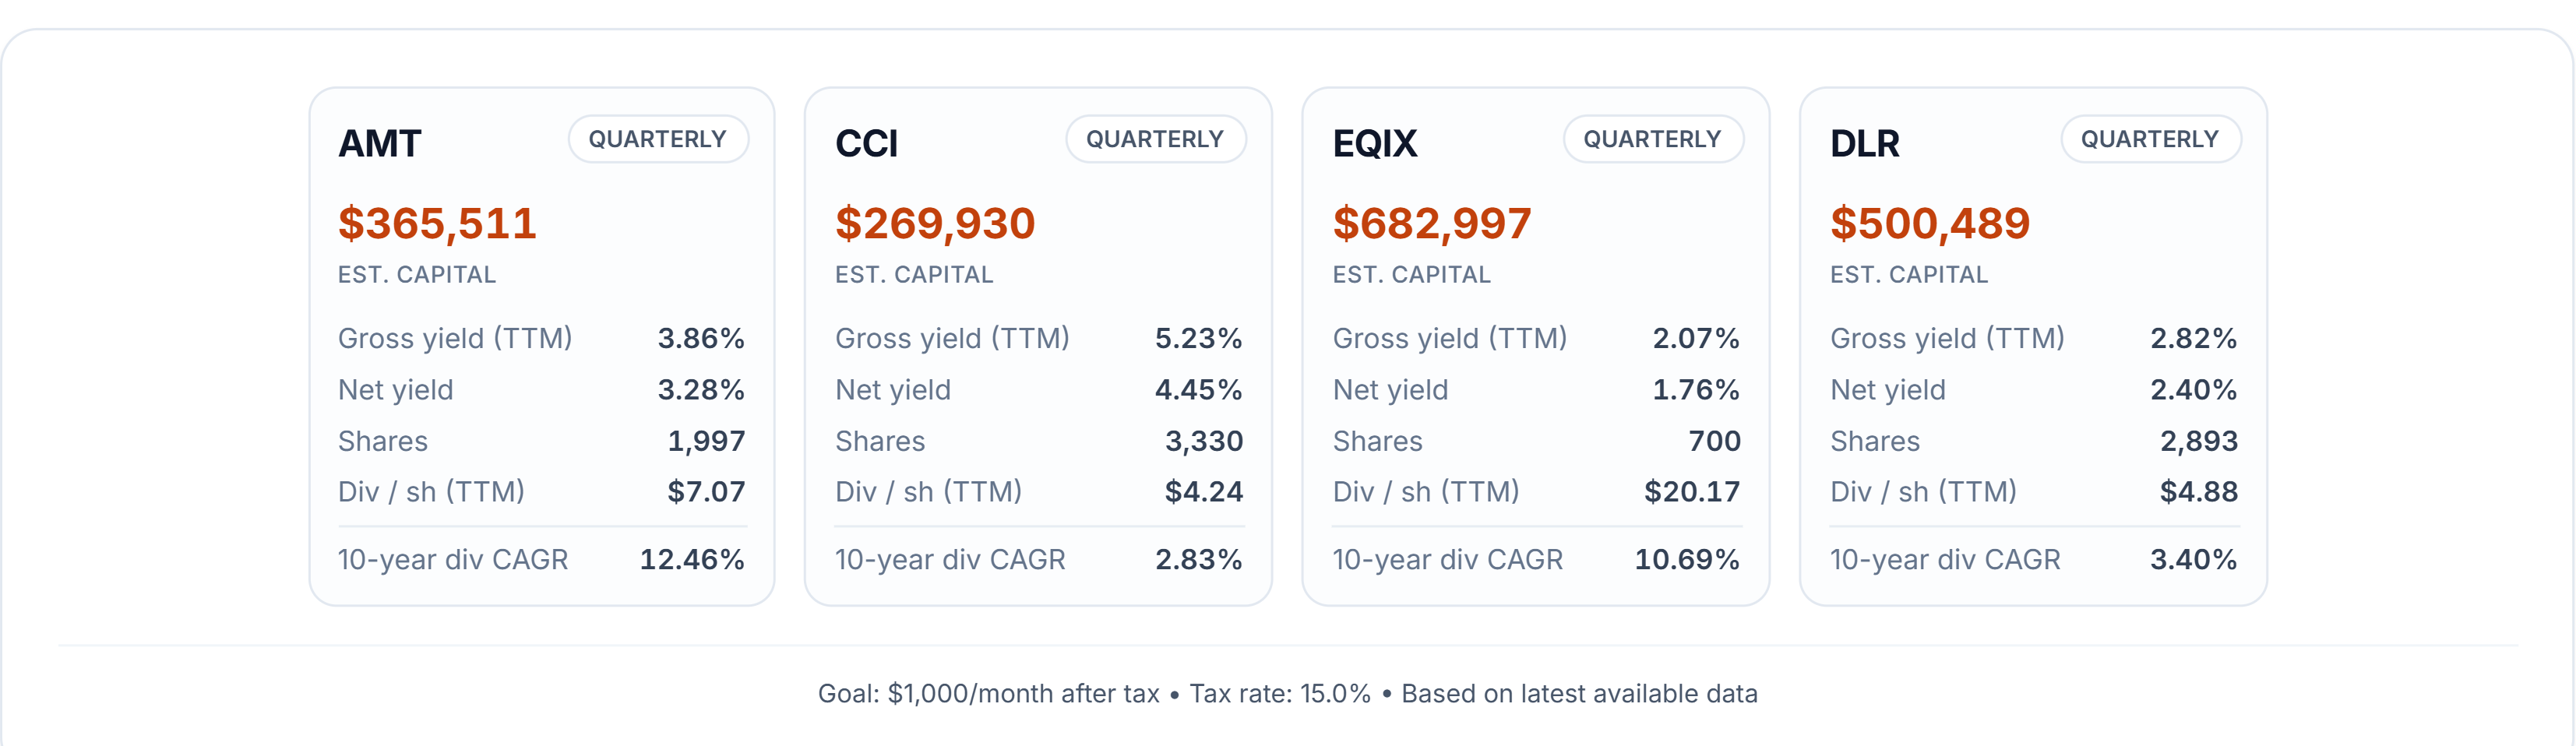
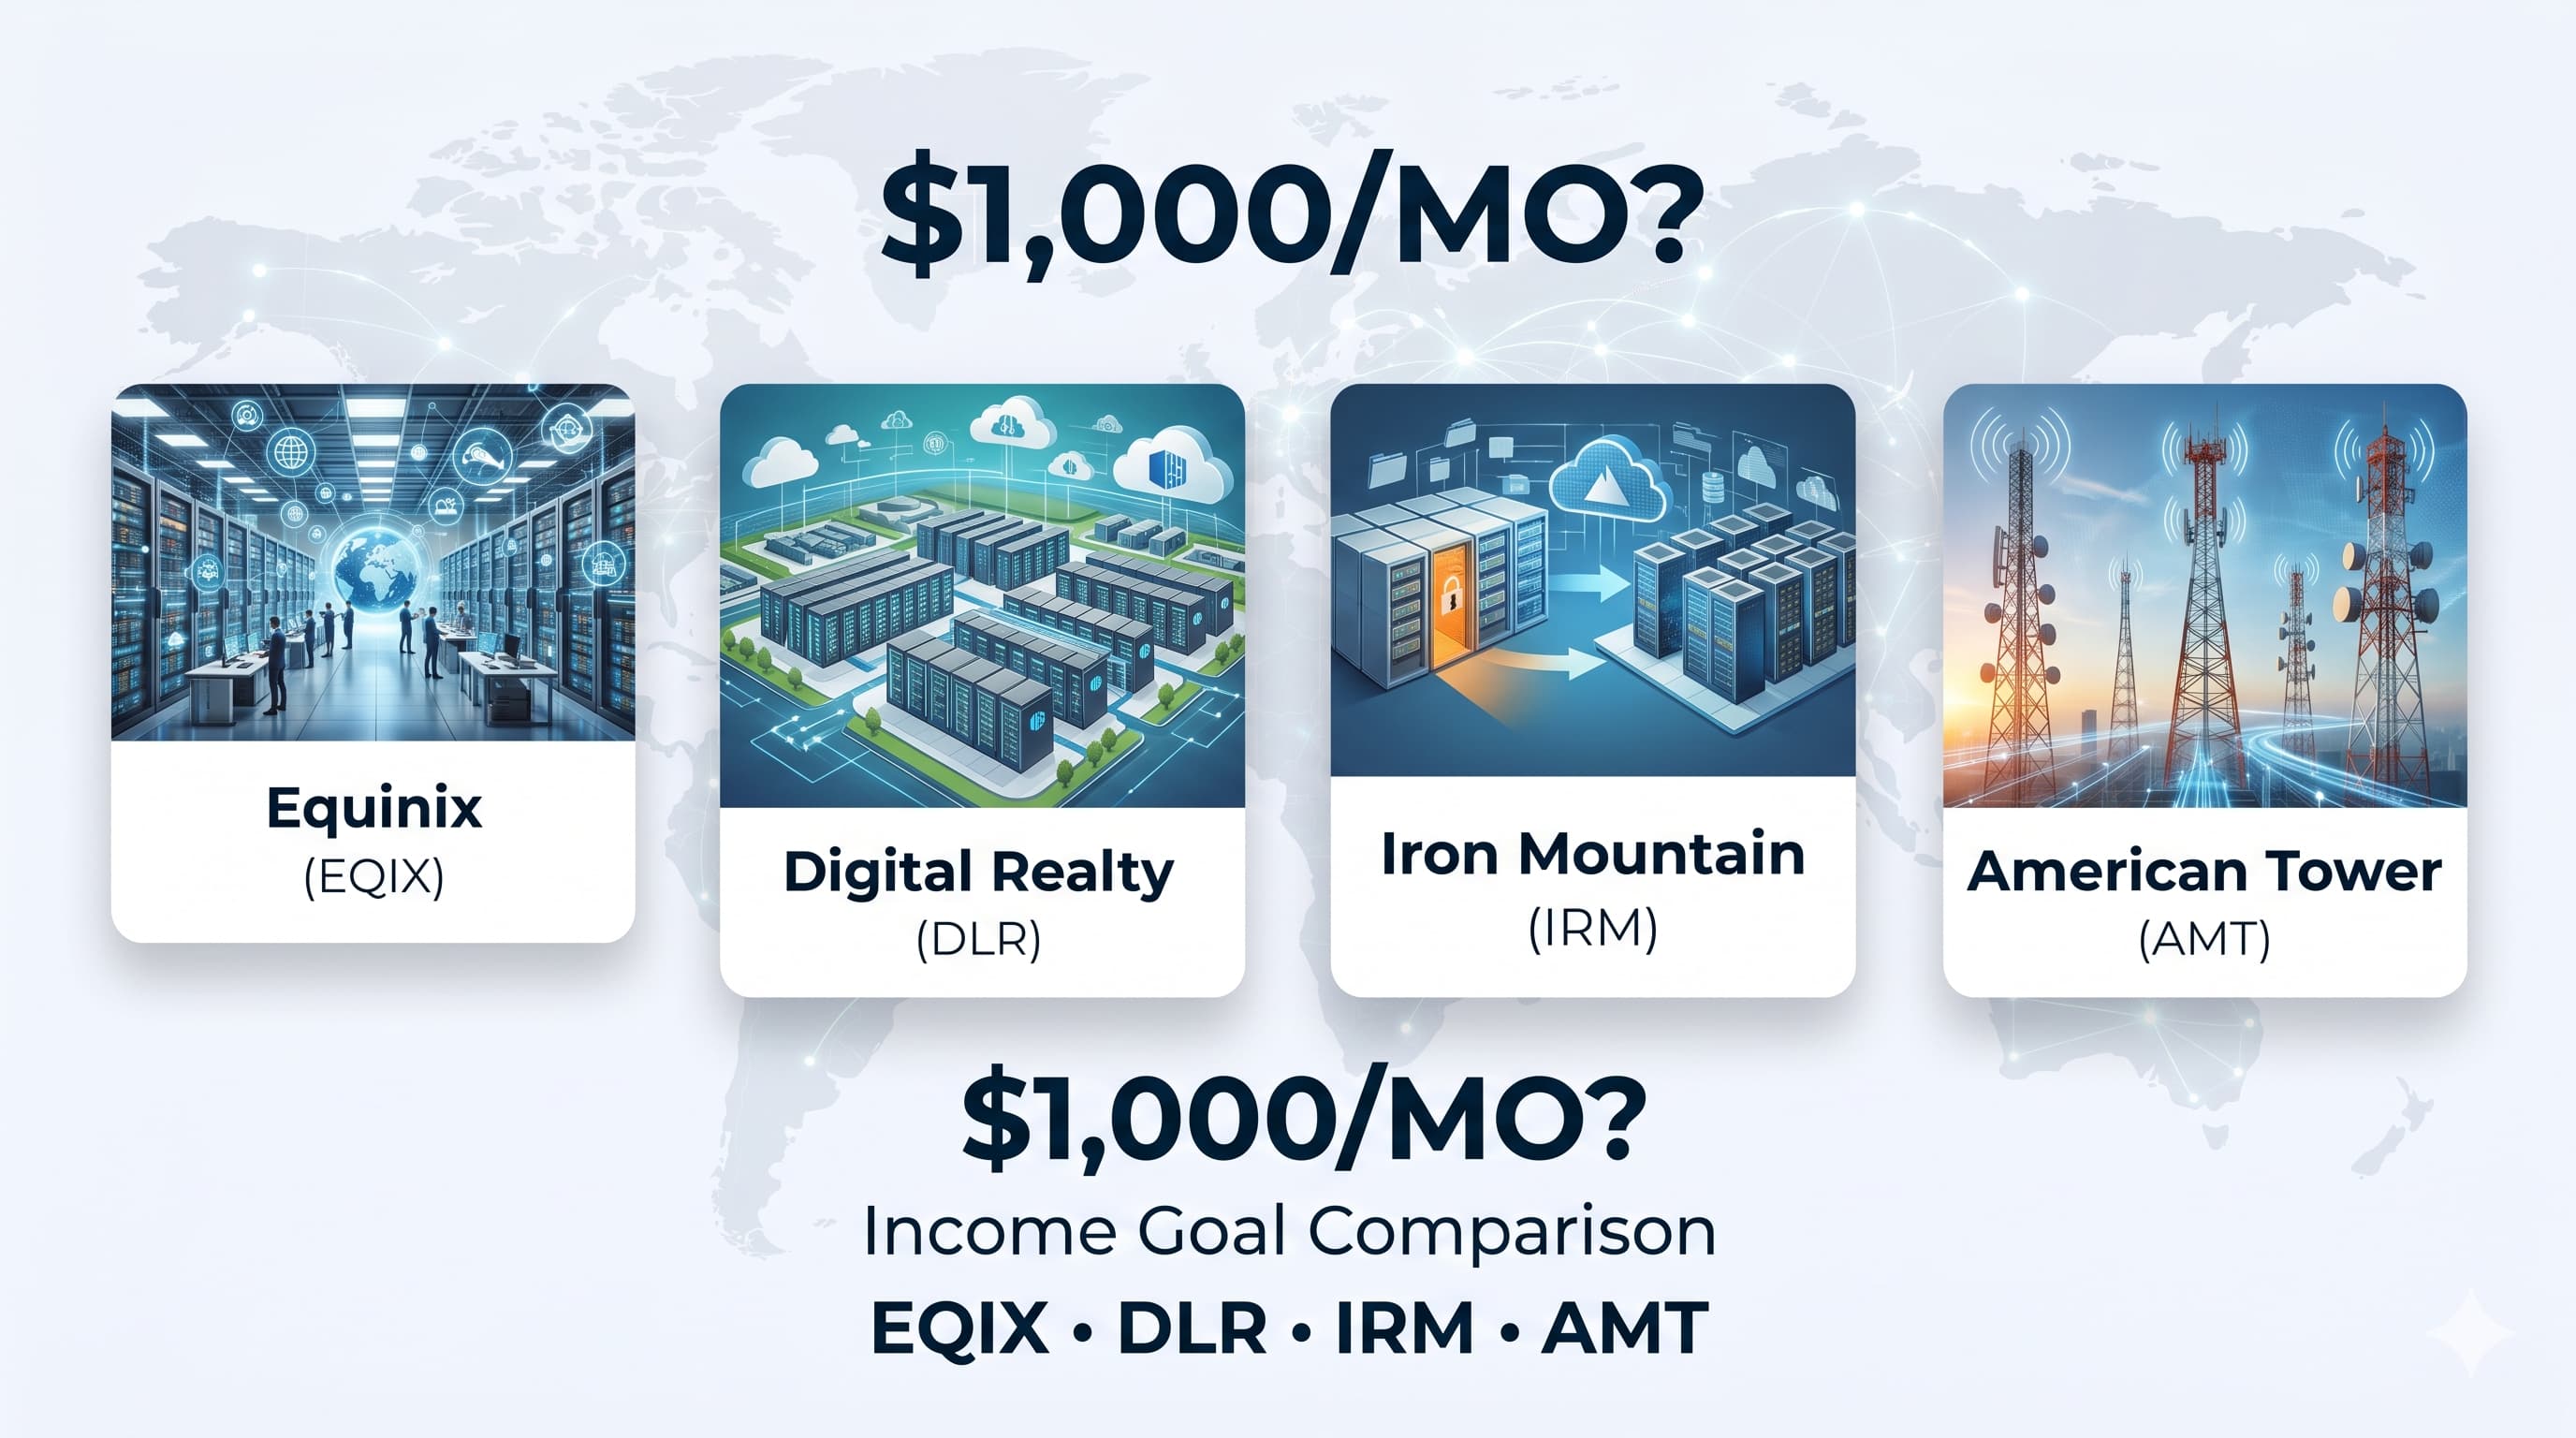
How much capital would an investor need to generate $1,000 per month in after-tax dividend income from each of these four REITs?
The answer depends primarily on the current dividend yield and the assumed tax treatment.
For this comparison, DividendXray uses a 15% tax assumption and calculates the capital required to reach the same monthly income target.
Crown Castle (CCI) requires the least capital, at approximately $269,930, supported by a starting dividend yield near 5.2%.
At the other end of the comparison, Equinix (EQIX) requires approximately $683,000, reflecting its substantially lower starting yield of around 2.1%.
American Tower (AMT) and Digital Realty (DLR) fall between these two extremes, representing different combinations of starting income and historical dividend growth.
The contrast between CCI and EQIX illustrates a fundamental tradeoff in dividend investing.
A higher starting yield can reduce the capital needed to reach an immediate income goal. A lower-yielding investment requires more upfront capital to produce the same initial income, but faster future dividend growth may eventually narrow the difference.
However, higher starting yield does not automatically mean more reliable income.
CCI's dividend reduction in 2025 is particularly relevant here. Its current yield may look attractive from an income perspective, but historical distributions demonstrate that dividend payments can change materially.
Likewise, EQIX's lower starting yield does not by itself establish that it will deliver superior future income growth.
The income comparison cards illustrate the capital requirements under the stated assumptions. They do not predict whether those distributions will remain stable or increase.
Yield Catch-Up Timeline
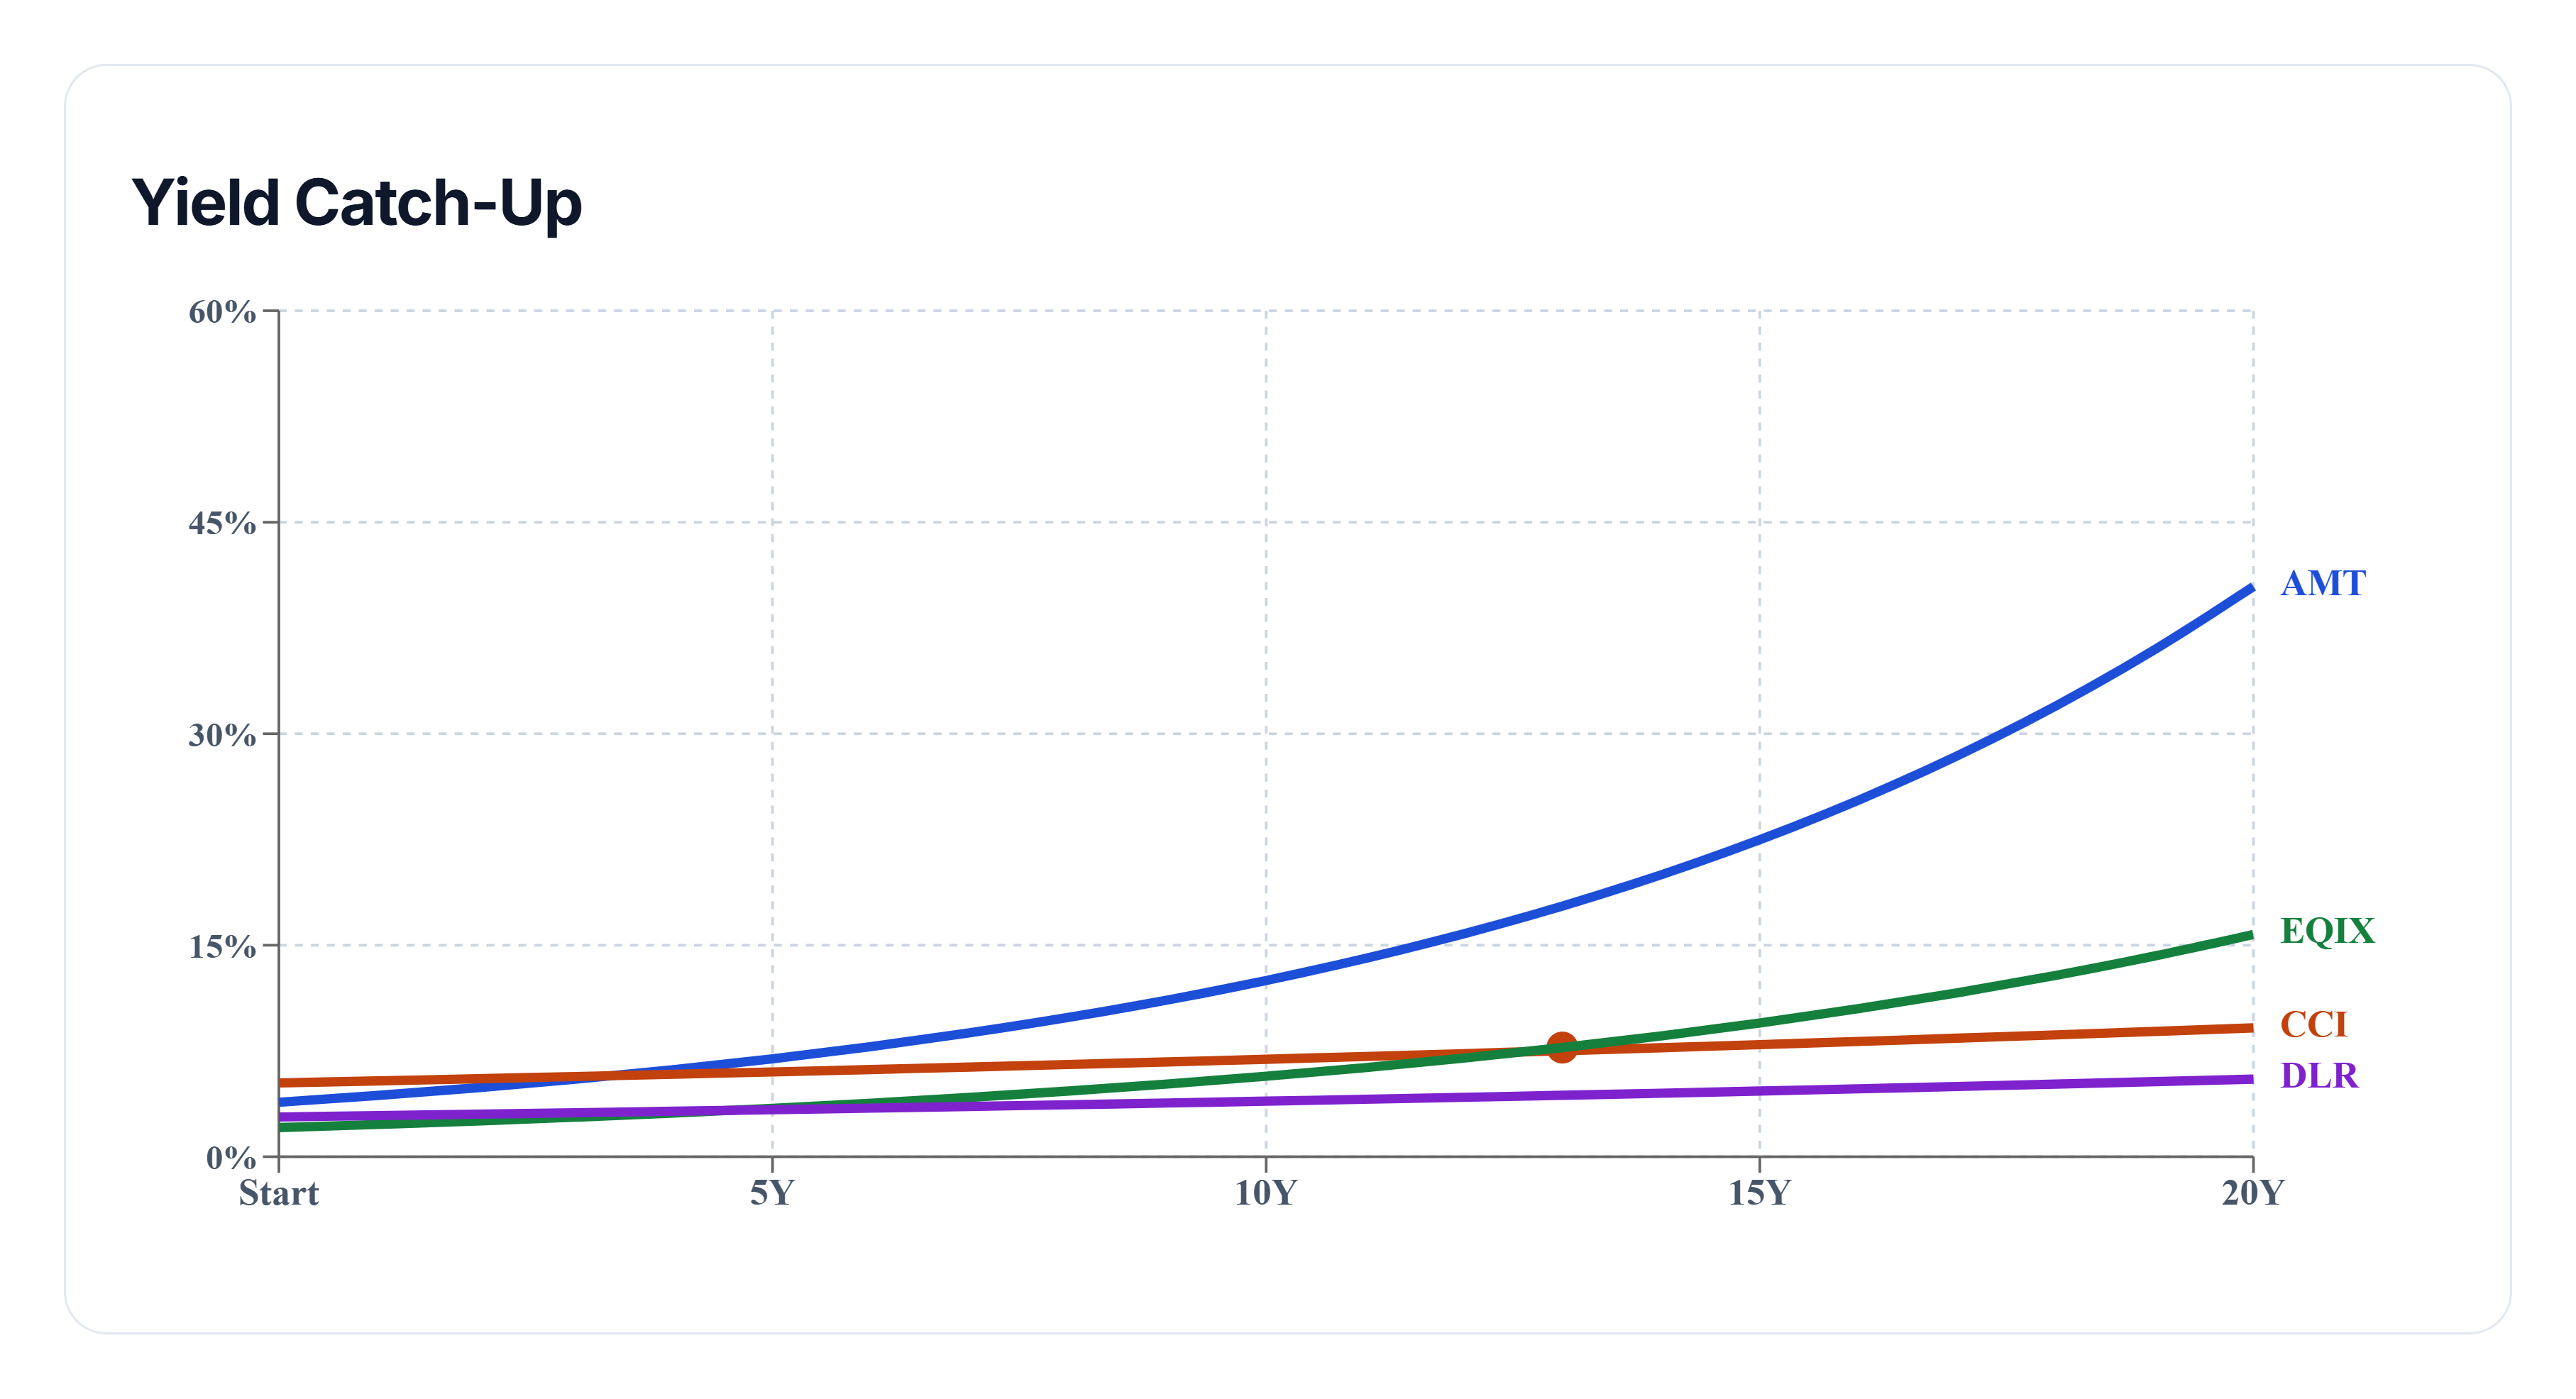
The final part of the analysis examines how future dividend growth could change the relationship between today's higher-yield and lower-yield REITs.
The yield catch-up model assumes that each holding maintains a dividend growth rate similar to its historical ten-year dividend CAGR.
These are illustrative assumptions rather than forecasts.
American Tower enters the projection with the strongest historical dividend growth rate, approximately 12.5% annually.
Crown Castle begins with the highest current yield, near 5.2%, giving it a substantial initial income advantage.
Equinix starts at approximately 2.1%, but its stronger historical dividend growth creates the possibility of narrowing that gap over time.
Under the model's assumptions, EQIX's projected yield on cost overtakes CCI's around year thirteen.
This illustrates how the relationship between starting yield and dividend growth can change over longer investment horizons.
An investment that initially generates less income per dollar invested may eventually produce more if its dividend grows sufficiently faster.
However, the catch-up timeline is highly sensitive to the assumed growth rates.
Maintaining a historical dividend CAGR for another thirteen years is far from guaranteed. Business conditions, capital requirements, distribution policies, and future dividend reductions can all materially affect the outcome.
The projection is therefore best understood as a way to explore the mathematical relationship between starting yield and dividend growth, not as a prediction of future distributions.
Final Takeaway
This infrastructure REIT battle highlights the different strengths of American Tower, Crown Castle, Equinix, and Digital Realty.
AMT leads in historical dividend growth, recording a ten-year CAGR of 12.46% and the strongest yield-on-cost improvement.
EQIX leads in price appreciation, with a ten-year price return of 185.70%.
When the analysis shifts to today's income picture, CCI requires the least capital to generate $1,000 per month after tax, while EQIX requires the most.
Yet the long-term projection adds another dimension: under historical growth assumptions, EQIX's yield on cost eventually overtakes CCI's around year thirteen.
The results demonstrate why starting yield, dividend growth, and price appreciation should be evaluated separately.
A REIT can be attractive from a current income perspective without leading in historical dividend growth. Likewise, strong historical growth does not guarantee that a lower-yielding holding will eventually outperform a higher-yielding alternative.
Ultimately, the comparison is not about identifying one universally superior REIT. It is about understanding the tradeoffs between income today, dividend growth over time, and capital appreciation, and how those differences affect long-term investment objectives.