EQIX vs DLR vs IRM vs AMT: How Much Capital Is Needed for $1,000 per Month?
Introduction
How much capital do you need to generate $1,000 per month in dividend income from digital infrastructure REITs? The answer depends on current yield, dividend growth, and how much capital is required to reach the same income goal.
In this breakdown, we compare Equinix (EQIX), Digital Realty (DLR), Iron Mountain (IRM), and American Tower (AMT) using the DividendXray income goal calculator. The goal is not to identify a single winner based solely on yield, but to show how different combinations of starting income and dividend growth can affect long-term income potential.
Income Goal Comparison
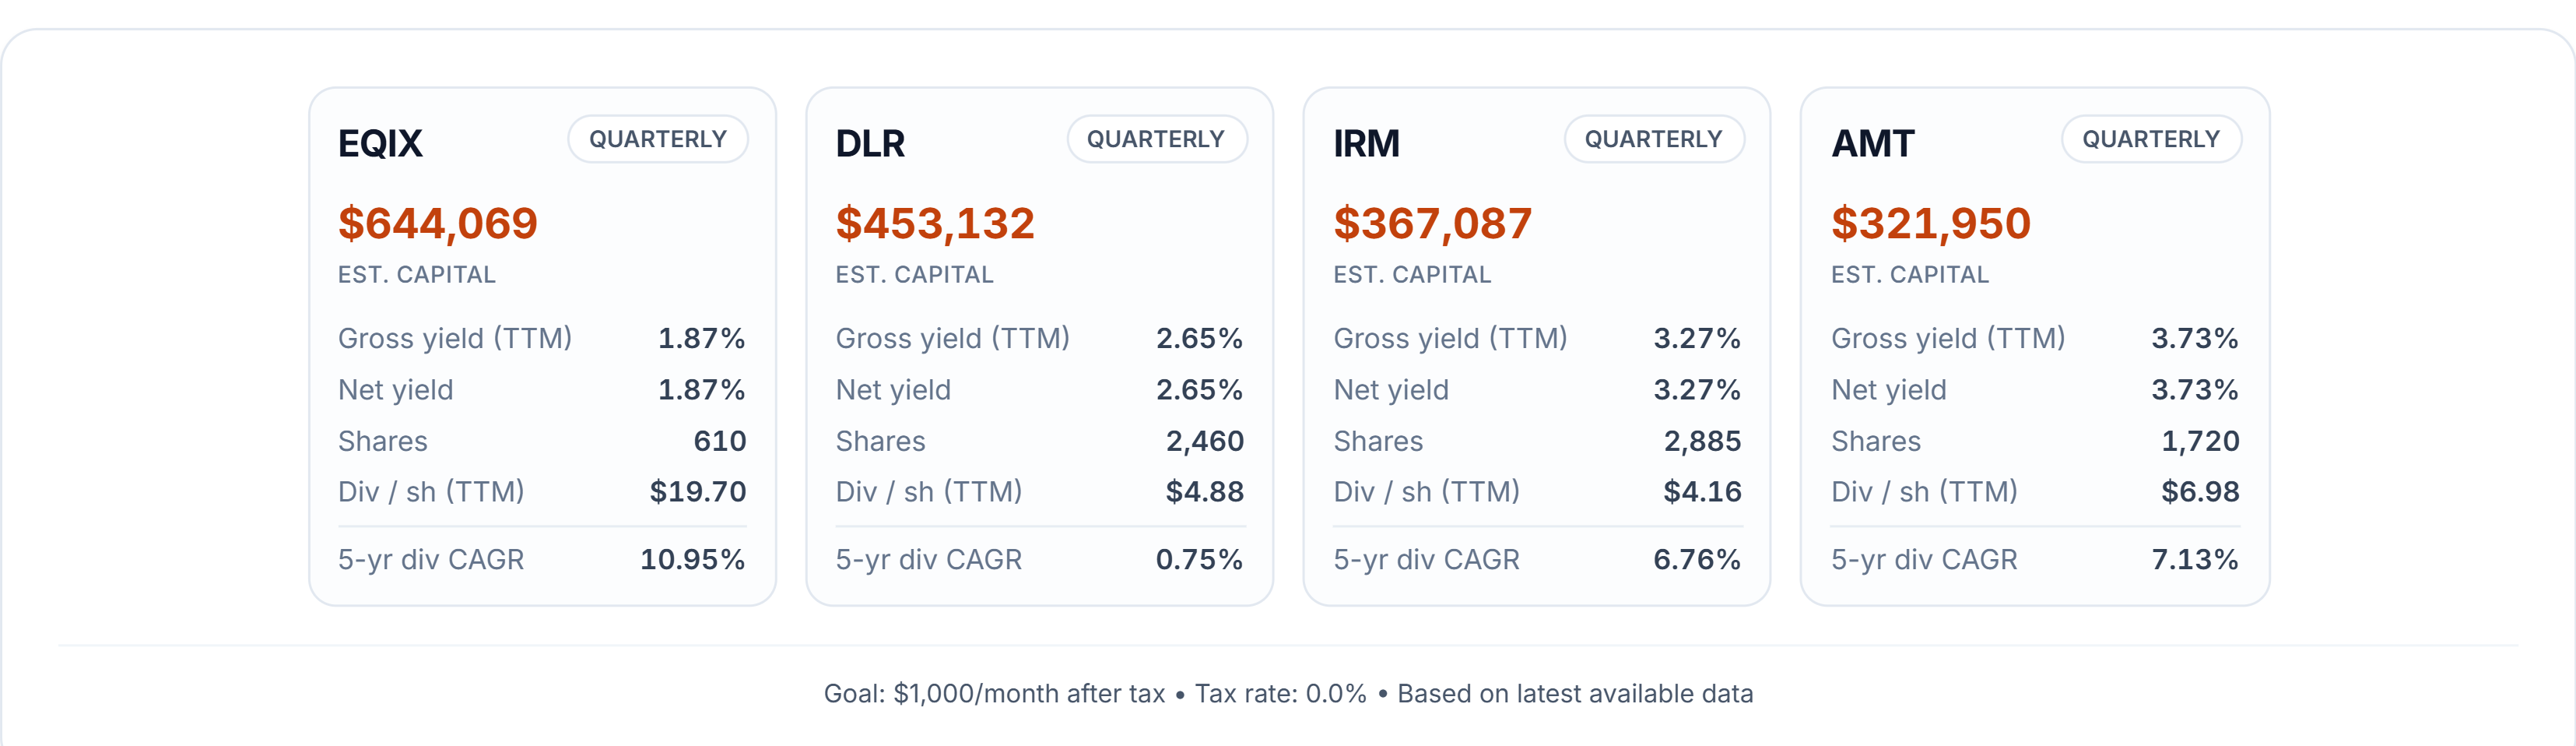
Here is a side-by-side comparison of how much capital each company would need to produce the same after-tax monthly income goal, based on current yield and tax assumptions.
For a $1,000/month after-tax target with a 0% tax assumption, American Tower requires the least capital at approximately $321,950, supported by a yield near 3.7%. Equinix requires the most capital at roughly $644,069, reflecting its lower yield of about 1.9%.
Digital Realty and Iron Mountain sit between those extremes, offering a balance between current income and future dividend growth potential.
The comparison cards make the tradeoff visible: higher-yield companies can reach the income goal with less capital today, while lower-yield dividend growers may require more upfront capital but can potentially close the gap over time.
Yield Catch-Up Timeline
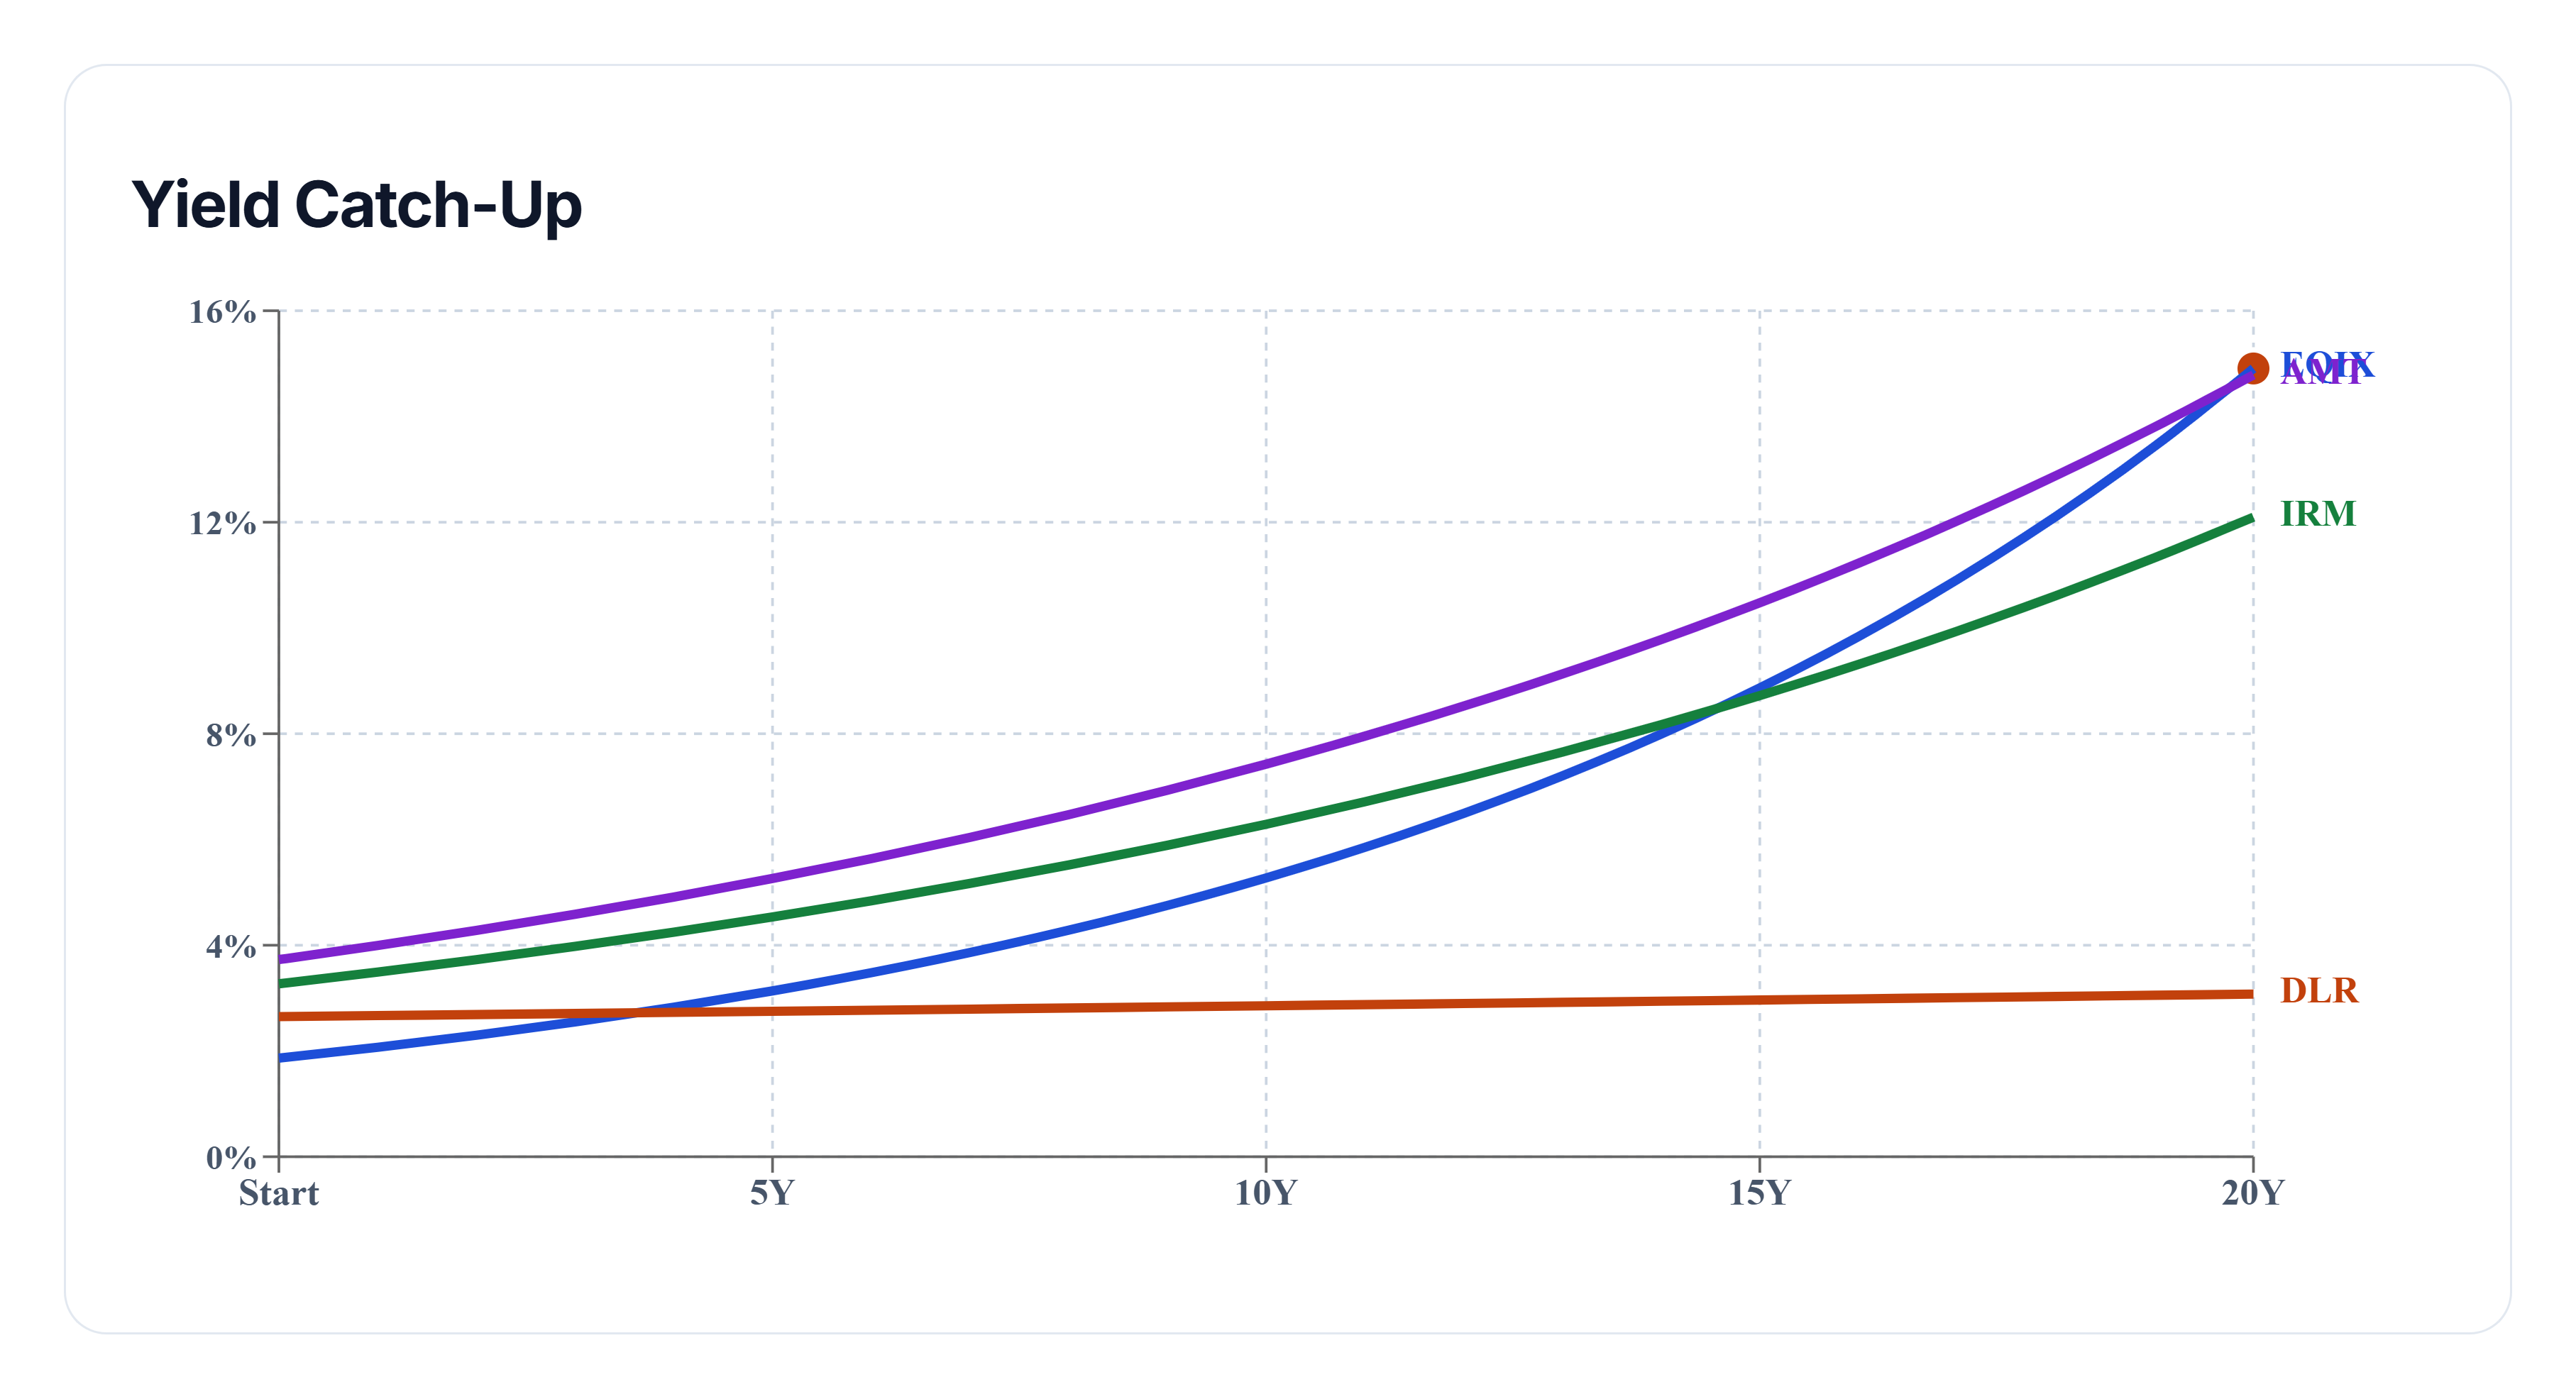
This chart shows how long it may take for lower-yield dividend growers to match the income efficiency of higher-yield alternatives, measured by yield on cost.
The projection assumes future dividend growth continues at a pace similar to the past five years. Under that assumption, Equinix delivers the strongest modeled dividend growth rate at approximately 10.9% annually, while American Tower benefits from the highest starting yield in the group.
Although EQIX begins with the lowest yield, its stronger dividend growth gradually narrows the gap. In this model, Equinix overtakes American Tower at approximately year 20 when comparing projected yield-on-cost.
For investors building toward a specific income target, the timeline helps illustrate the trade-off between higher income today and faster income growth in the future.
Final Takeaway
There is no universal answer to which digital infrastructure REIT is best for generating $1,000 per month in dividend income.
Investors seeking the lowest capital requirement today may prefer American Tower, while those focused on long-term dividend growth may find Equinix more compelling despite its lower starting yield. Digital Realty and Iron Mountain occupy the middle ground, balancing current income with future growth potential.
Use the comparison cards to evaluate capital required today, and use the catch-up timeline to determine whether a lower yield represents a temporary disadvantage or a long-term opportunity.