JEPI Price vs. Distributions: Where Did the Return Come From?

JEPI is known for its cash distributions, but looking only at the amount distributed can hide an important part of the investment experience: what happened to the share price at the same time.
From 2021 through 2025, the balance between those two components changed considerably from year to year. Separating price movement from distributions makes it easier to see where JEPI's historical results actually came from.
In this analysis, distributions are treated as cash and are not reinvested, so the figures should not be interpreted as a conventional reinvested or compounded total-return calculation.
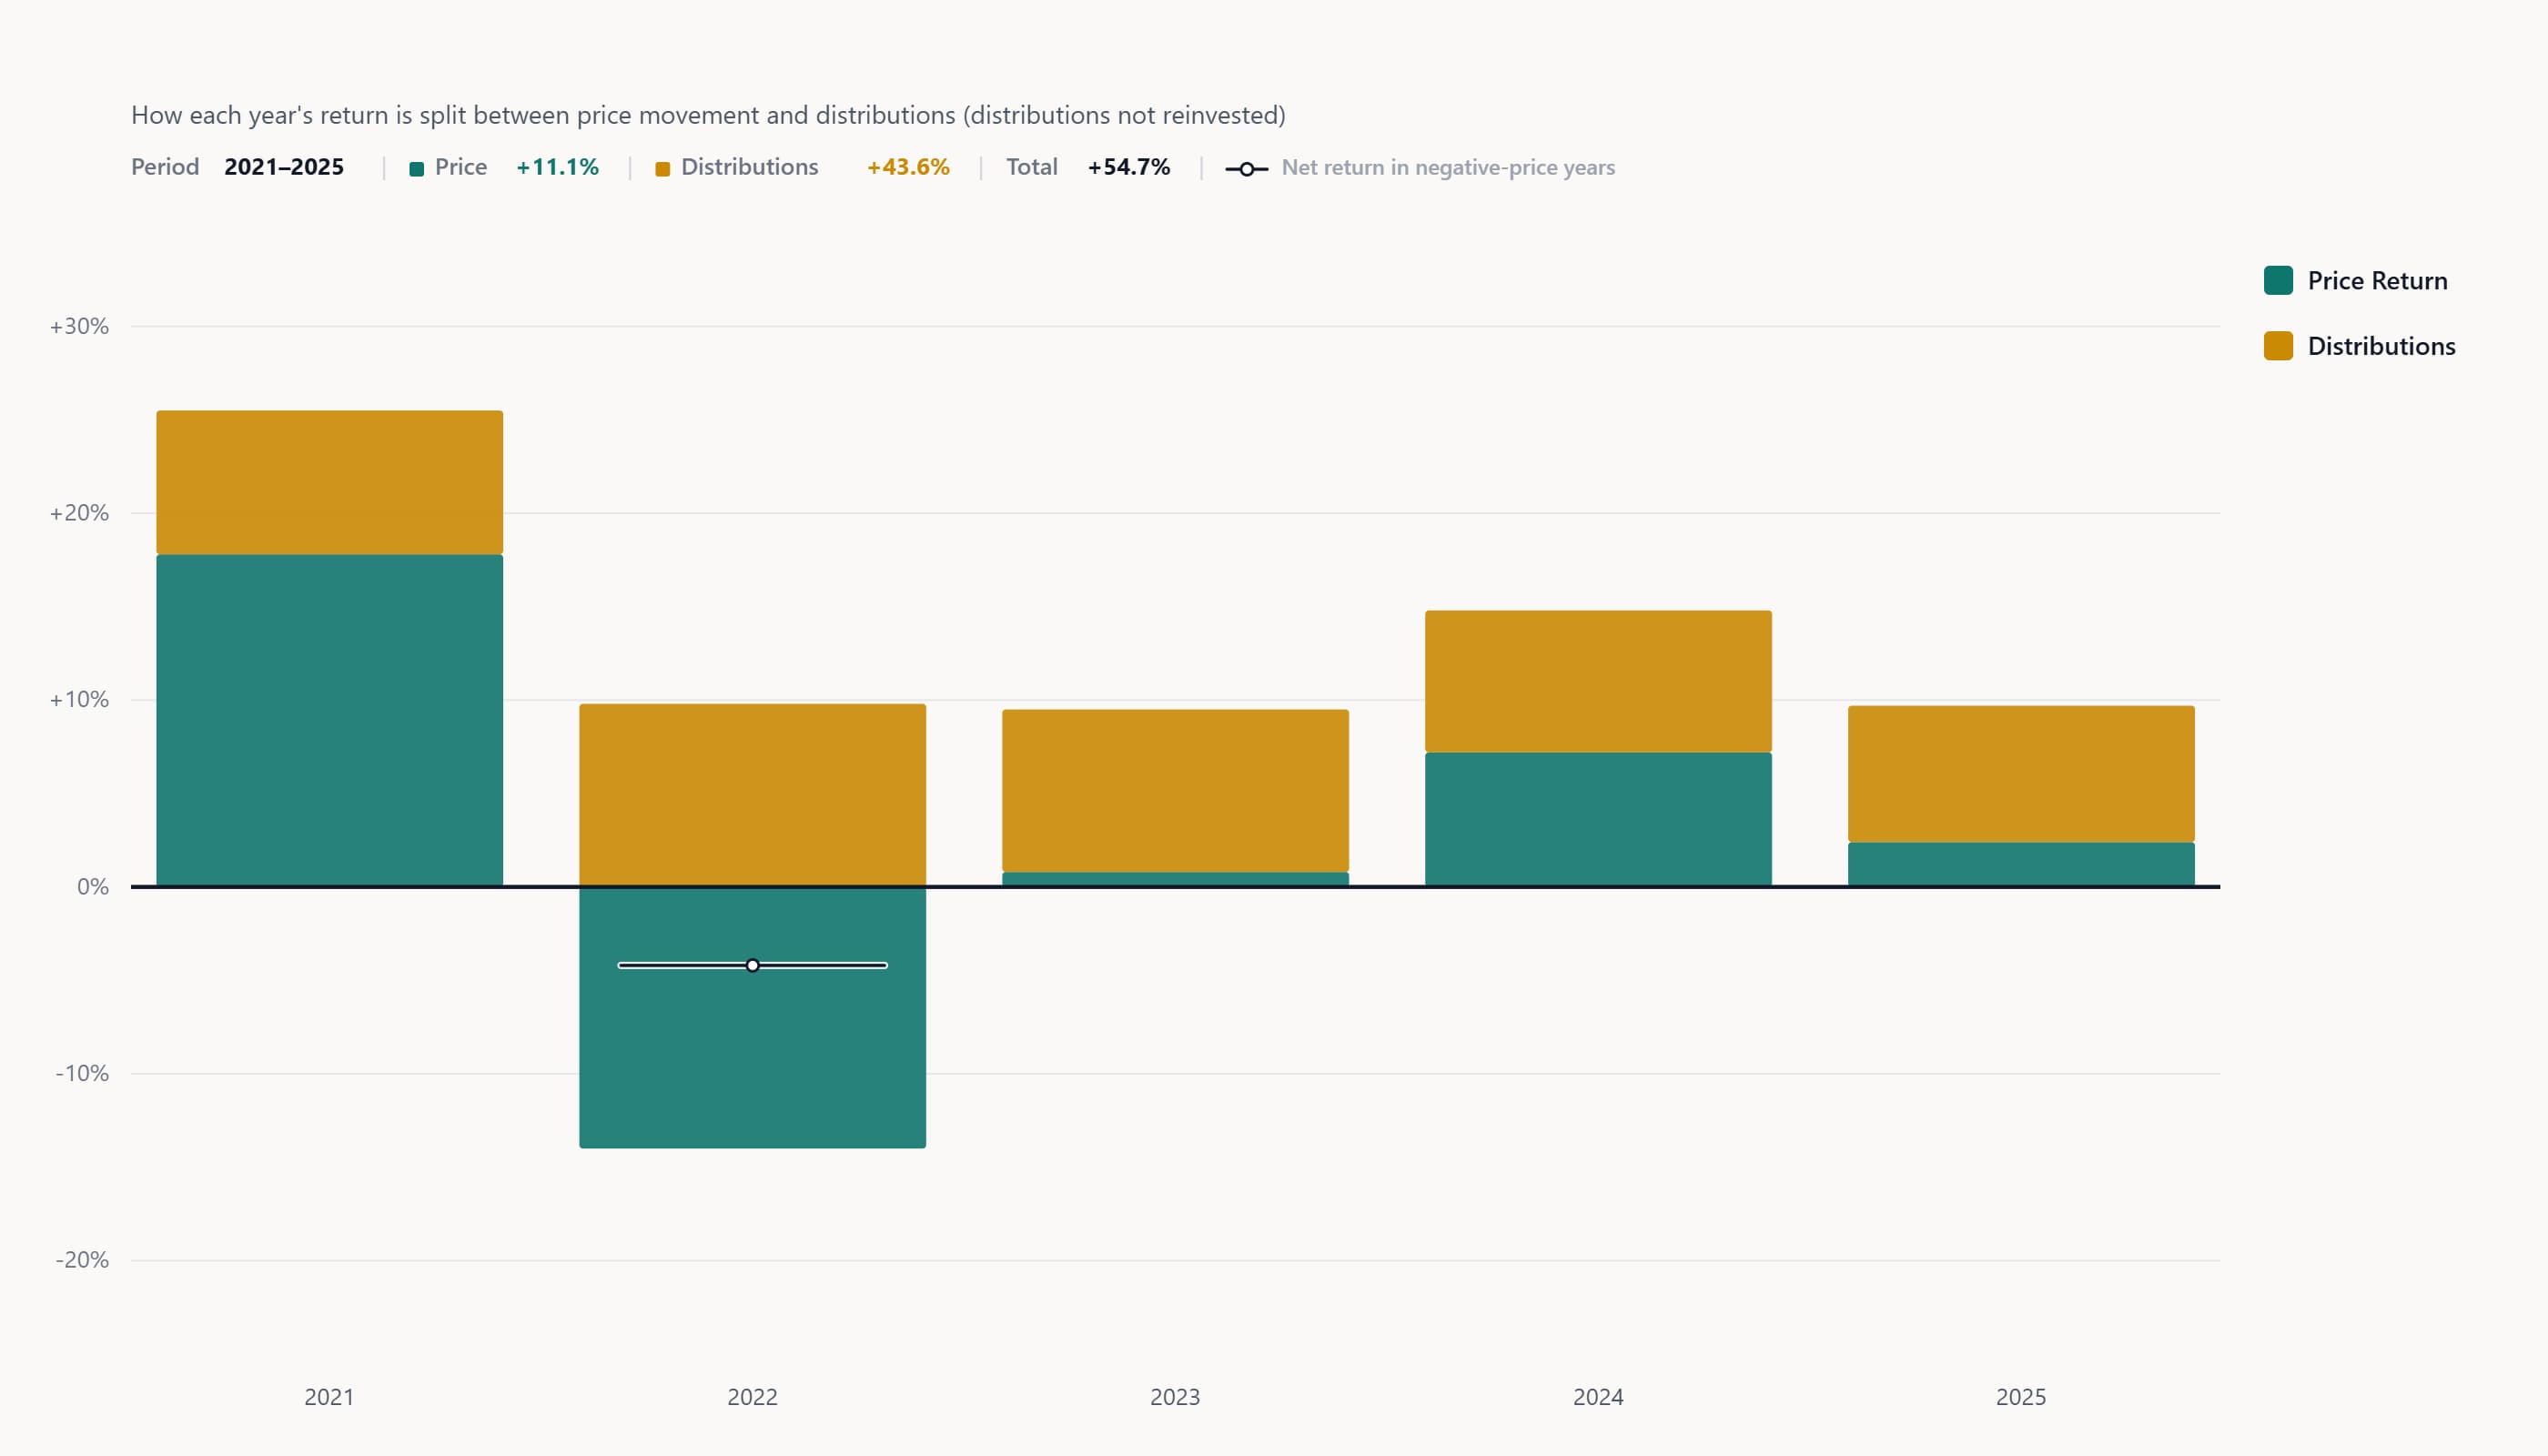
The contrast is especially clear when comparing individual years.
In 2021, JEPI recorded a 17.8% price return while distributions contributed another 7.7%, producing a combined 25.5% for the year.
The picture changed sharply in 2022. JEPI's price declined 14%, while distributions contributed 9.8%. The cash distributions offset a substantial portion of the price decline, but they did not eliminate it: the combined result was -4.2%.
2023 illustrates a different pattern. The share price gained just 0.8%, while distributions contributed 8.7%, bringing the combined result to 9.5%. In this case, most of the positive result shown in the chart came from cash distributions rather than price appreciation.
The two components were much closer in 2024. Price appreciation contributed 7.2% and distributions contributed 7.6%, for a combined 14.8%.
In 2025, price appreciation was 2.4%, compared with 7.3% from distributions, producing a combined 9.7%.
Zooming out across the full 2021–2025 period makes the distinction even clearer. JEPI's price return was 11.1%, while its distribution return was 43.6%. Combined, without reinvesting the distributions, the result was 54.7%.
The important point is not simply the final percentage. It is the composition behind it. Price movement ranged from a strong positive year to a double-digit decline, while distributions remained a positive component in every year shown.
Final Takeaway
Looking at price and distributions separately provides a clearer picture of how an income-focused investment behaved over time.
For JEPI from 2021 through 2025, the contribution from cash distributions was much larger than the contribution from share-price appreciation across the full period. At the same time, individual years show why both components matter: distributions could supplement positive price returns or offset part of a decline, but they did not prevent a negative combined result in 2022.
DividendXray visualizations are designed to make these different components of dividend and income investments easier to examine side by side.