MO vs PM vs BTI vs UVV: 10-Year Tobacco Dividend Stock Battle
Portfolio Overview
In this DividendXray battle, we compare four major tobacco stocks across dividend growth, yield-on-cost expansion, and price return performance over a ten-year period.
- MO (Altria) is one of the largest U.S. tobacco companies and is best known for Marlboro in the U.S. market.
- PM (Philip Morris International) operates internationally and has increasingly shifted toward smoke-free products.
- BTI (British American Tobacco) combines a large global cigarette business with a growing portfolio of alternative nicotine products.
- UVV (Universal Corporation) takes a different approach, supplying tobacco leaf and other plant-based ingredients rather than primarily selling branded tobacco products.
The four companies provide different forms of exposure to the tobacco industry, making the comparison useful for examining how their income growth and historical performance have differed.
Category Winners
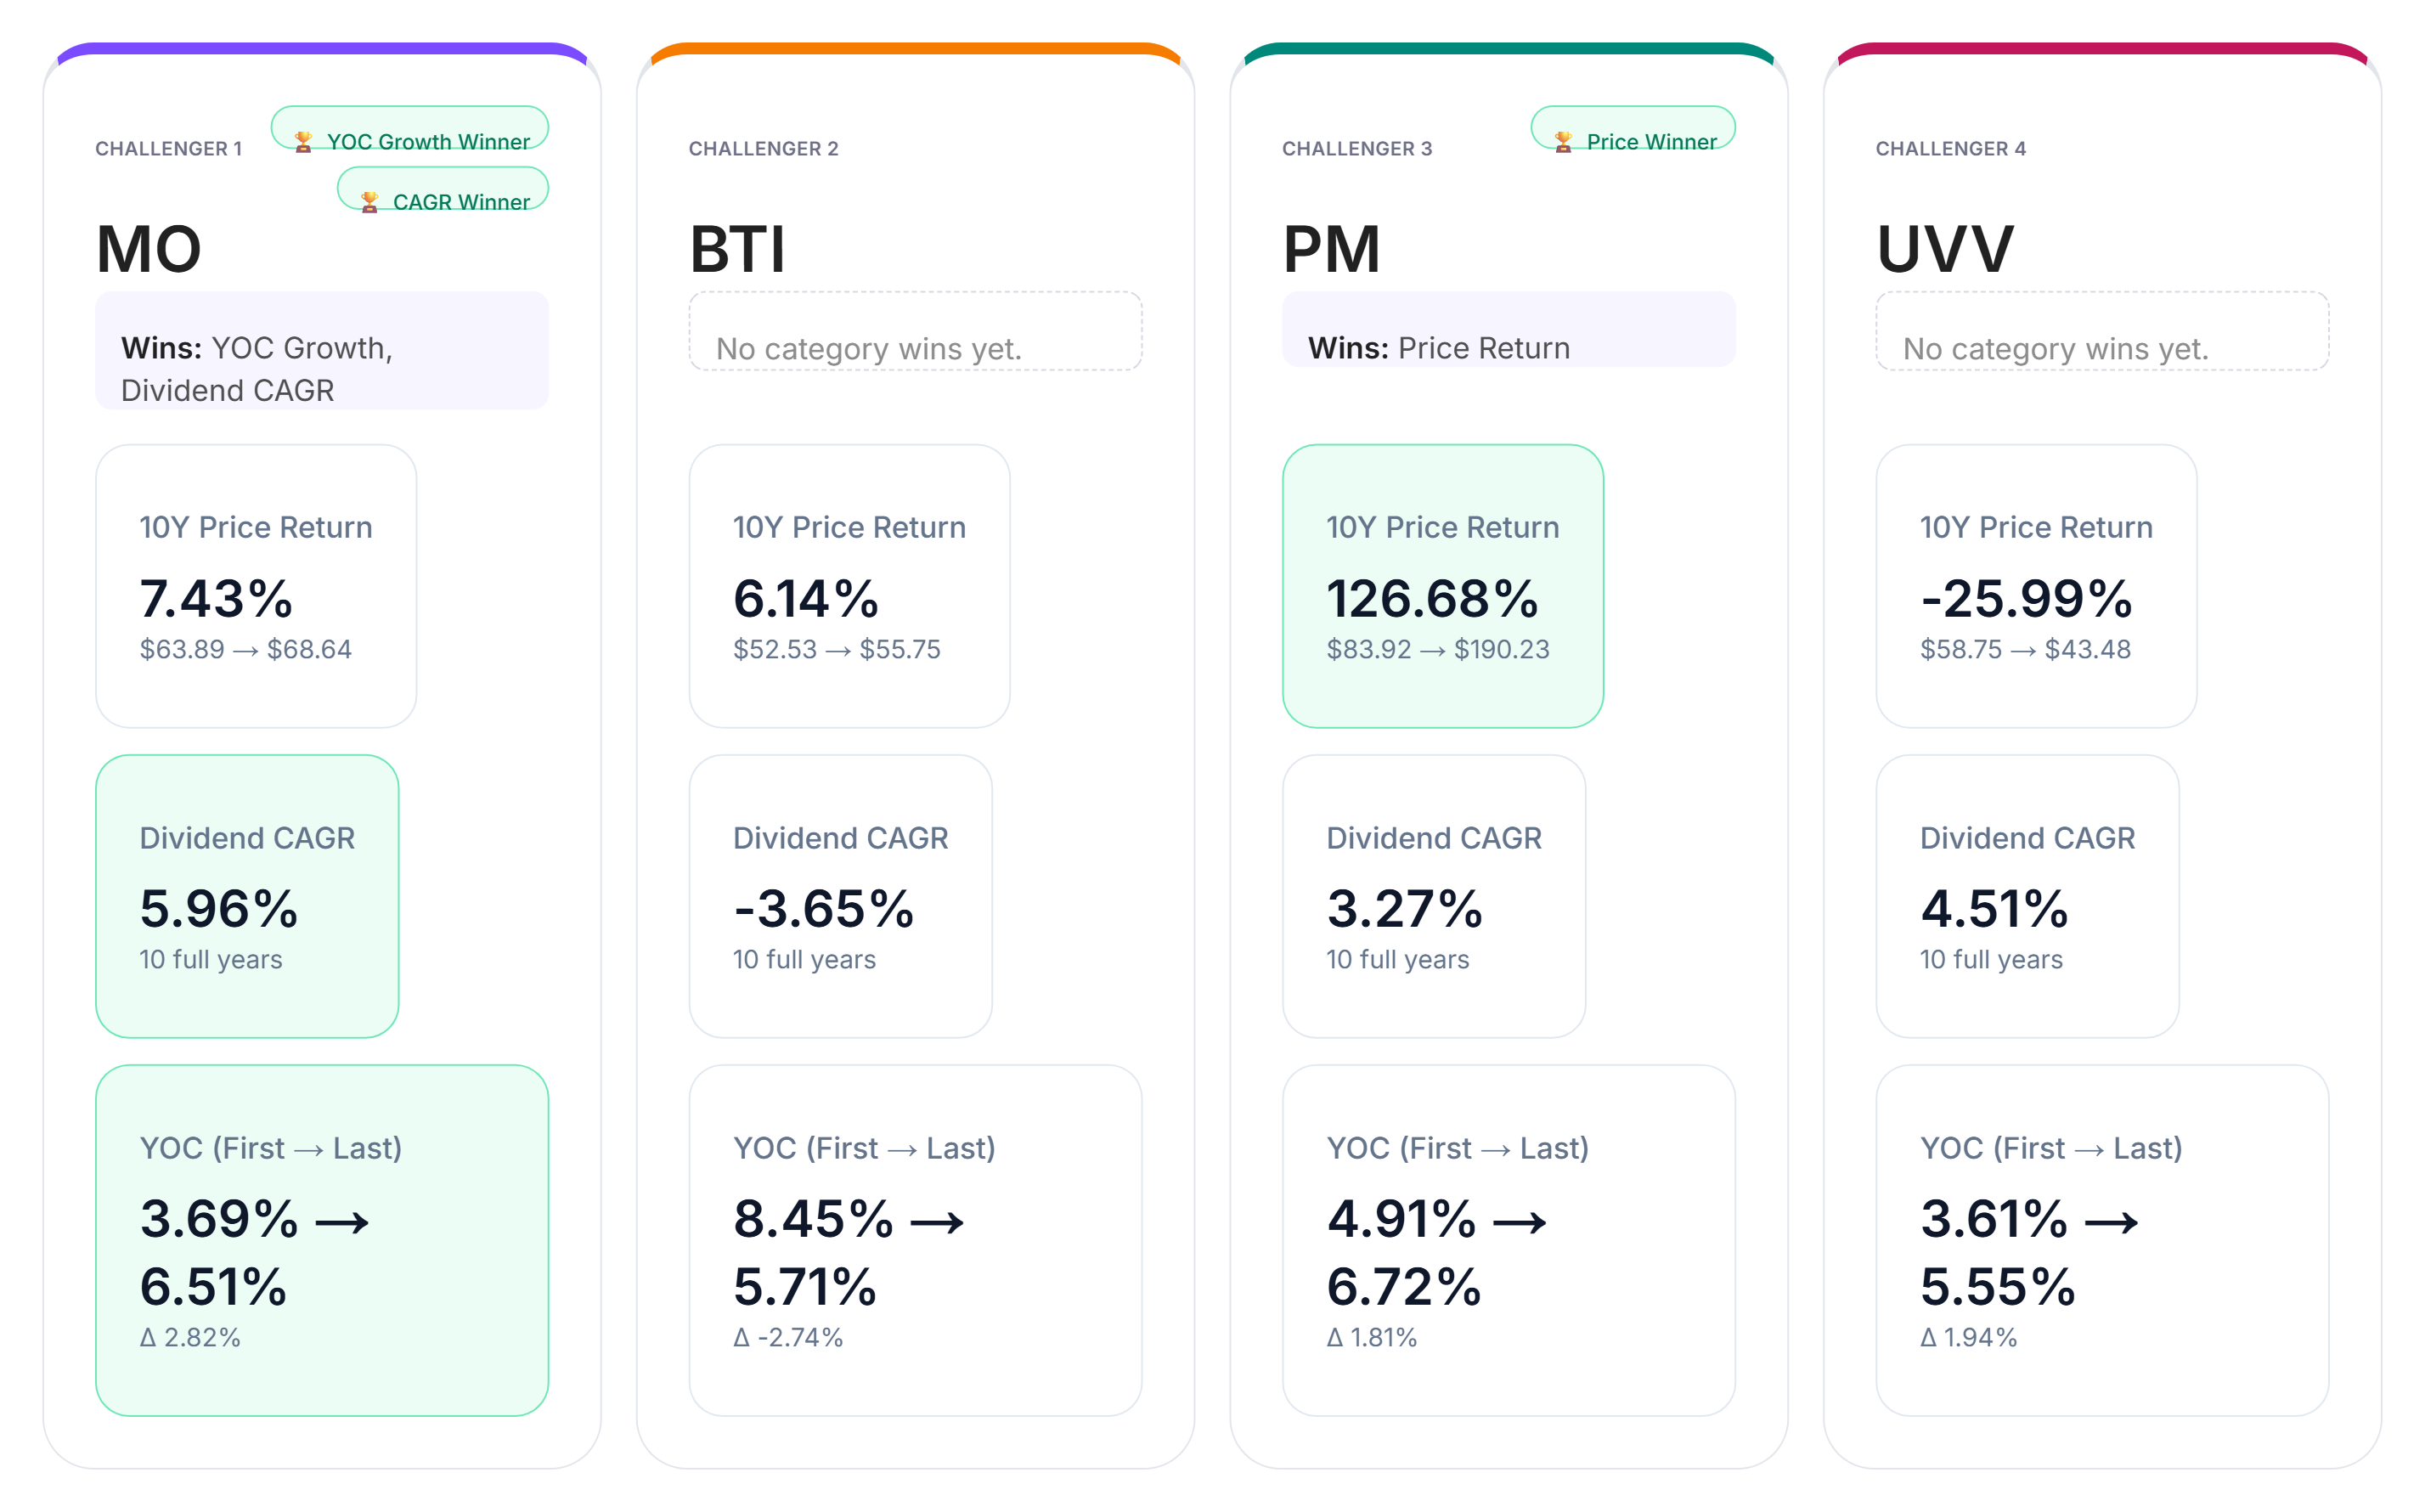
Looking at the ten-year data across dividend CAGR, yield-on-cost growth, and price return, two companies emerge as category leaders.
In dividend growth, MO leads the group with a ten-year dividend CAGR of 5.96%.
BTI appears to have negative dividend growth when measured in U.S. dollars, but this is largely due to currency fluctuations rather than dividend cuts in its home currency.
For yield-on-cost growth, MO again takes the lead, showing the strongest improvement from the first year to the last.
In price return, PM comes out ahead with a ten-year return of 126.68%.
The results illustrate an important distinction between income growth and price appreciation. The company producing the strongest dividend-growth result over the period is not necessarily the same company delivering the strongest price return.
Yield-on-Cost by Year
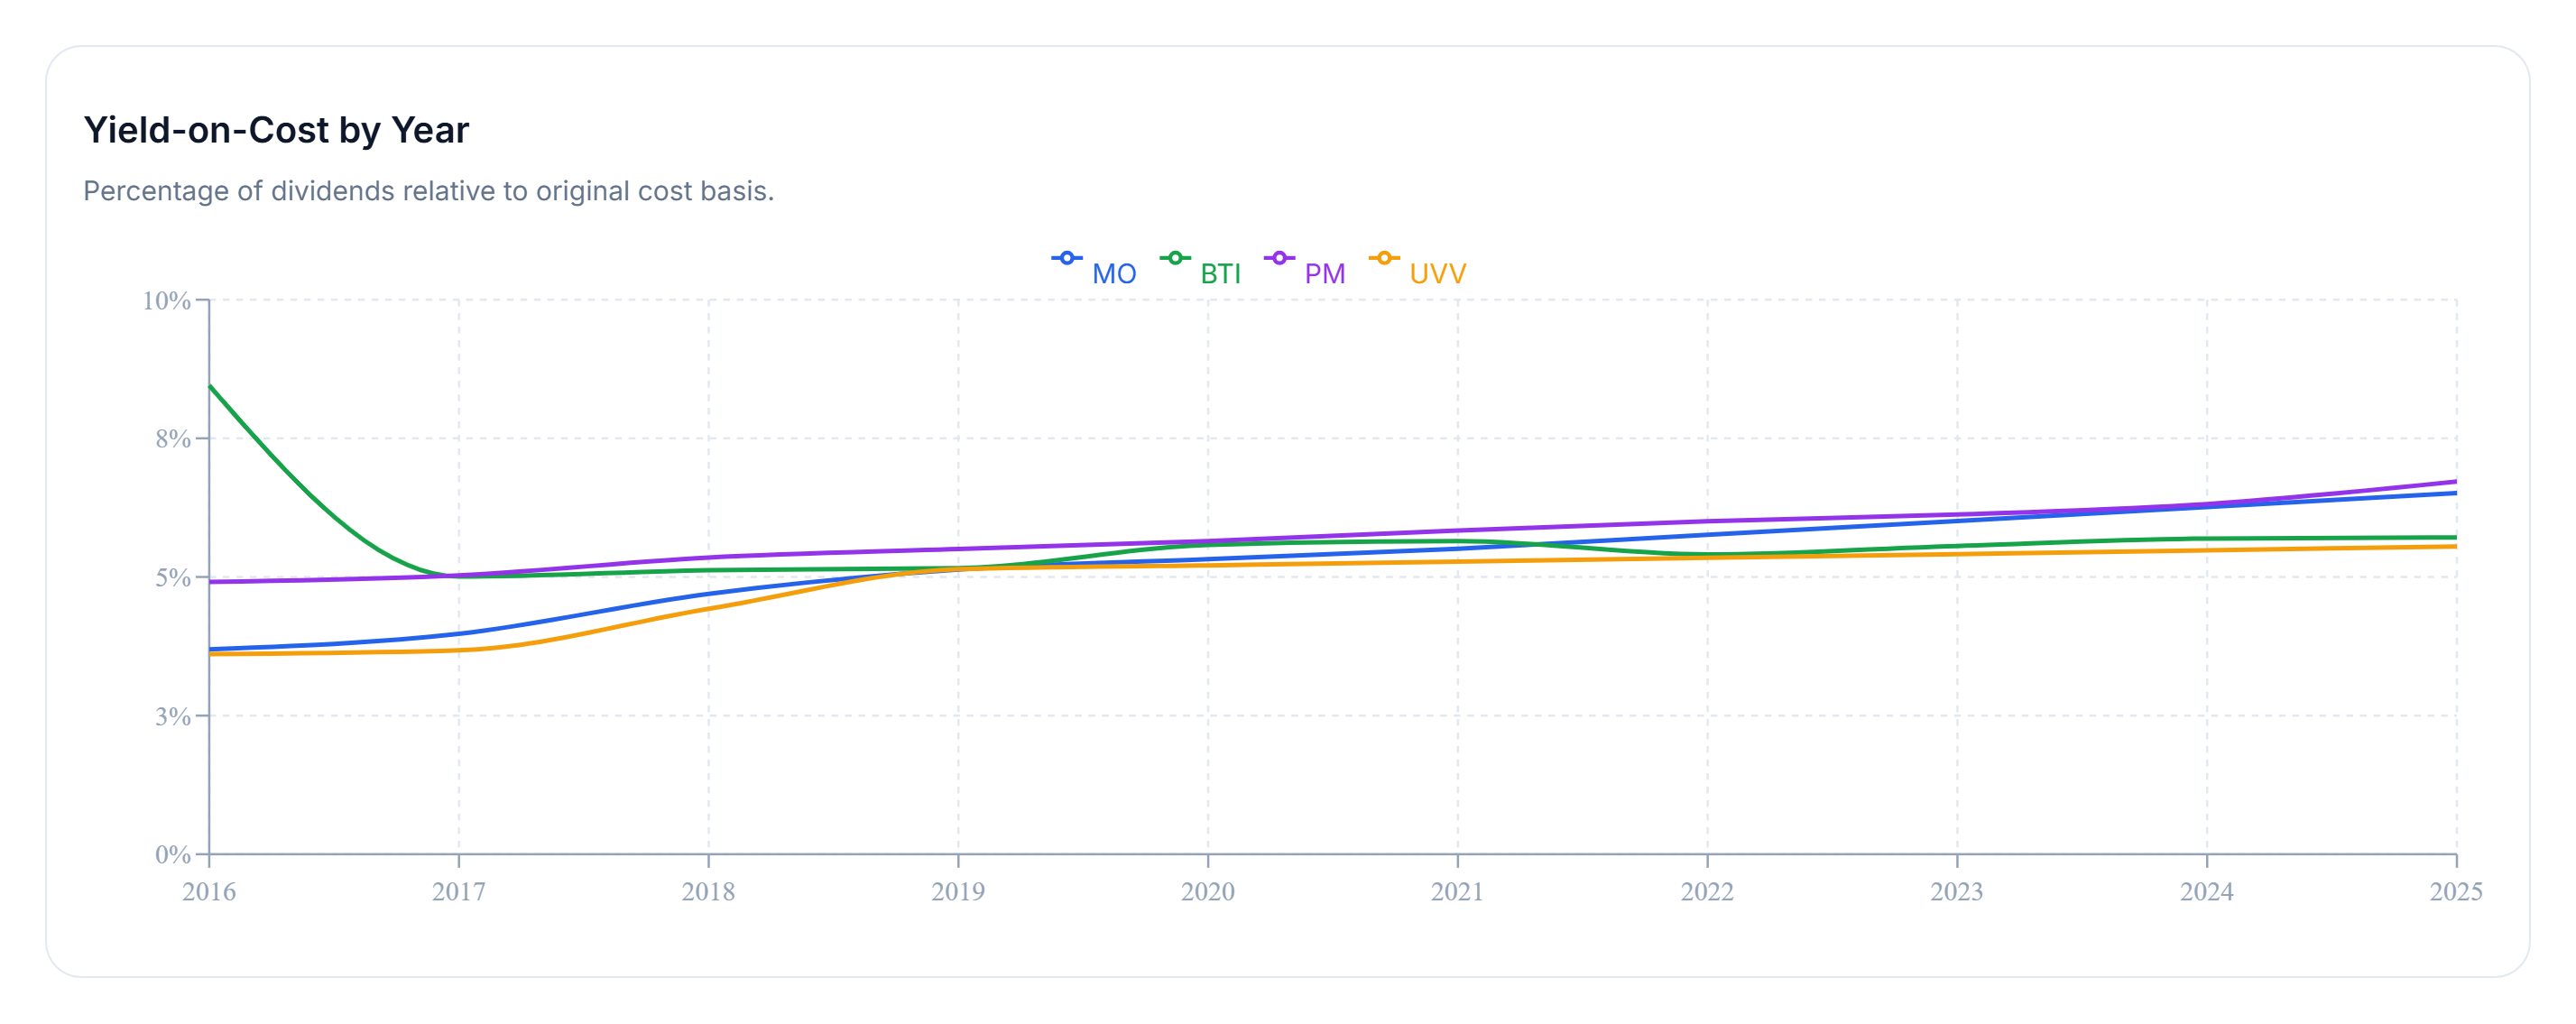
Yield on cost measures dividend income relative to the original investment rather than the stock's current market price. This makes it useful for seeing how the income generated by an original investment changes over time.
Across this ten-year comparison, PM stands out by reaching a yield on cost of approximately 6.72% by the end of the period.
The chart adds another dimension to the historical battle. Dividend CAGR measures the pace at which distributions changed, while yield on cost shows what that dividend growth ultimately means relative to the capital originally invested.
For long-term dividend investors, the distinction matters because today's current yield provides only a snapshot. Yield on cost instead shows how the income produced by an existing investment can evolve as dividends change over time.
Now let's shift from historical performance to today's income picture.
Income Goal Comparison
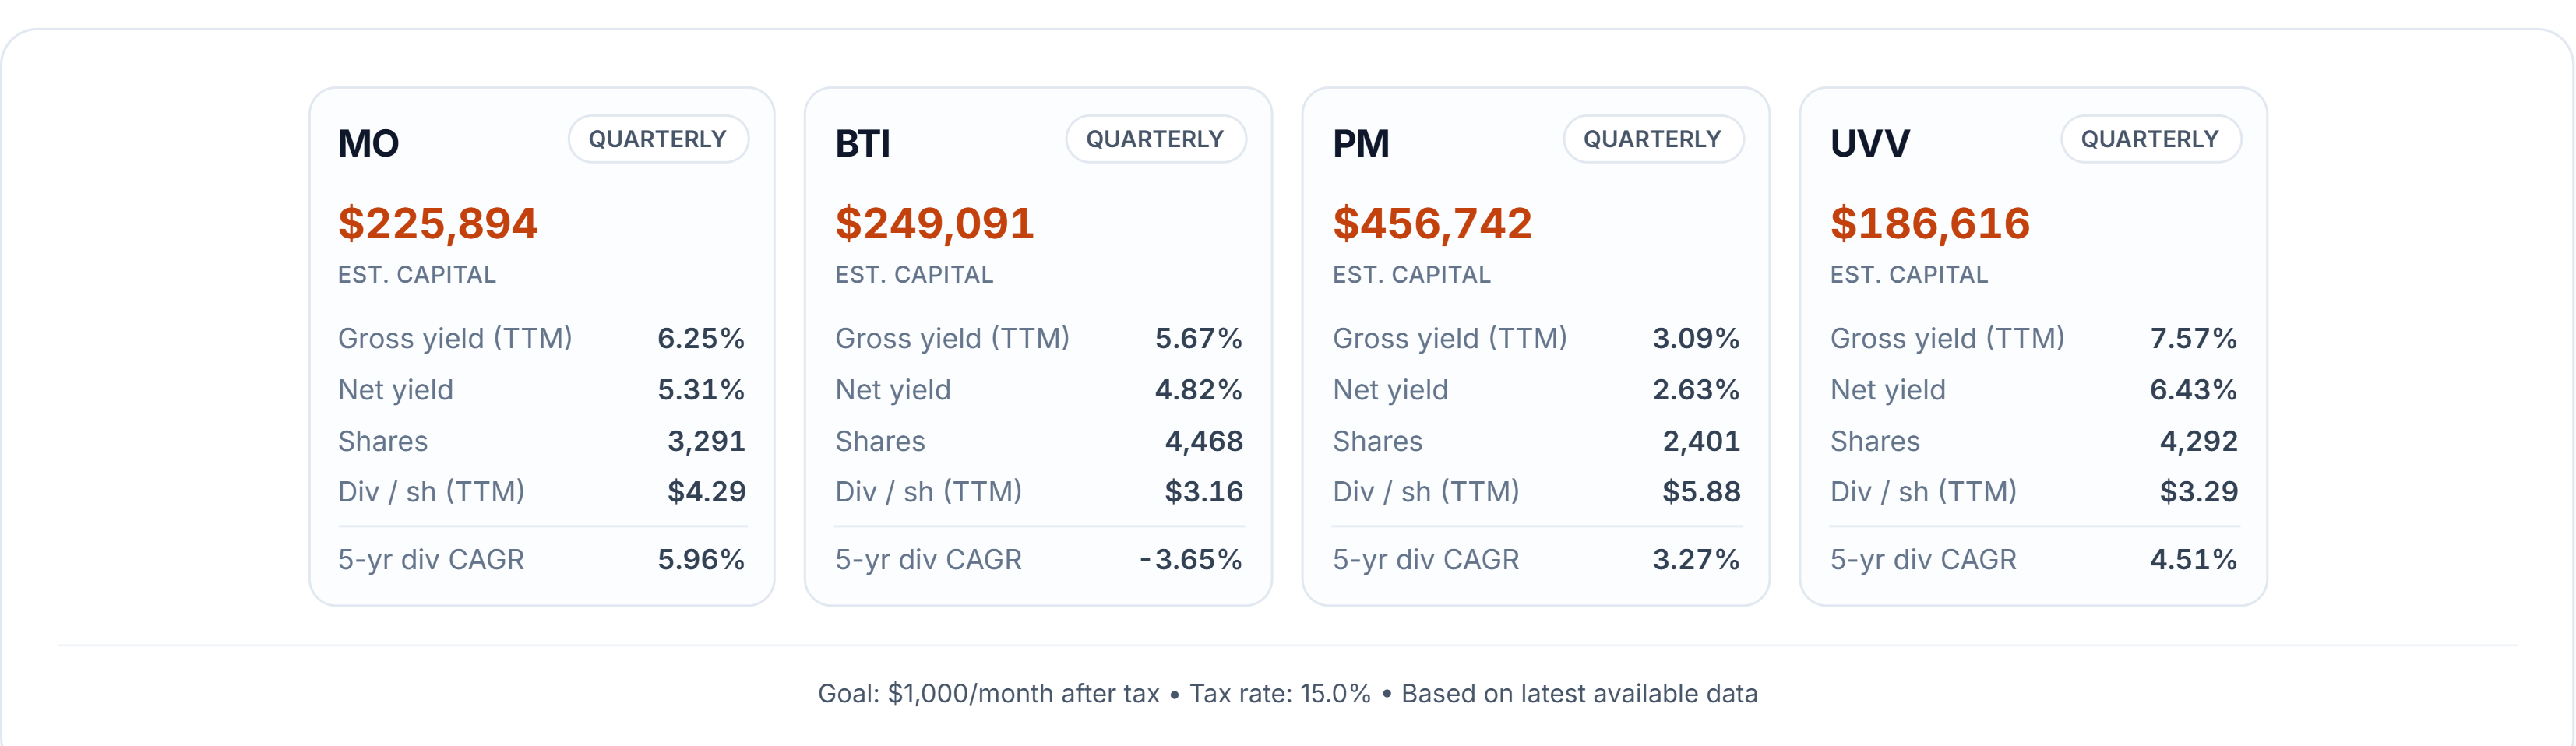
How much capital would each stock require today to generate $1,000 per month in after-tax dividend income?
Using a 15% tax assumption, UVV requires the least capital among the four stocks at roughly $186,616, supported by a current yield near 7.6%.
At the other end of the comparison, PM requires the most capital at approximately $456,742, with a current yield near 3.1%.
MO and BTI sit between those two extremes, balancing current yield with dividend growth.
This highlights the tradeoff between starting income and the amount of capital required to reach a specific income target. A higher current yield can substantially reduce the capital needed today, while a lower-yielding investment starts from a different income position.
But today's yield is only one part of the picture. The next question is what could happen if dividend growth continues.
Yield Catch-Up Timeline
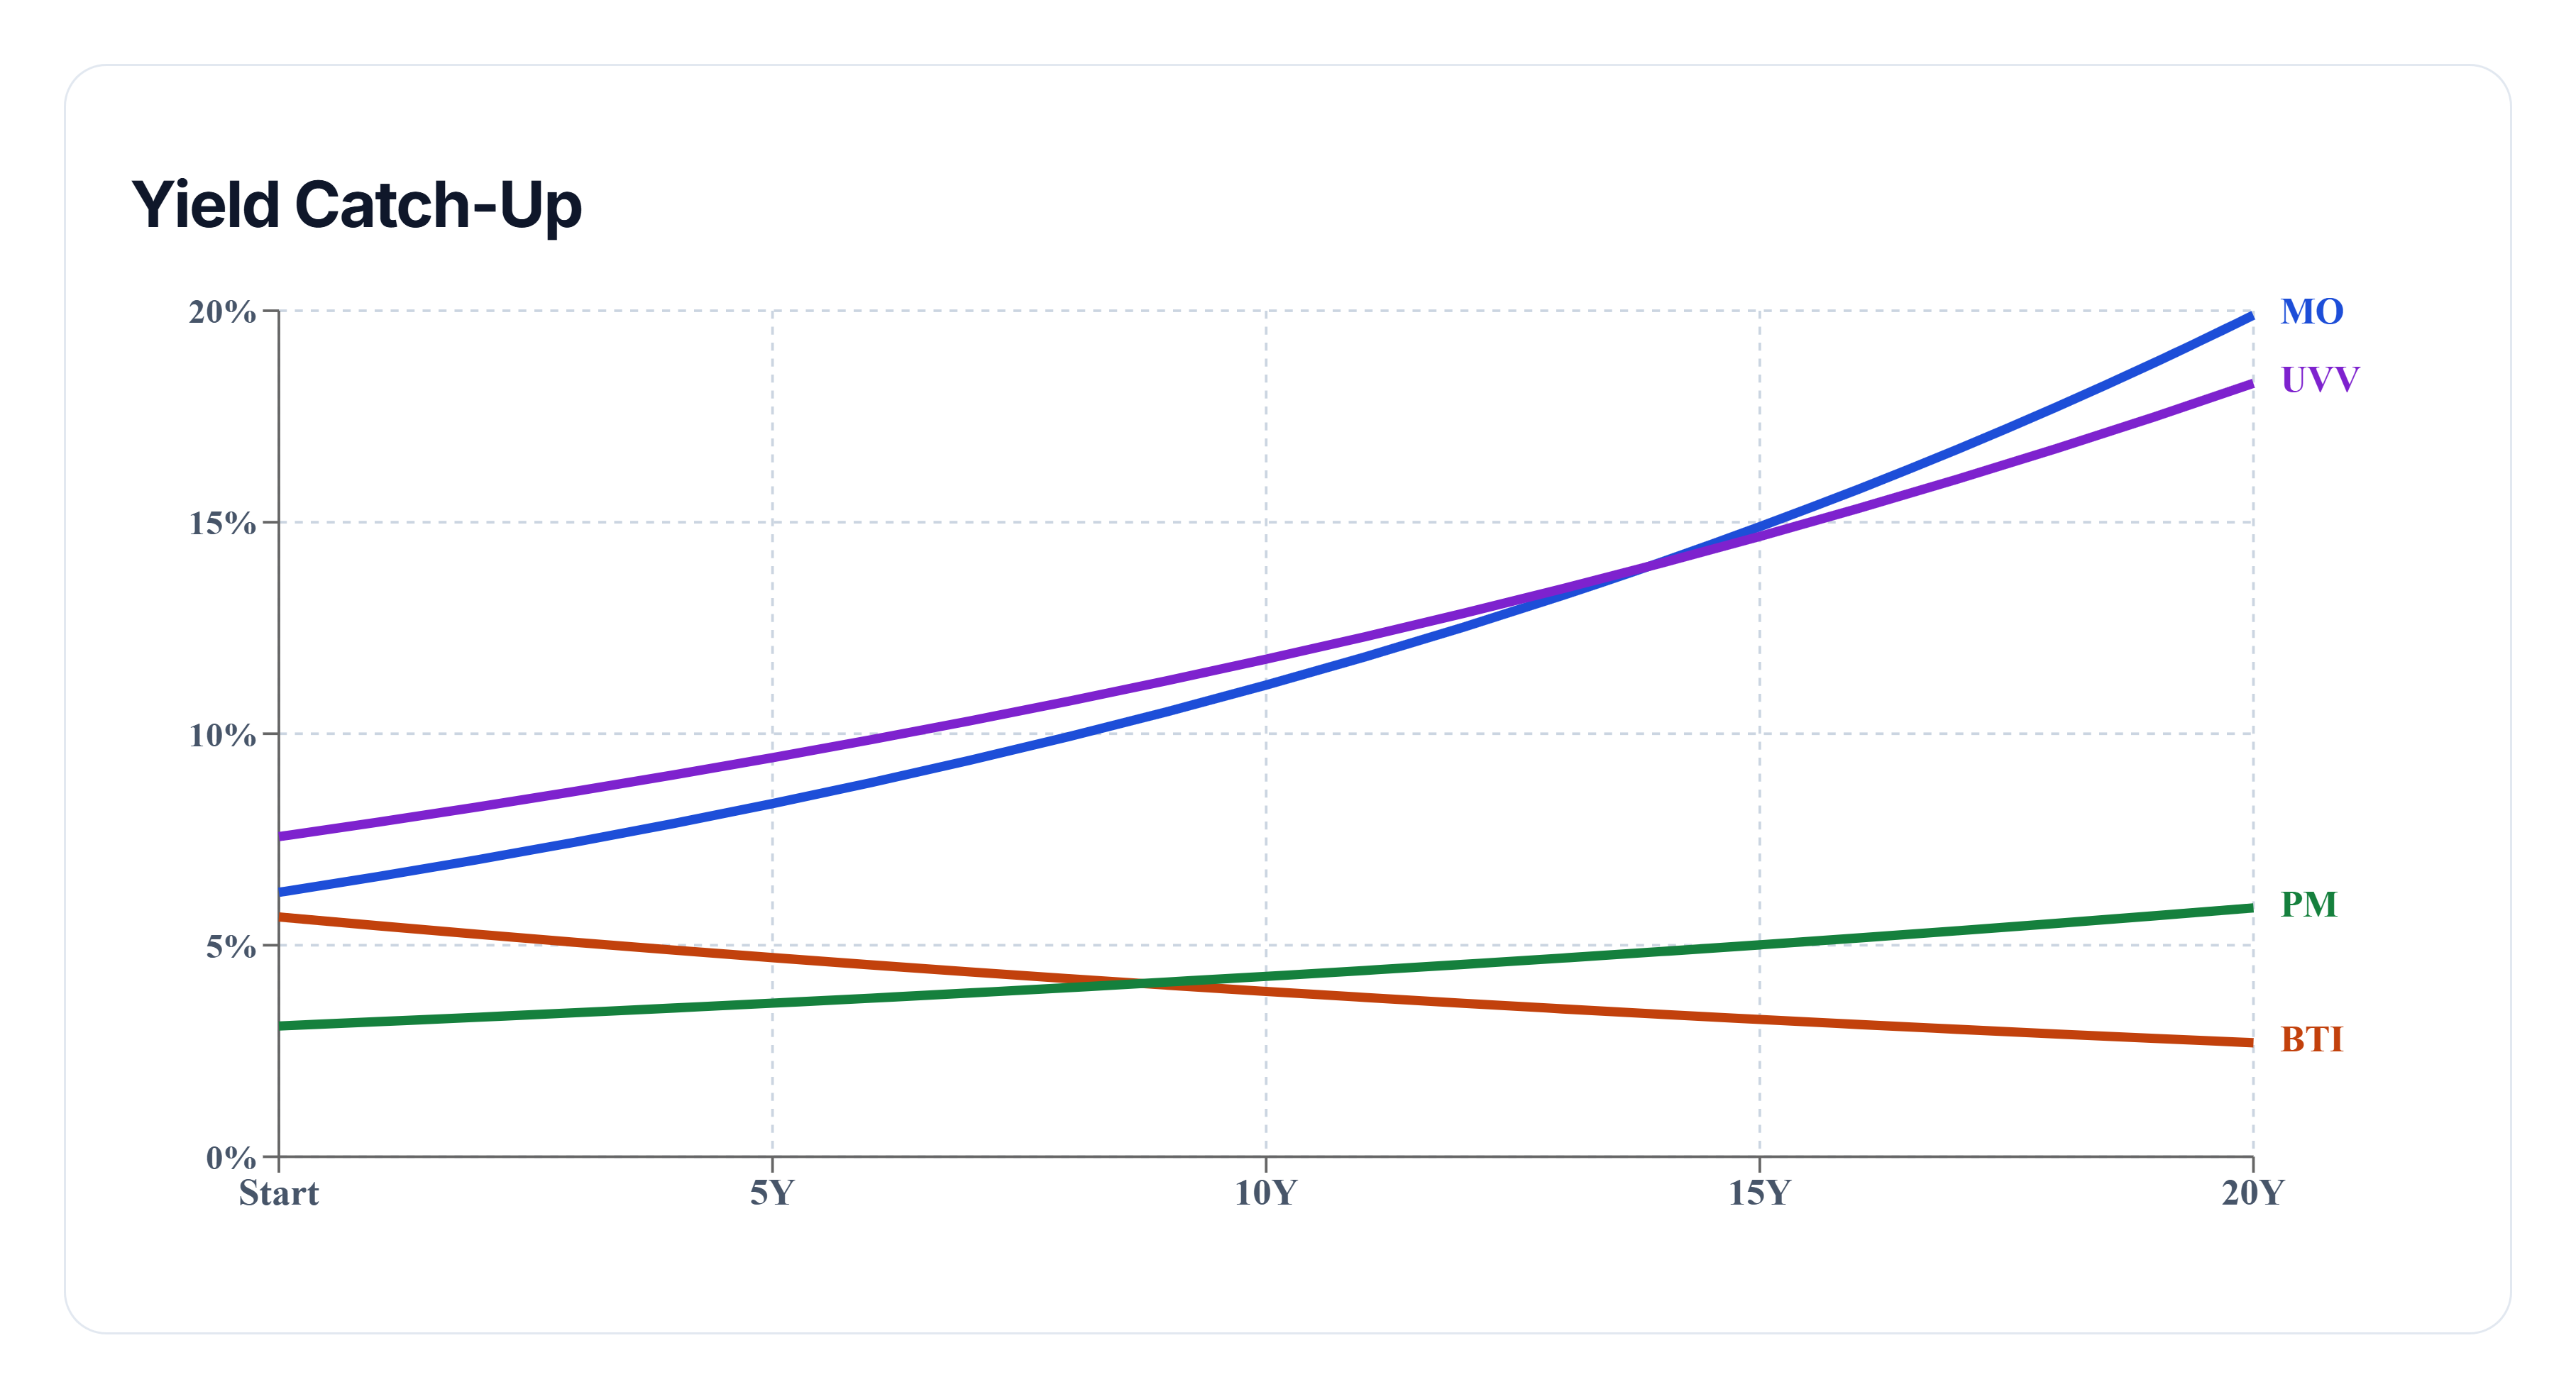
The yield catch-up projection looks forward by assuming that future dividend growth continues at a pace similar to each holding's ten-year dividend CAGR.
MO enters the projection with the strongest modeled dividend growth rate, near 6%, while UVV starts with the highest current yield, near 7.6%.
PM begins from a much lower current yield of approximately 3.1%.
The purpose of the projection is to illustrate how differences between starting yield and dividend growth could affect yield on cost over time. A lower starting yield can potentially narrow the gap through stronger dividend growth, while a high starting yield begins with a substantial income advantage.
In this comparison, that starting gap remains significant: even after twenty years, PM still does not catch UVV on projected yield on cost.
The projection is illustrative rather than predictive. It assumes historical dividend growth continues forward, while actual future dividend growth can differ.
Final Takeaway
This ten-year battle highlights different strengths among MO, PM, BTI, and UVV.
MO leads the historical dividend-growth comparison with a 5.96% ten-year dividend CAGR and shows the strongest improvement in yield on cost from the first year to the last. PM leads historical price performance with a 126.68% ten-year return and reaches approximately 6.72% yield on cost by the end of the historical period.
When the comparison shifts to today's income picture, UVV's current yield near 7.6% translates into the lowest capital requirement shown for the $1,000 monthly after-tax target, at roughly $186,616. PM's yield near 3.1% results in the highest requirement, at approximately $456,742.
The forward projection adds the final piece of the story. Using each holding's ten-year dividend CAGR as the modeled growth rate, differences between starting yield and dividend growth can be followed over time. In this particular projection, PM does not close the yield-on-cost gap with UVV within twenty years.
Together, the three phases show why dividend comparisons can look very different depending on whether the focus is historical dividend growth, current income, or projected future income growth.