ABBV vs JNJ vs PFE vs BMY: Dividend Growth, Income & Yield-on-Cost Battle
Portfolio Overview
In this DividendXray battle, we compare four well-known pharmaceutical dividend stocks across historical dividend growth, yield-on-cost expansion, total return, current income potential, and long-term income projections.
AbbVie (ABBV) combines an above-average dividend yield with a strong record of dividend growth and capital appreciation. Johnson & Johnson (JNJ) is recognized for decades of dividend increases supported by a diversified healthcare business. Pfizer (PFE) currently offers the highest starting dividend yield in this comparison, making it attractive for investors focused on present income. Bristol Myers Squibb (BMY) balances shareholder income with continued investment in expanding its pharmaceutical portfolio.
Although all four companies operate within the healthcare sector, they approach shareholder returns differently. Comparing both historical performance and today's income picture helps illustrate those tradeoffs.
Category Winners
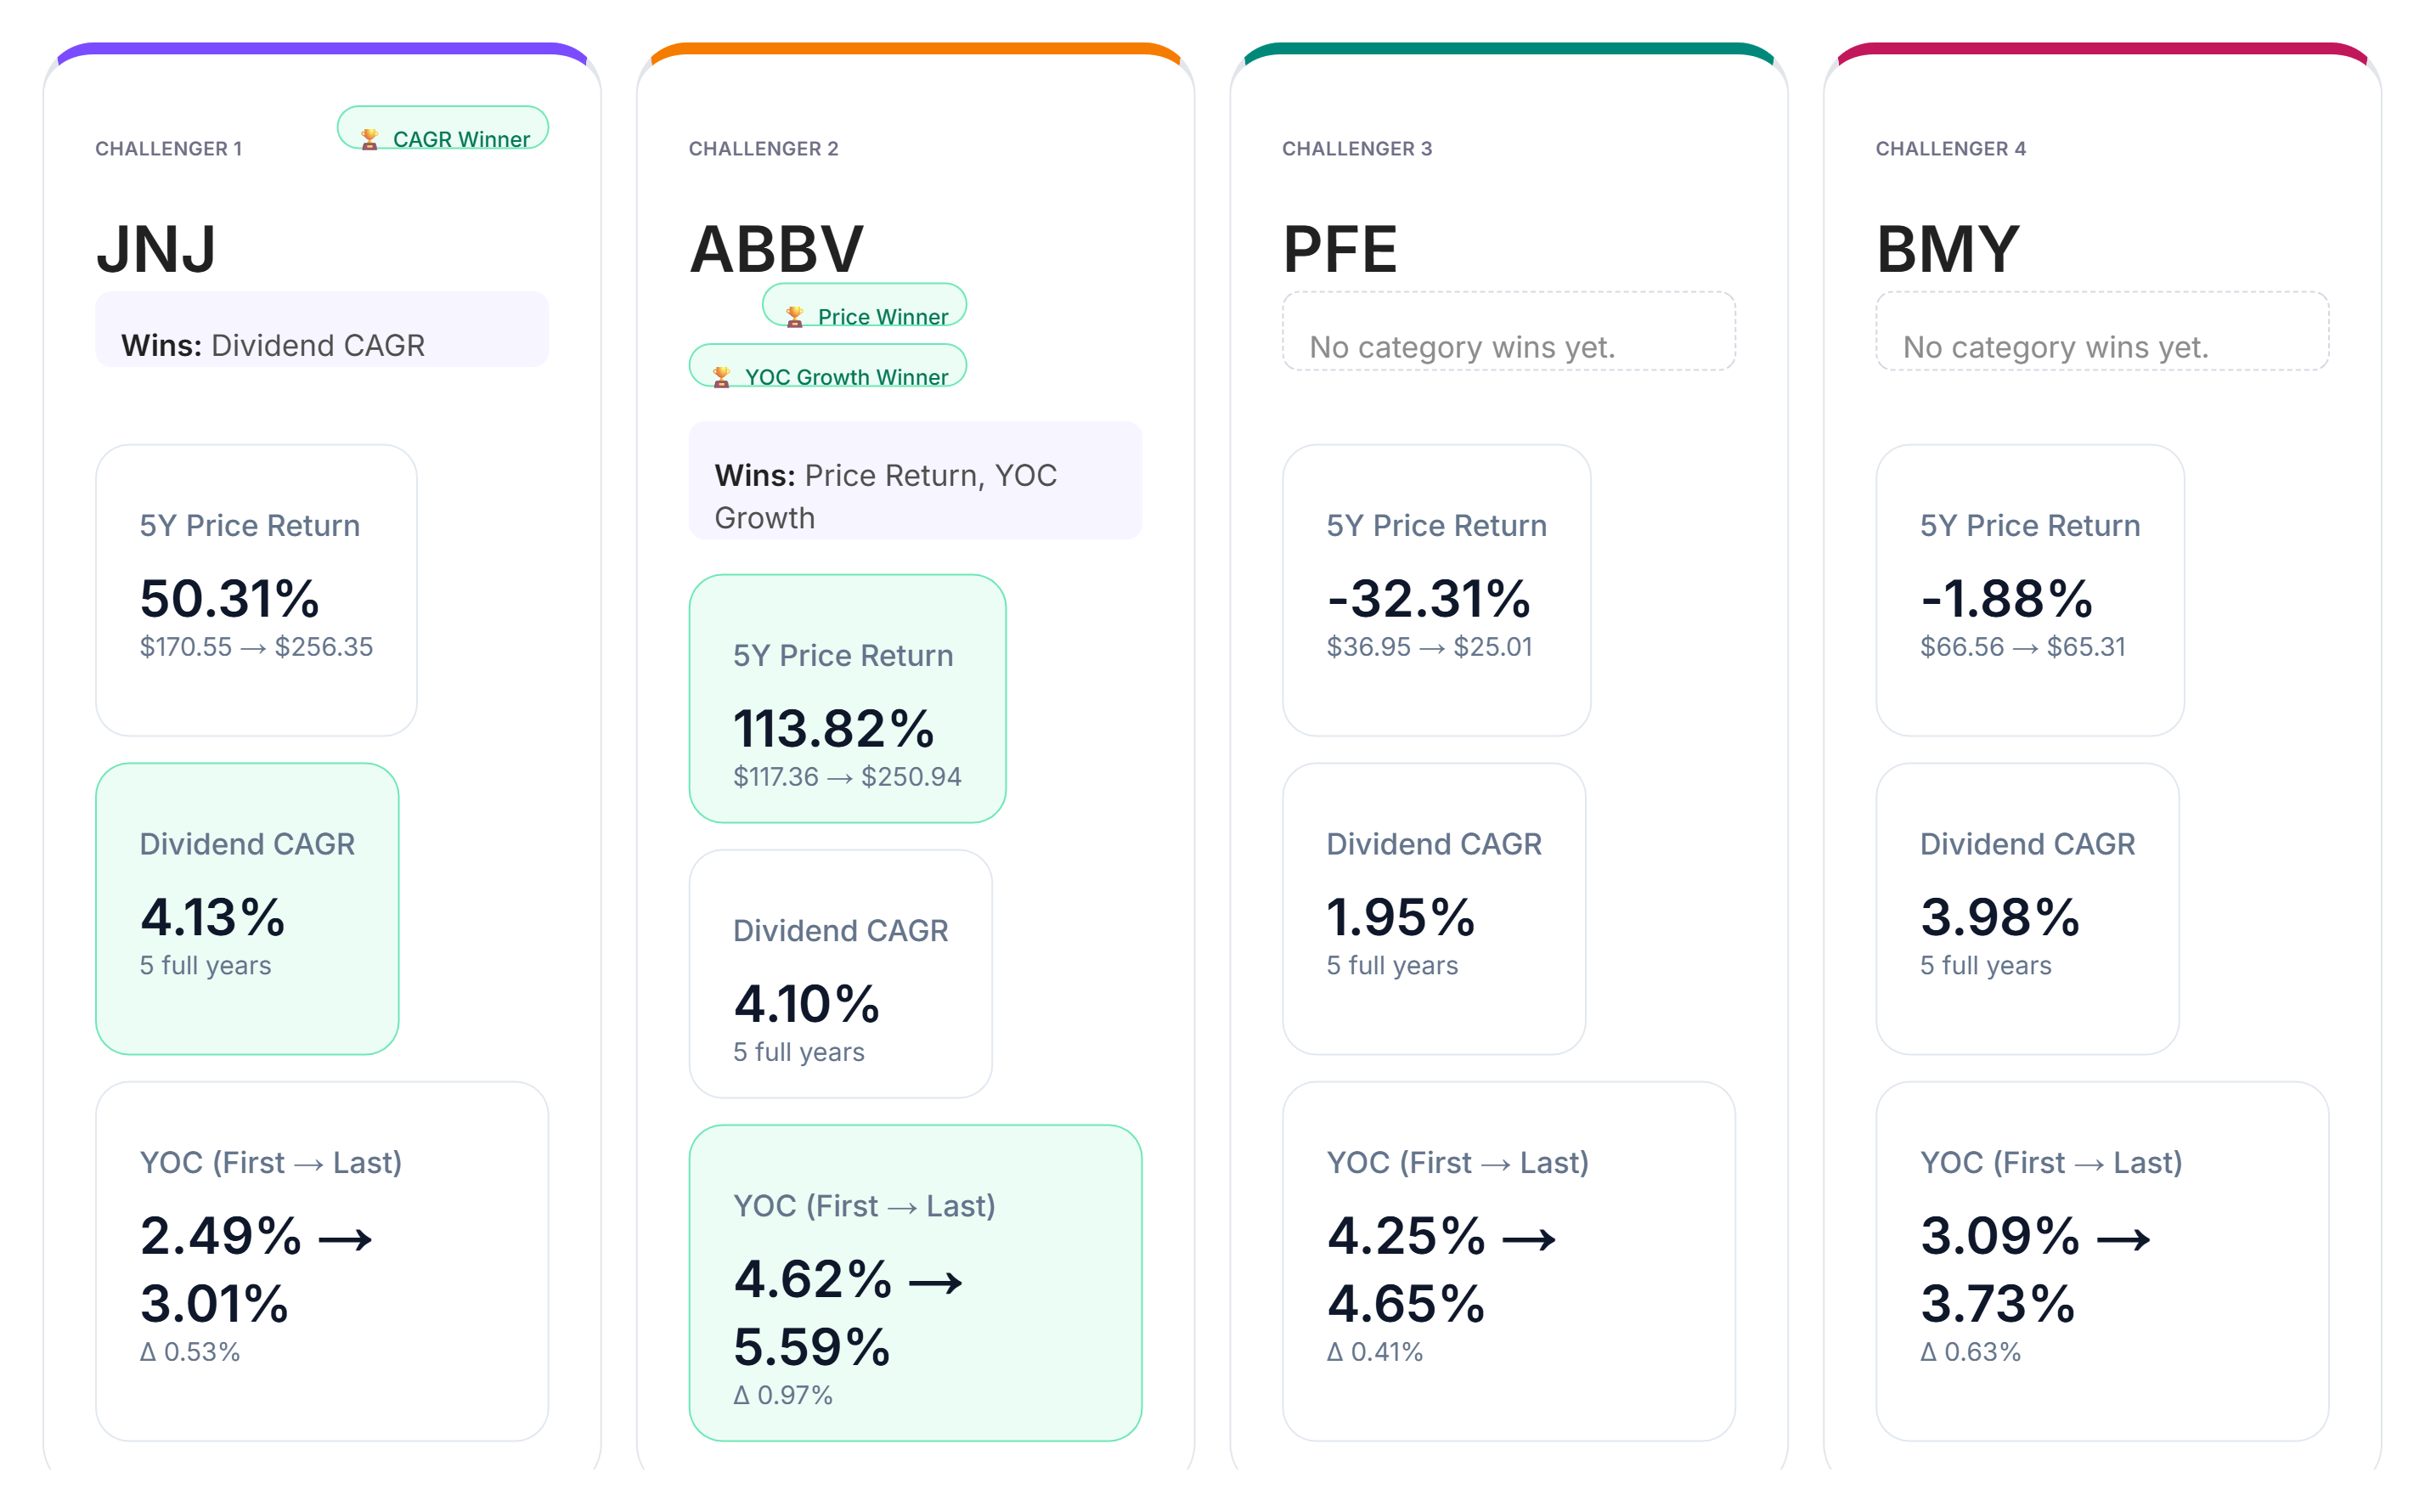
Looking at the historical data, each category highlights a different strength.
In dividend growth, JNJ leads the group with a five-year dividend CAGR of 4.13%, demonstrating the strongest pace of annual dividend increases.
For yield-on-cost growth, ABBV delivers the greatest improvement from the first year to the final year, reflecting the strongest increase in income generated from the original investment.
In price return, ABBV also finishes first with an impressive five-year gain of 113.82%, substantially outperforming the other pharmaceutical holdings in this comparison.
Rather than producing one dominant winner across every metric, the results show how different strategies can excel depending on whether the focus is dividend growth, income efficiency, or capital appreciation.
Yield-on-Cost by Year
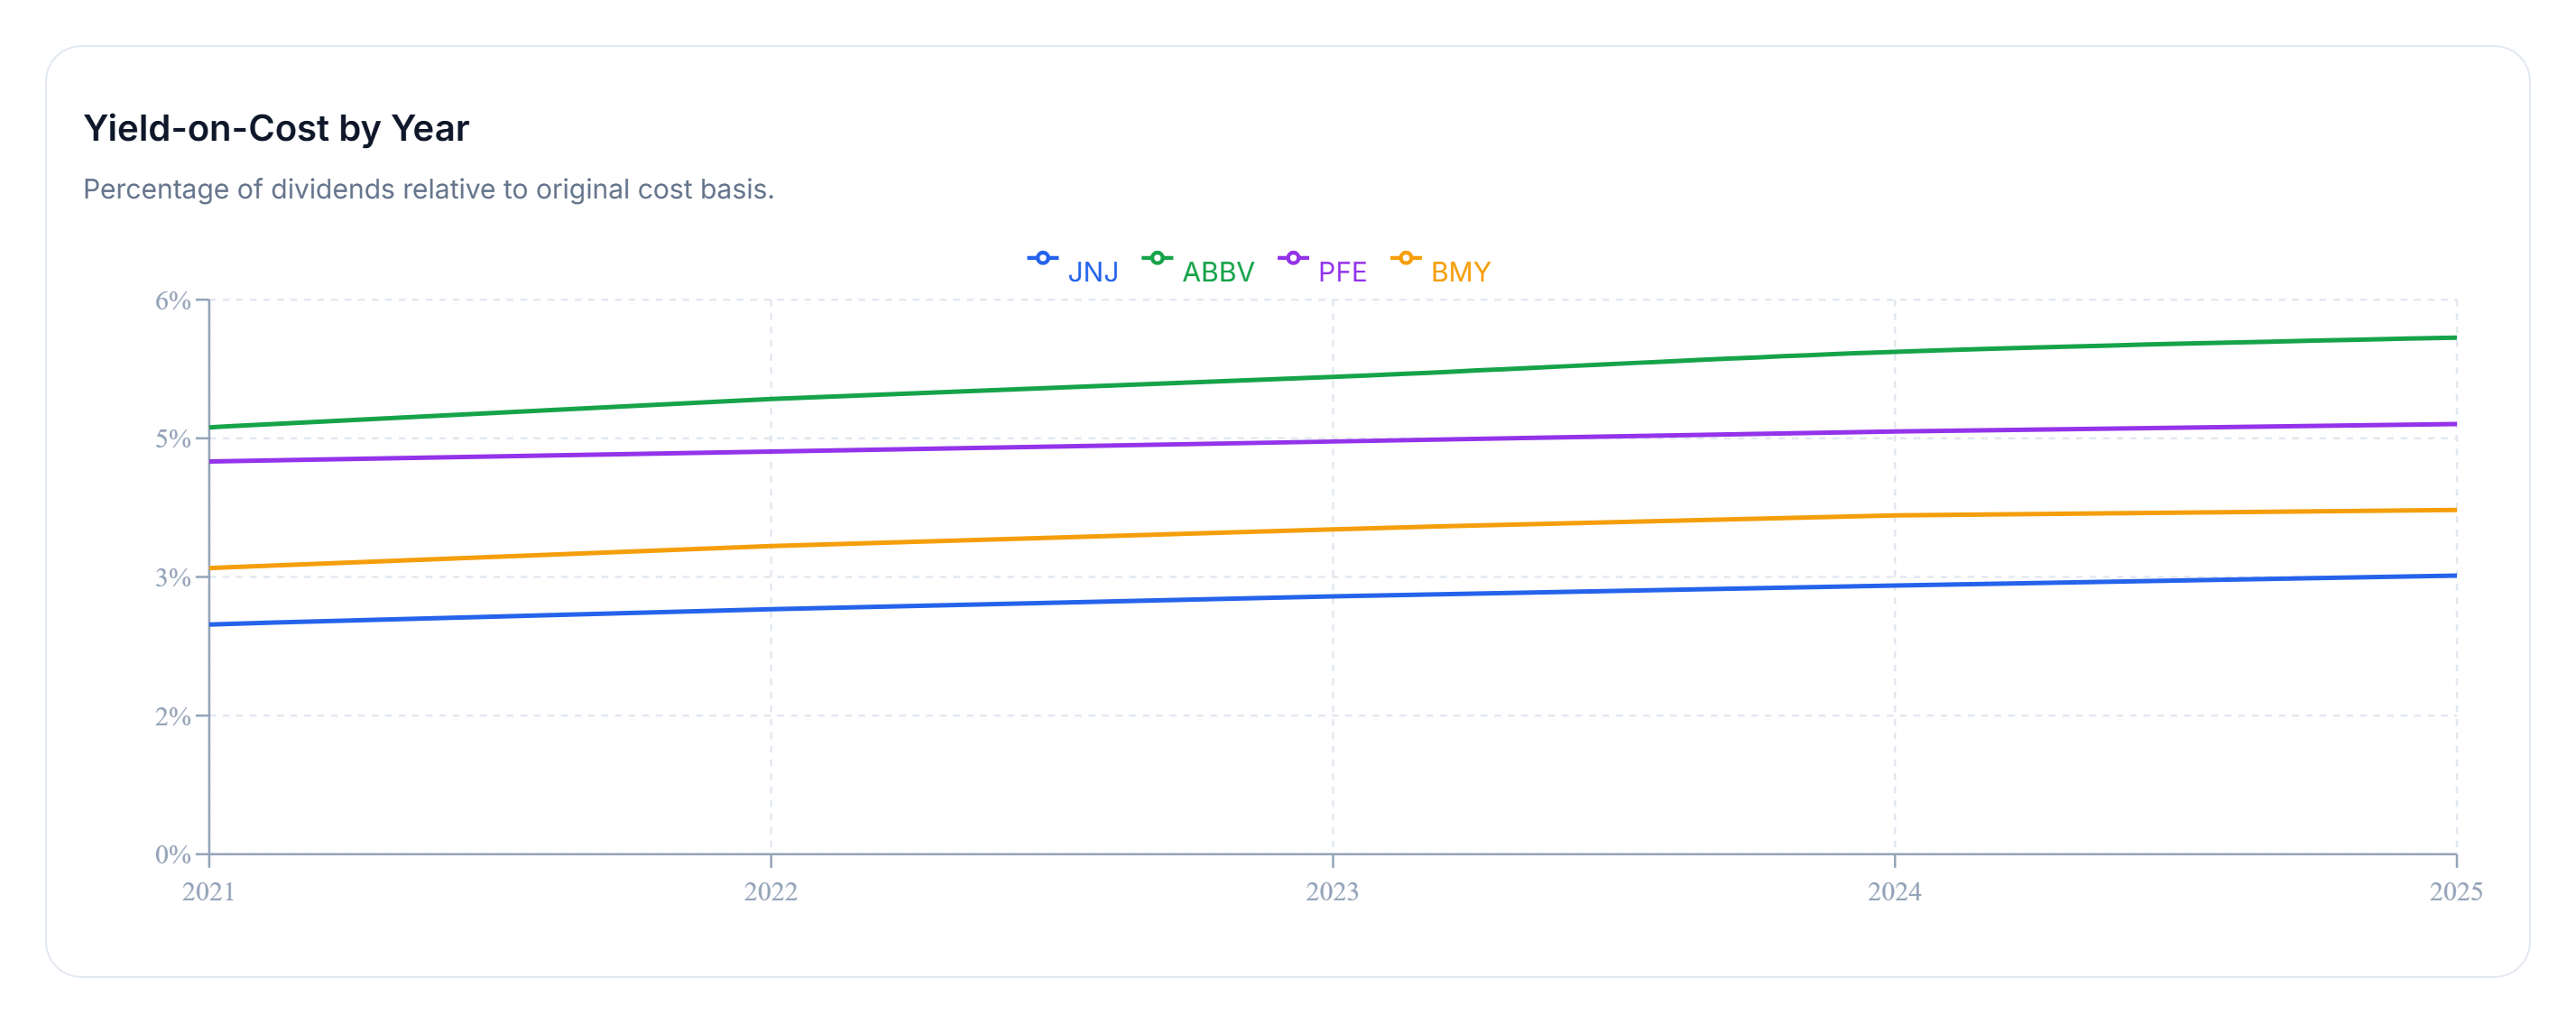
Yield on cost measures annual dividend income relative to the original purchase price rather than today's market value.
Over the five-year period, ABBV builds the strongest income efficiency, finishing at approximately 5.59% yield on cost.
JNJ, PFE, and BMY also show gradually improving yield on cost throughout the period, although their increases are more modest.
For long-term dividend investors, these trends demonstrate how consistent dividend increases can gradually improve the income generated by an initial investment without requiring additional capital.
Now let's shift from historical performance to today's income picture.
Income Goal Comparison
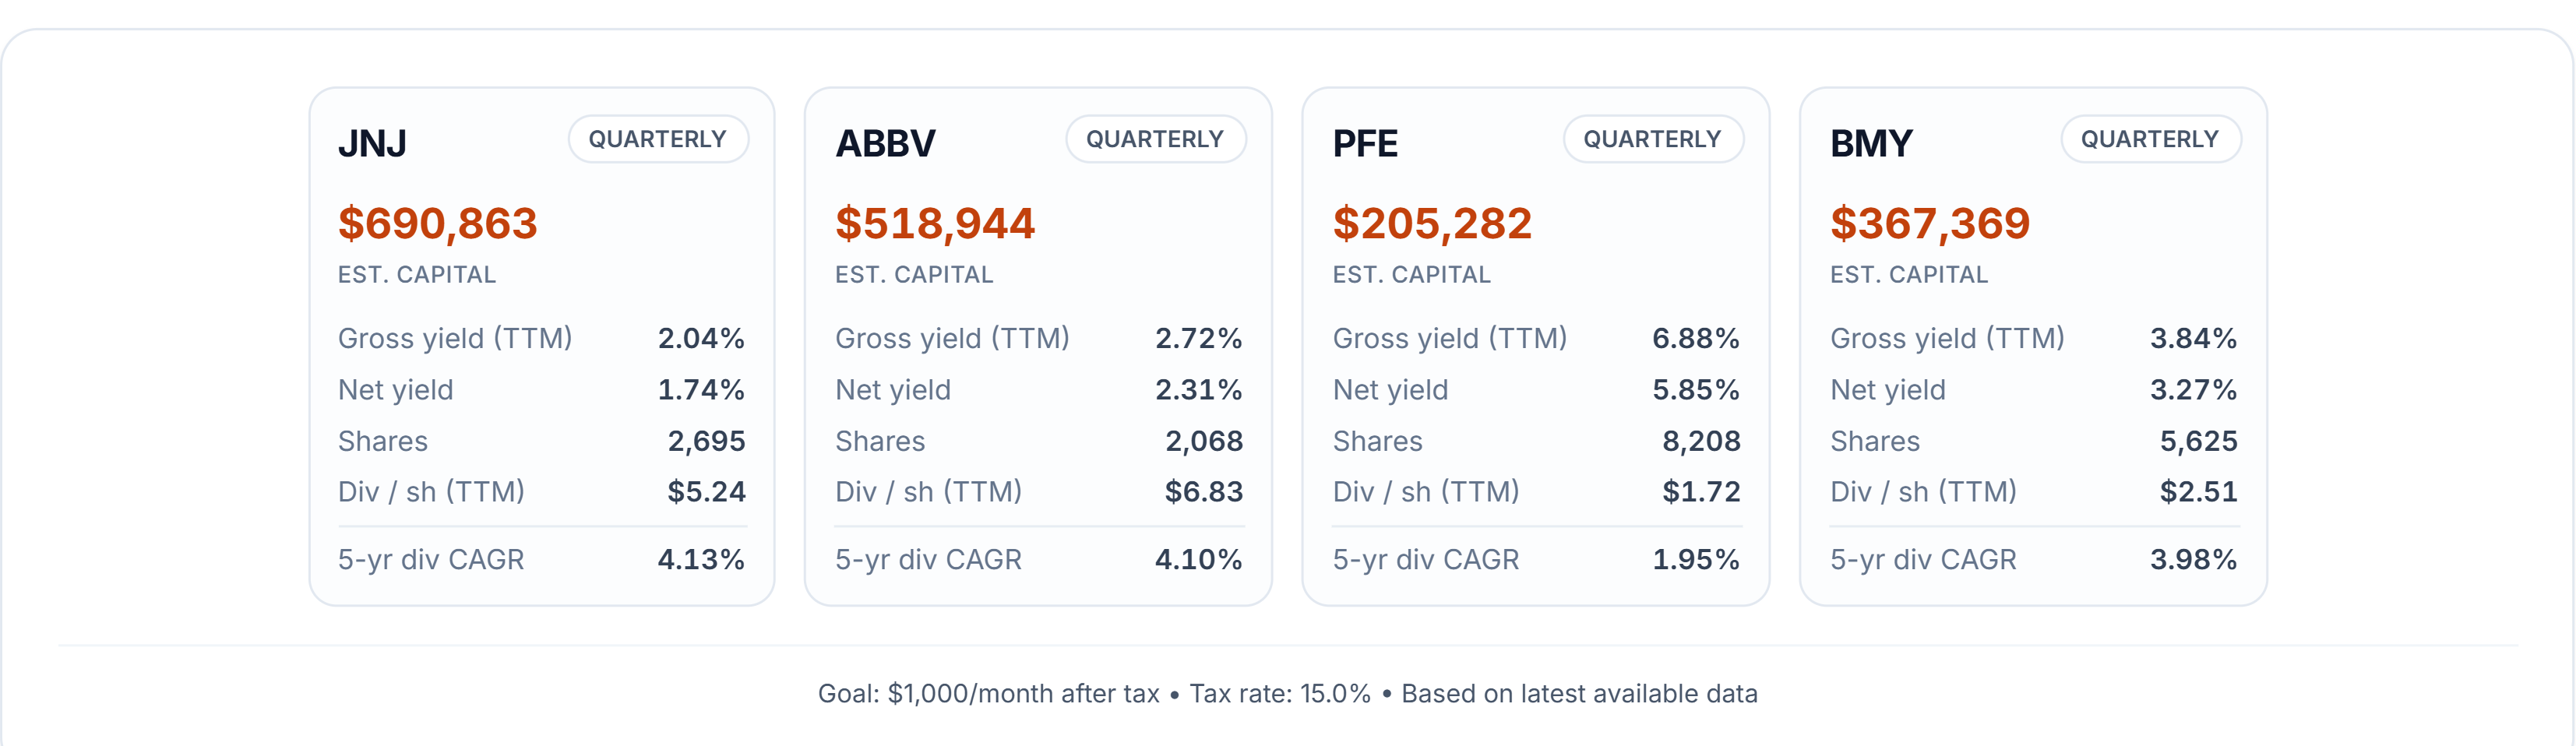
How much capital is required to generate $1,000 per month after taxes from dividends? The answer depends primarily on each company's current dividend yield.
Assuming a 15% dividend tax rate, PFE requires the least starting capital at approximately $205,282, benefiting from its current dividend yield of roughly 6.9%.
At the opposite end, JNJ requires approximately $690,863, reflecting its much lower current yield of about 2.0%.
ABBV and BMY fall between those two extremes, offering a middle ground that balances current income with dividend growth potential.
These comparisons highlight an important tradeoff: higher-yield investments can reach an income target with less capital today, while lower-yield holdings often rely more heavily on future dividend growth.
Yield Catch-Up Timeline
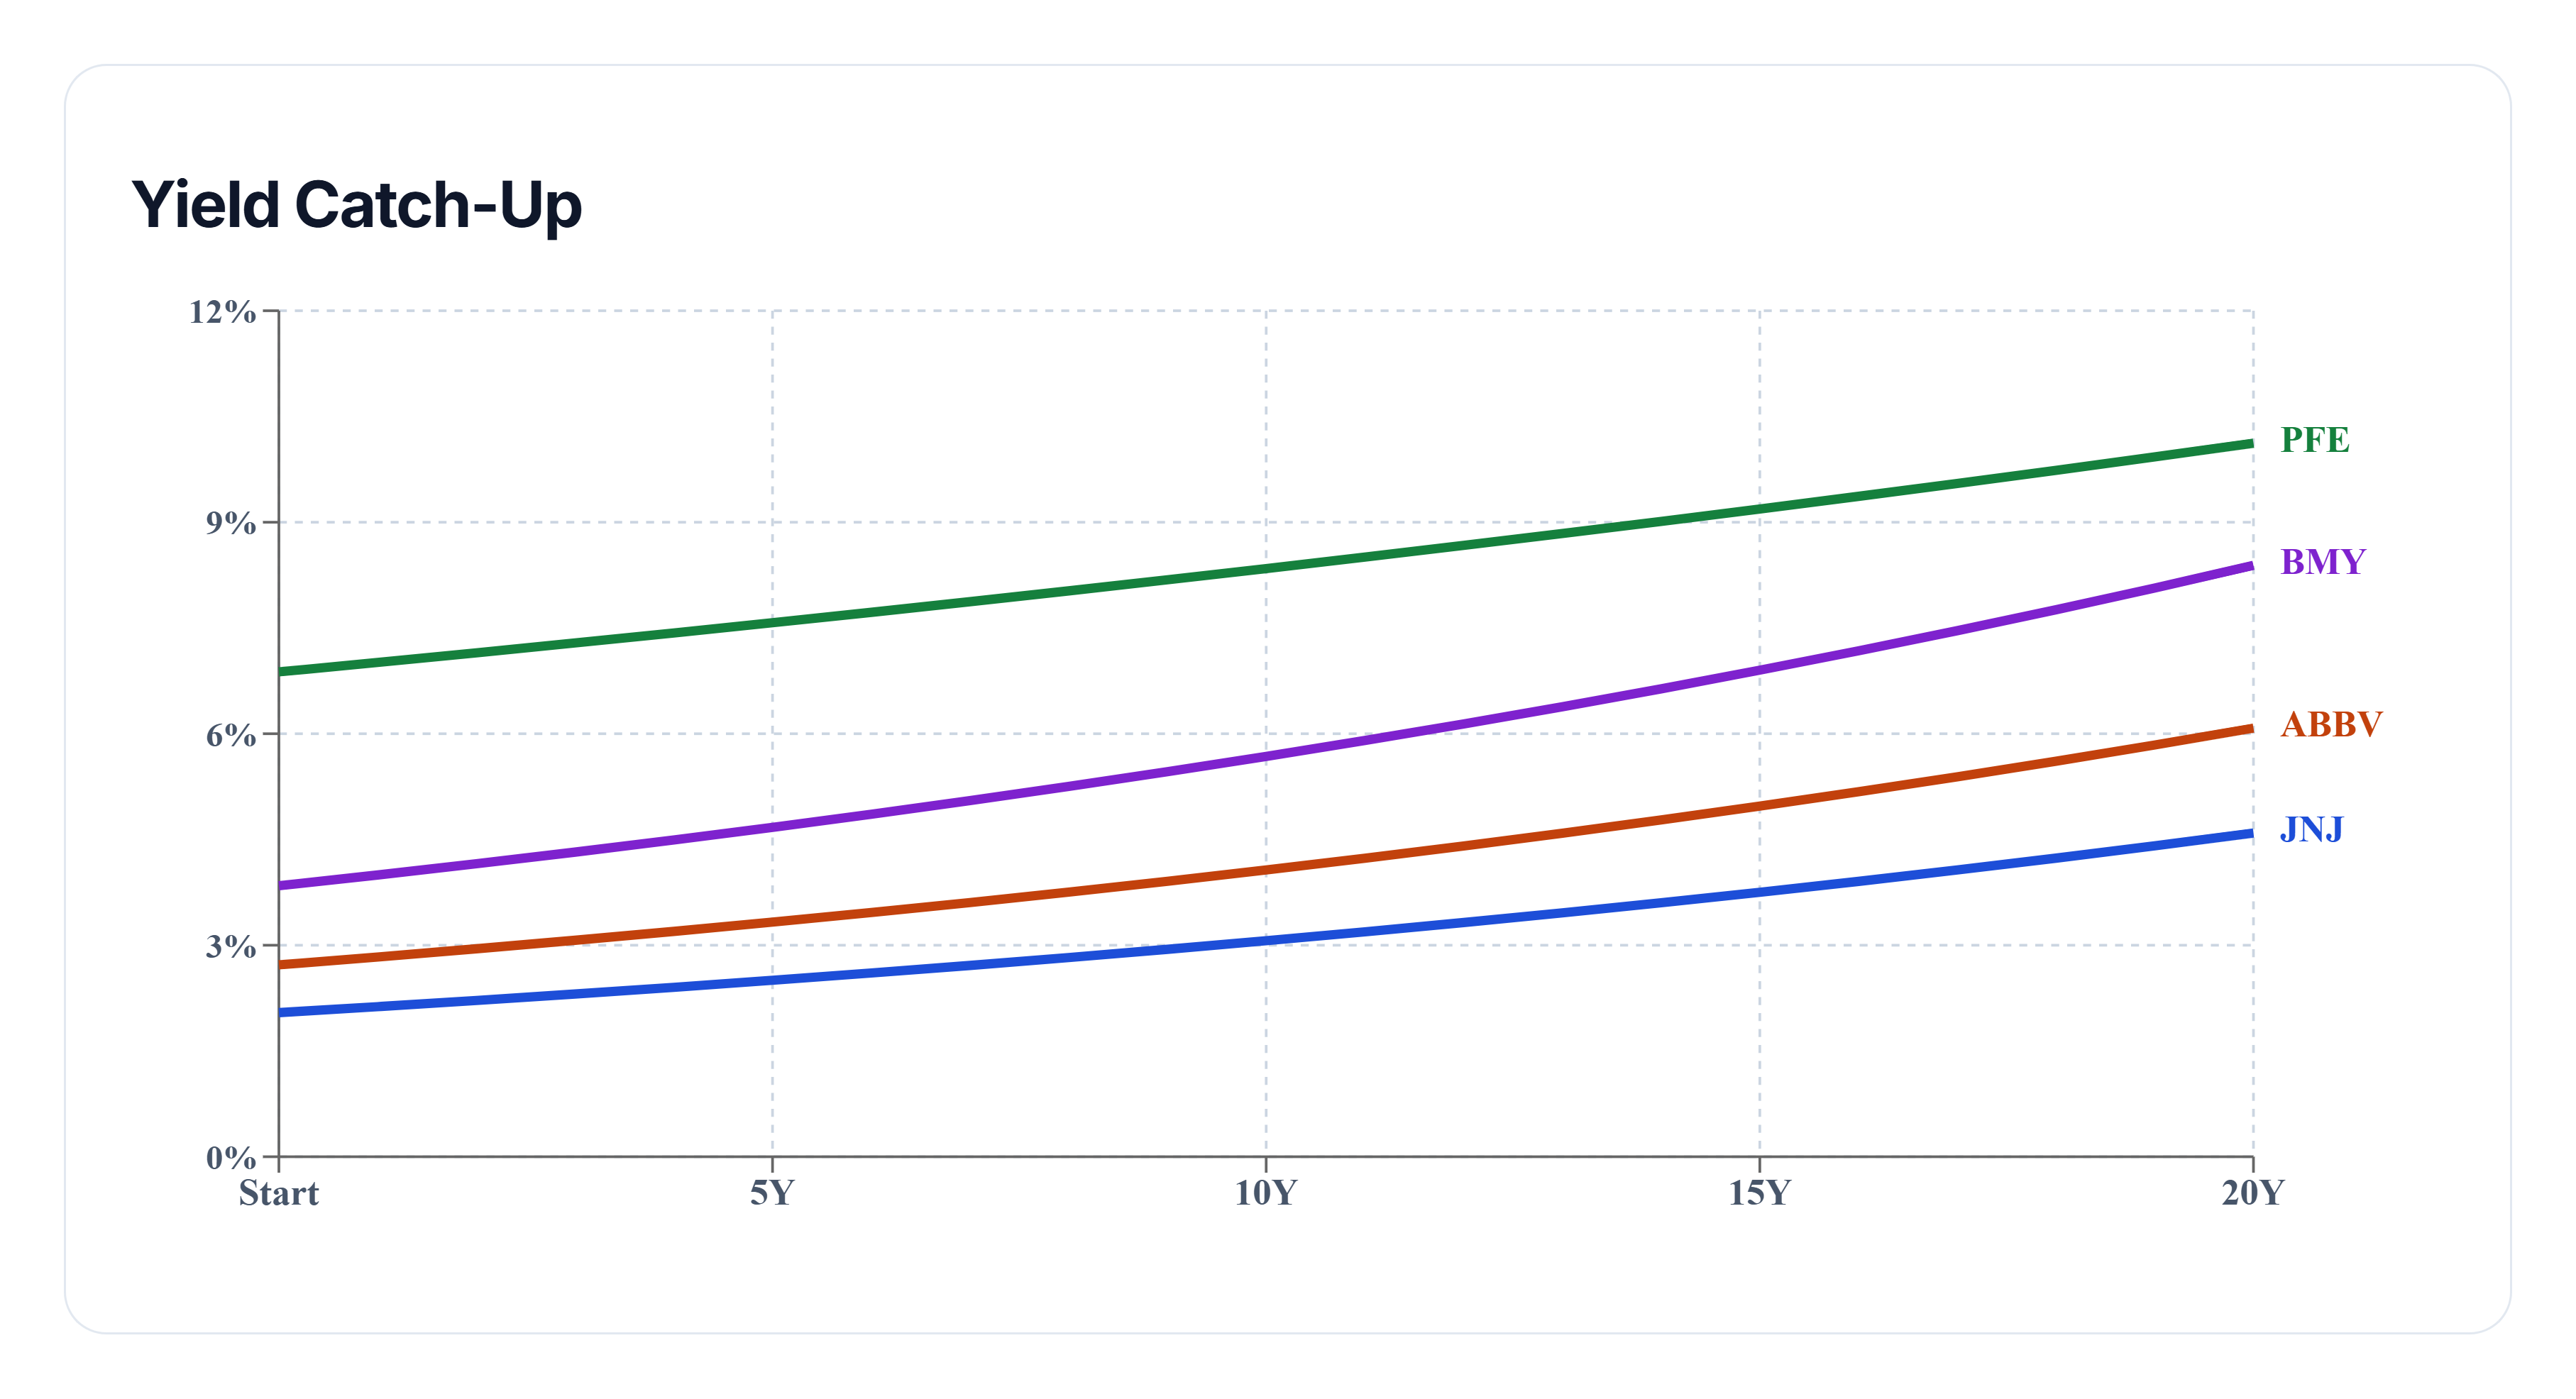
This projection estimates future yield on cost by assuming each company continues increasing its dividend at approximately the same annual rate achieved over the previous five years.
Within this group, JNJ posts the strongest modeled dividend growth rate at roughly 4.1%, while PFE begins with the highest current yield at approximately 6.9%.
Despite JNJ's faster projected dividend growth, its substantially lower starting yield of around 2.0% creates a large initial disadvantage.
Over the full 20-year projection, JNJ steadily narrows the income gap, but it does not fully catch or surpass PFE's projected yield on cost within the modeled timeframe.
The exercise illustrates that both starting yield and dividend growth influence long-term income efficiency, and one advantage does not always overcome the other over a practical investment horizon.
Final Takeaway
There is no single "best" pharmaceutical dividend stock because each emphasizes a different balance between present income, dividend growth, and long-term returns.
This comparison shows ABBV leading historical yield-on-cost growth and five-year price appreciation, while JNJ delivers the strongest historical dividend growth rate. For investors focused on generating income today, PFE requires the least capital to reach a $1,000 per month after-tax dividend goal because of its significantly higher current yield.
The long-term yield-on-cost projection also demonstrates that stronger dividend growth alone does not necessarily overcome a large difference in starting yield. While JNJ steadily improves its income efficiency over time, it does not catch PFE during the 20-year modeled period.
As with any projection, these results are based on historical dividend growth rates and should be viewed as educational illustrations rather than predictions of future dividend performance.