SCHD: Price Growth vs Dividend Growth (2016–2025)
Dividend investors often focus on share-price appreciation when evaluating long-term performance. But for investors building an income-producing portfolio, the growth of annual dividend payments can tell a different story.
SCHD, the Schwab U.S. Dividend Equity ETF, provides an interesting example.
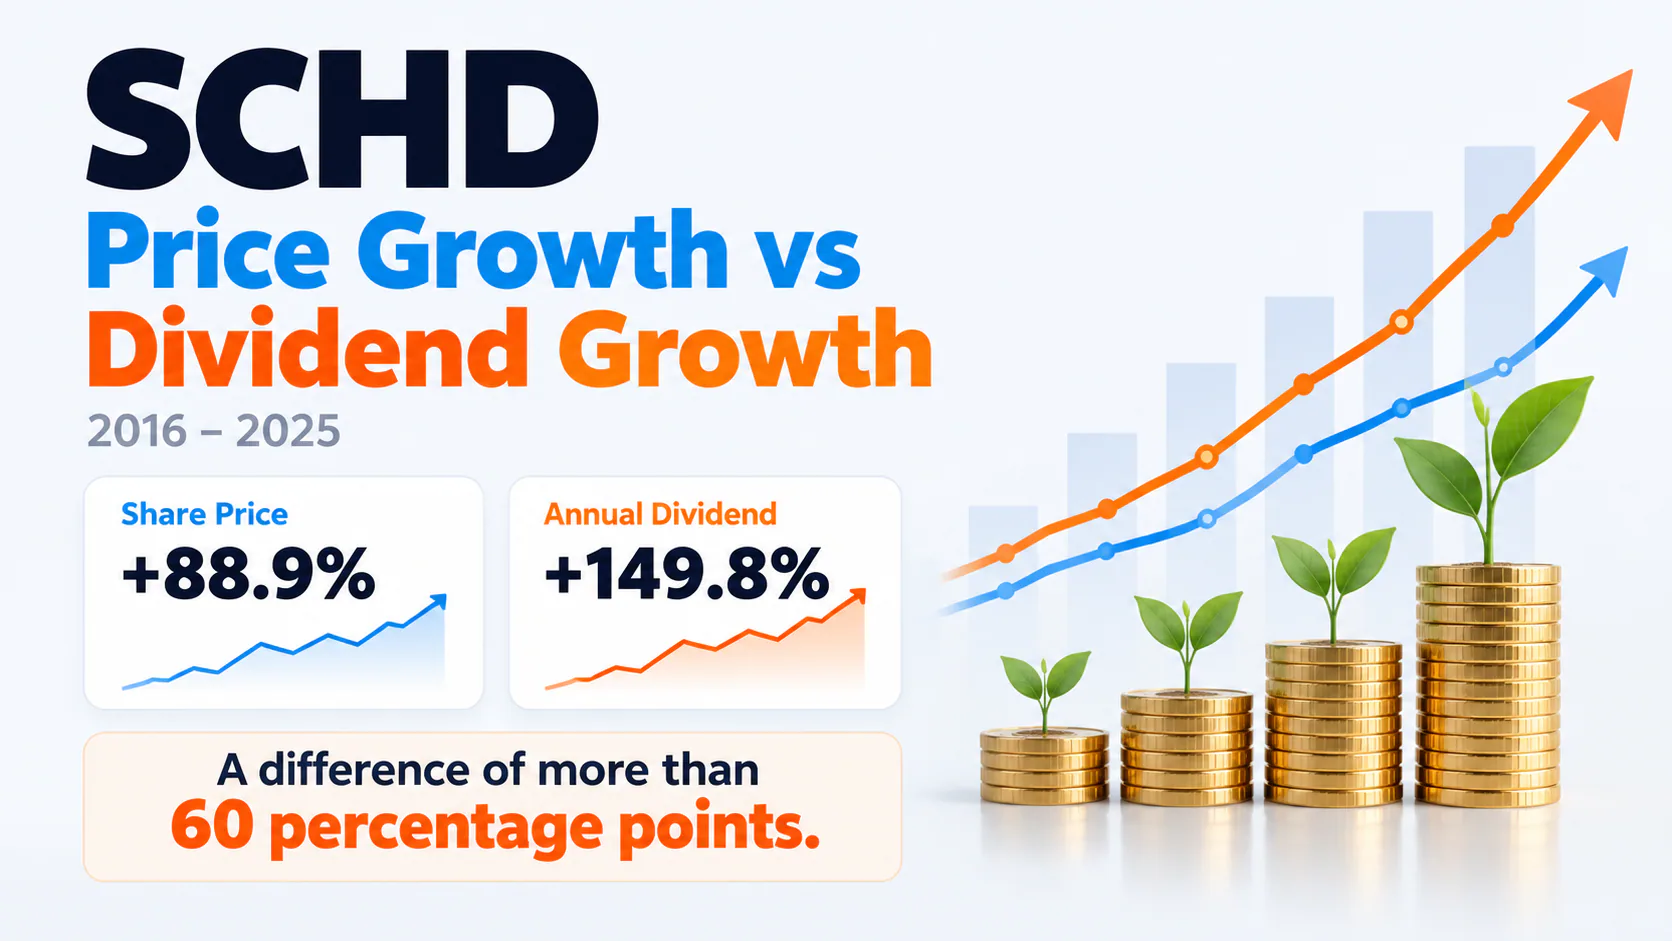
Between 2016 and 2025, SCHD's share price appreciated approximately 88.9%, while its annual dividends per share increased 149.8%.
That's a difference of nearly 61 percentage points.
The comparison highlights how dividend income can grow faster than the underlying investment's market price, even without reinvesting dividends.
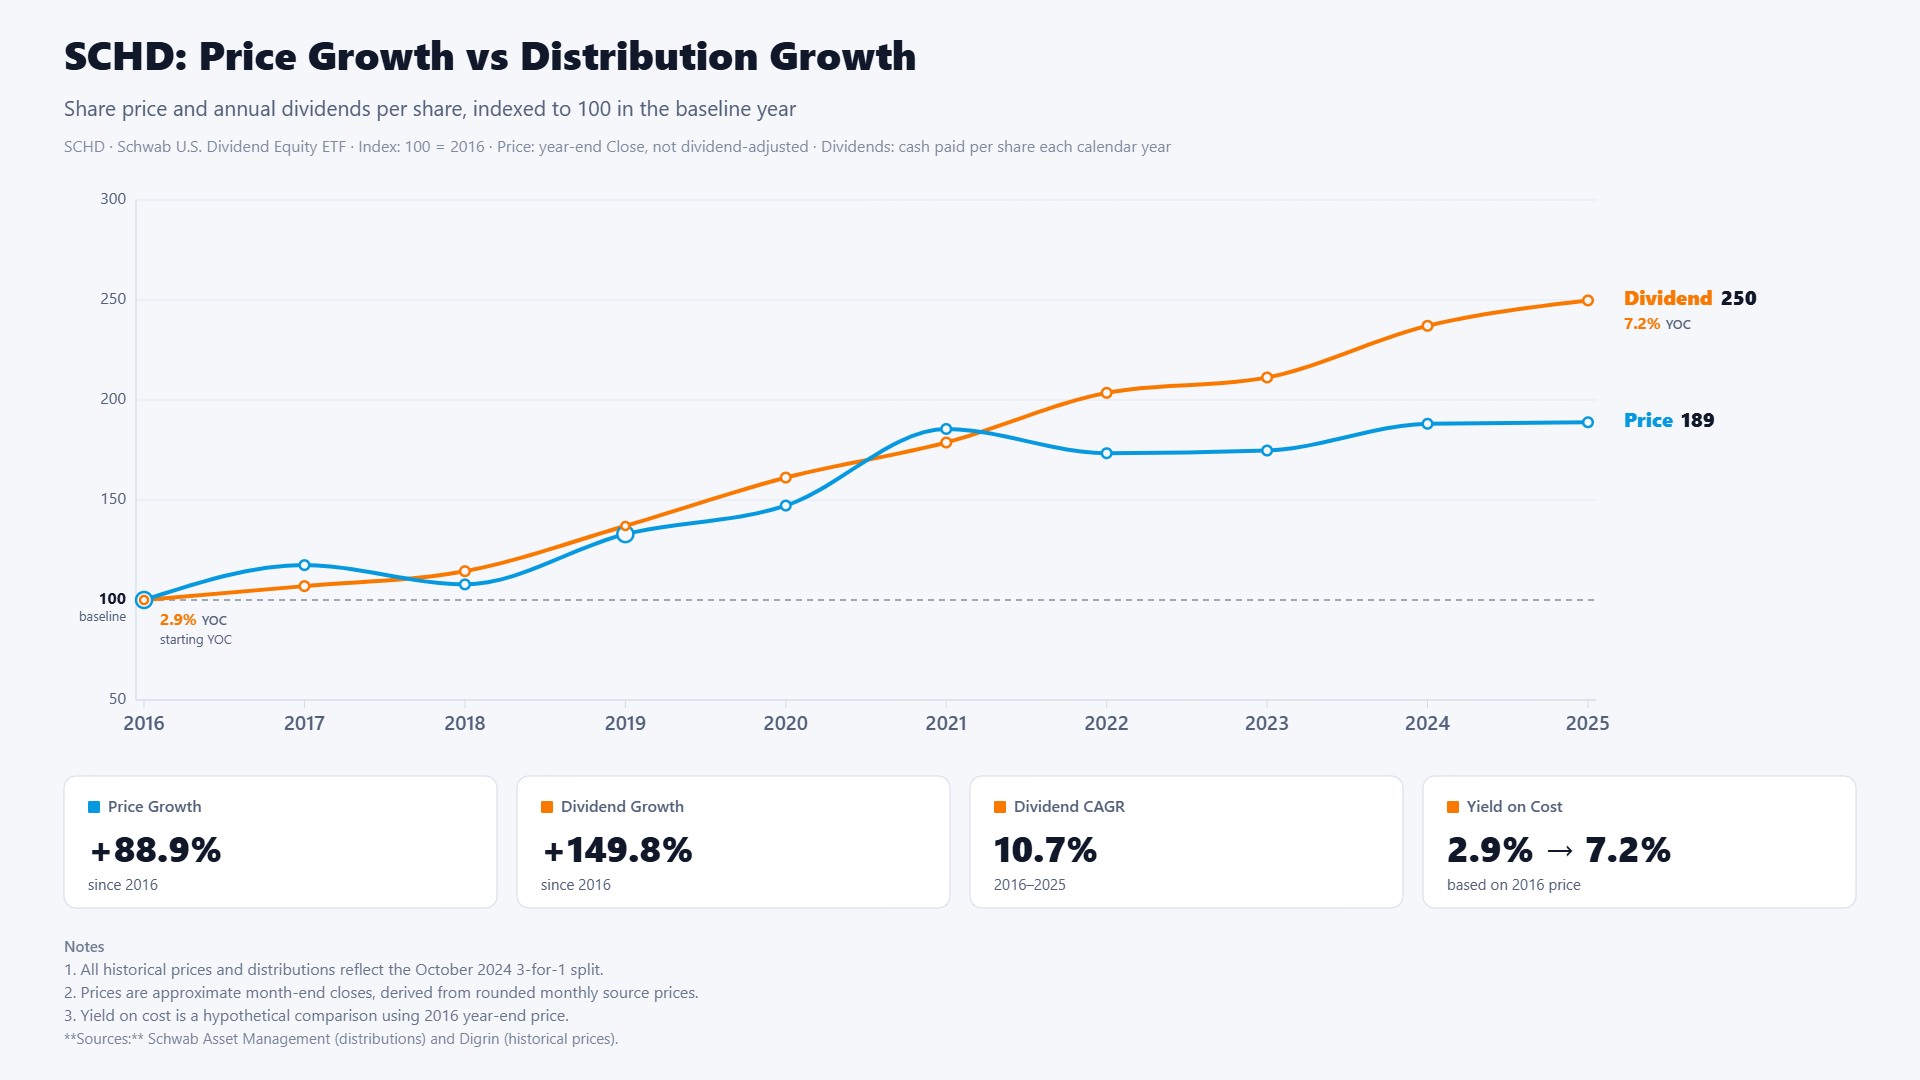
The DividendXray chart compares SCHD's year-end share price with its annual dividends per share from 2016 through 2025.
Both series are indexed to 100 in 2016, making it easier to compare their relative growth.
The blue line represents share-price appreciation, while the orange line tracks annual dividend growth.
During the early years, both measures generally moved upward, although their paths were not identical.
The more interesting divergence emerged after 2021.
In 2022, SCHD's share price declined while its annual dividend per share continued increasing. This illustrates an important distinction: dividend income and market prices do not necessarily move together.
By 2025, the difference had become substantial.
- Share-price growth: +88.9%, reaching an index of 189.
- Annual dividend growth: +149.8%, reaching an index of 250.
- Dividend CAGR: 10.7% over nine years.
- Yield on cost: 2.9% in the baseline comparison, increasing to 7.2% by 2025.
What the Yield on Cost Reveals
Yield on cost measures annual dividend income relative to an original purchase price.
Using SCHD's December 2016 year-end price as a fixed reference, the full-year 2016 dividend represented approximately 2.9% of that price.
By 2025, the annual dividend represented approximately 7.2% of the same reference price.
This is a hypothetical historical comparison: the 2016 dividends were paid before the year-end reference purchase date.
Nevertheless, the calculation demonstrates how a growing dividend can increase the annual income associated with a fixed original investment.
Importantly, this improvement did not require purchasing additional shares or reinvesting dividends.
Dividend Growth Is Not Total Return
Although SCHD's dividend growth outpaced its share-price appreciation, this does not mean dividend investors earned a 149.8% investment return.
The chart compares two separate measures: annual dividend payments per share and share-price appreciation.
It does not calculate total return, which would also account for dividends received and potentially reinvested.
Taxes and inflation are also excluded.
Additionally, historical dividend growth does not guarantee future increases. ETF distributions depend on the dividends paid by underlying holdings and can fluctuate.
Final Takeaway
SCHD's performance between 2016 and 2025 demonstrates an important characteristic of dividend growth investing.
Annual income per share can grow considerably faster than share prices.
Over this nine-year interval, SCHD's annual dividends per share increased nearly 150%, compared with approximately 89% share-price appreciation.
For investors focused on building a growing income stream, that distinction matters.
However, dividend growth should be evaluated alongside total return, portfolio diversification, income sustainability, and individual investment objectives.
Explore more dividend research, ETF comparisons, and historical income visualizations at DividendXray.
Educational content only. Not financial advice.