VYMI vs IDV vs VIGI: 9 Years of Dividend Income Growth
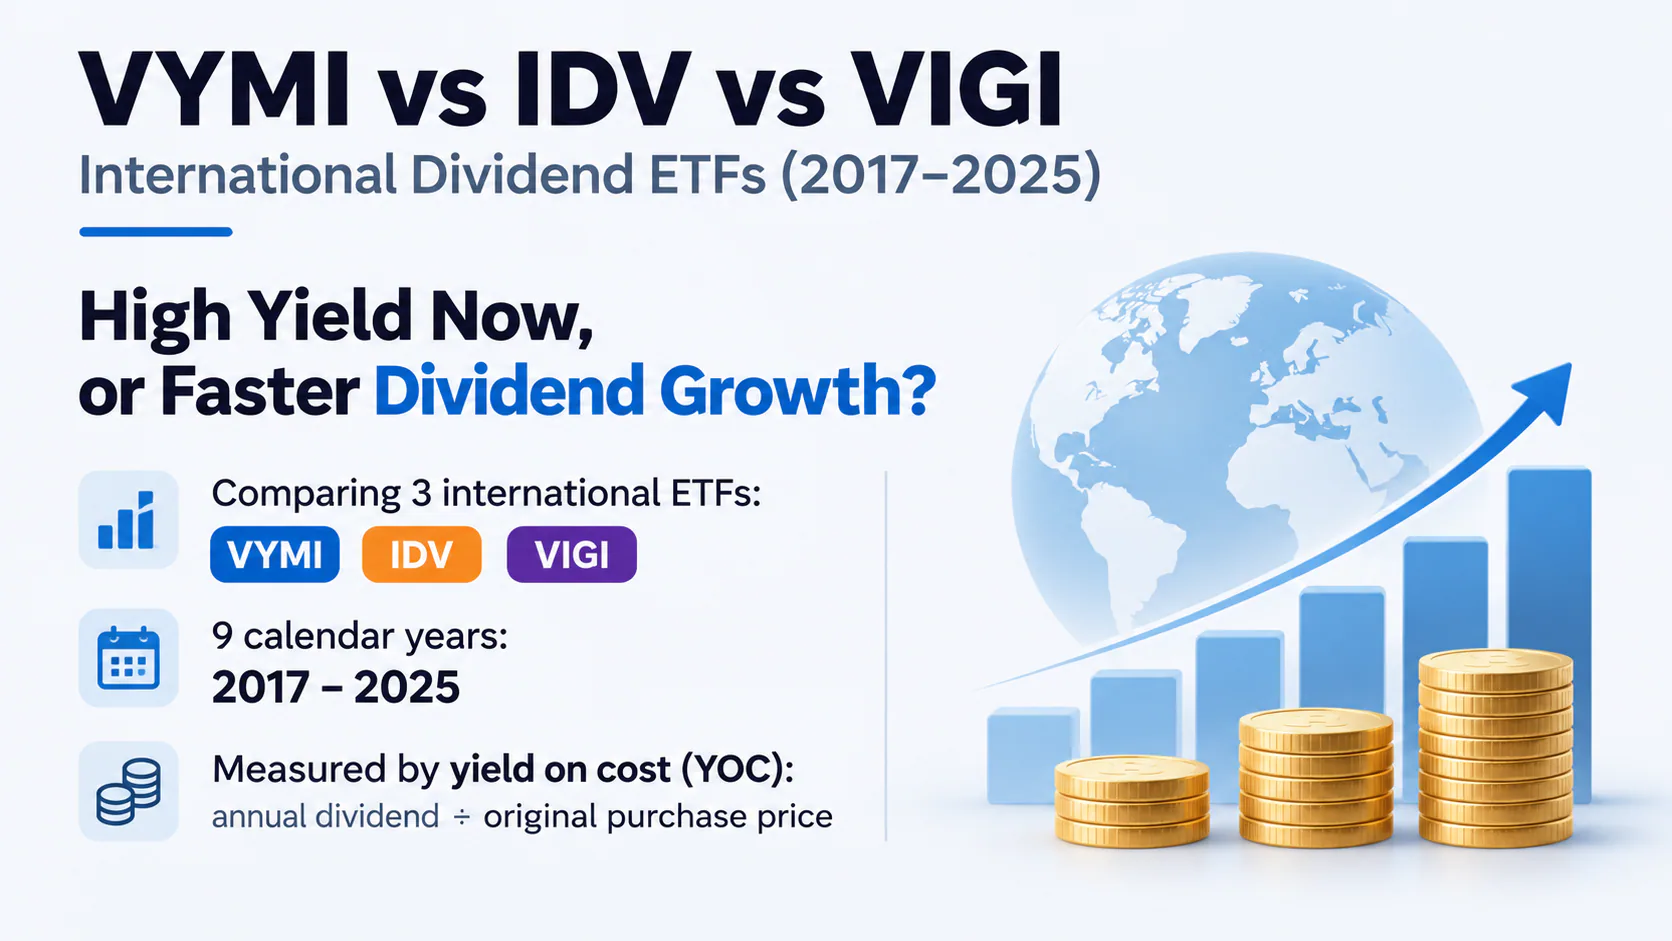
When investing for dividend income, should investors prioritize a higher starting yield or accept a lower yield in exchange for potentially faster dividend growth?
To explore this trade-off, we compare three international dividend ETFs: Vanguard International High Dividend Yield ETF (VYMI), iShares International Select Dividend ETF (IDV), and Vanguard International Dividend Appreciation ETF (VIGI).
Using DividendXray, we examine nine calendar years, from 2017 through 2025, focusing on how each ETF's dividend income evolved relative to its original purchase price.
The comparison uses yield on cost, calculated by dividing each year's annual dividend income per share by the original share price at the beginning of 2017. Dividends are not reinvested, allowing us to isolate changes in income from the original investment.
Explore the Interactive Chart
Want to explore the data behind the images below? Load the interactive version here.
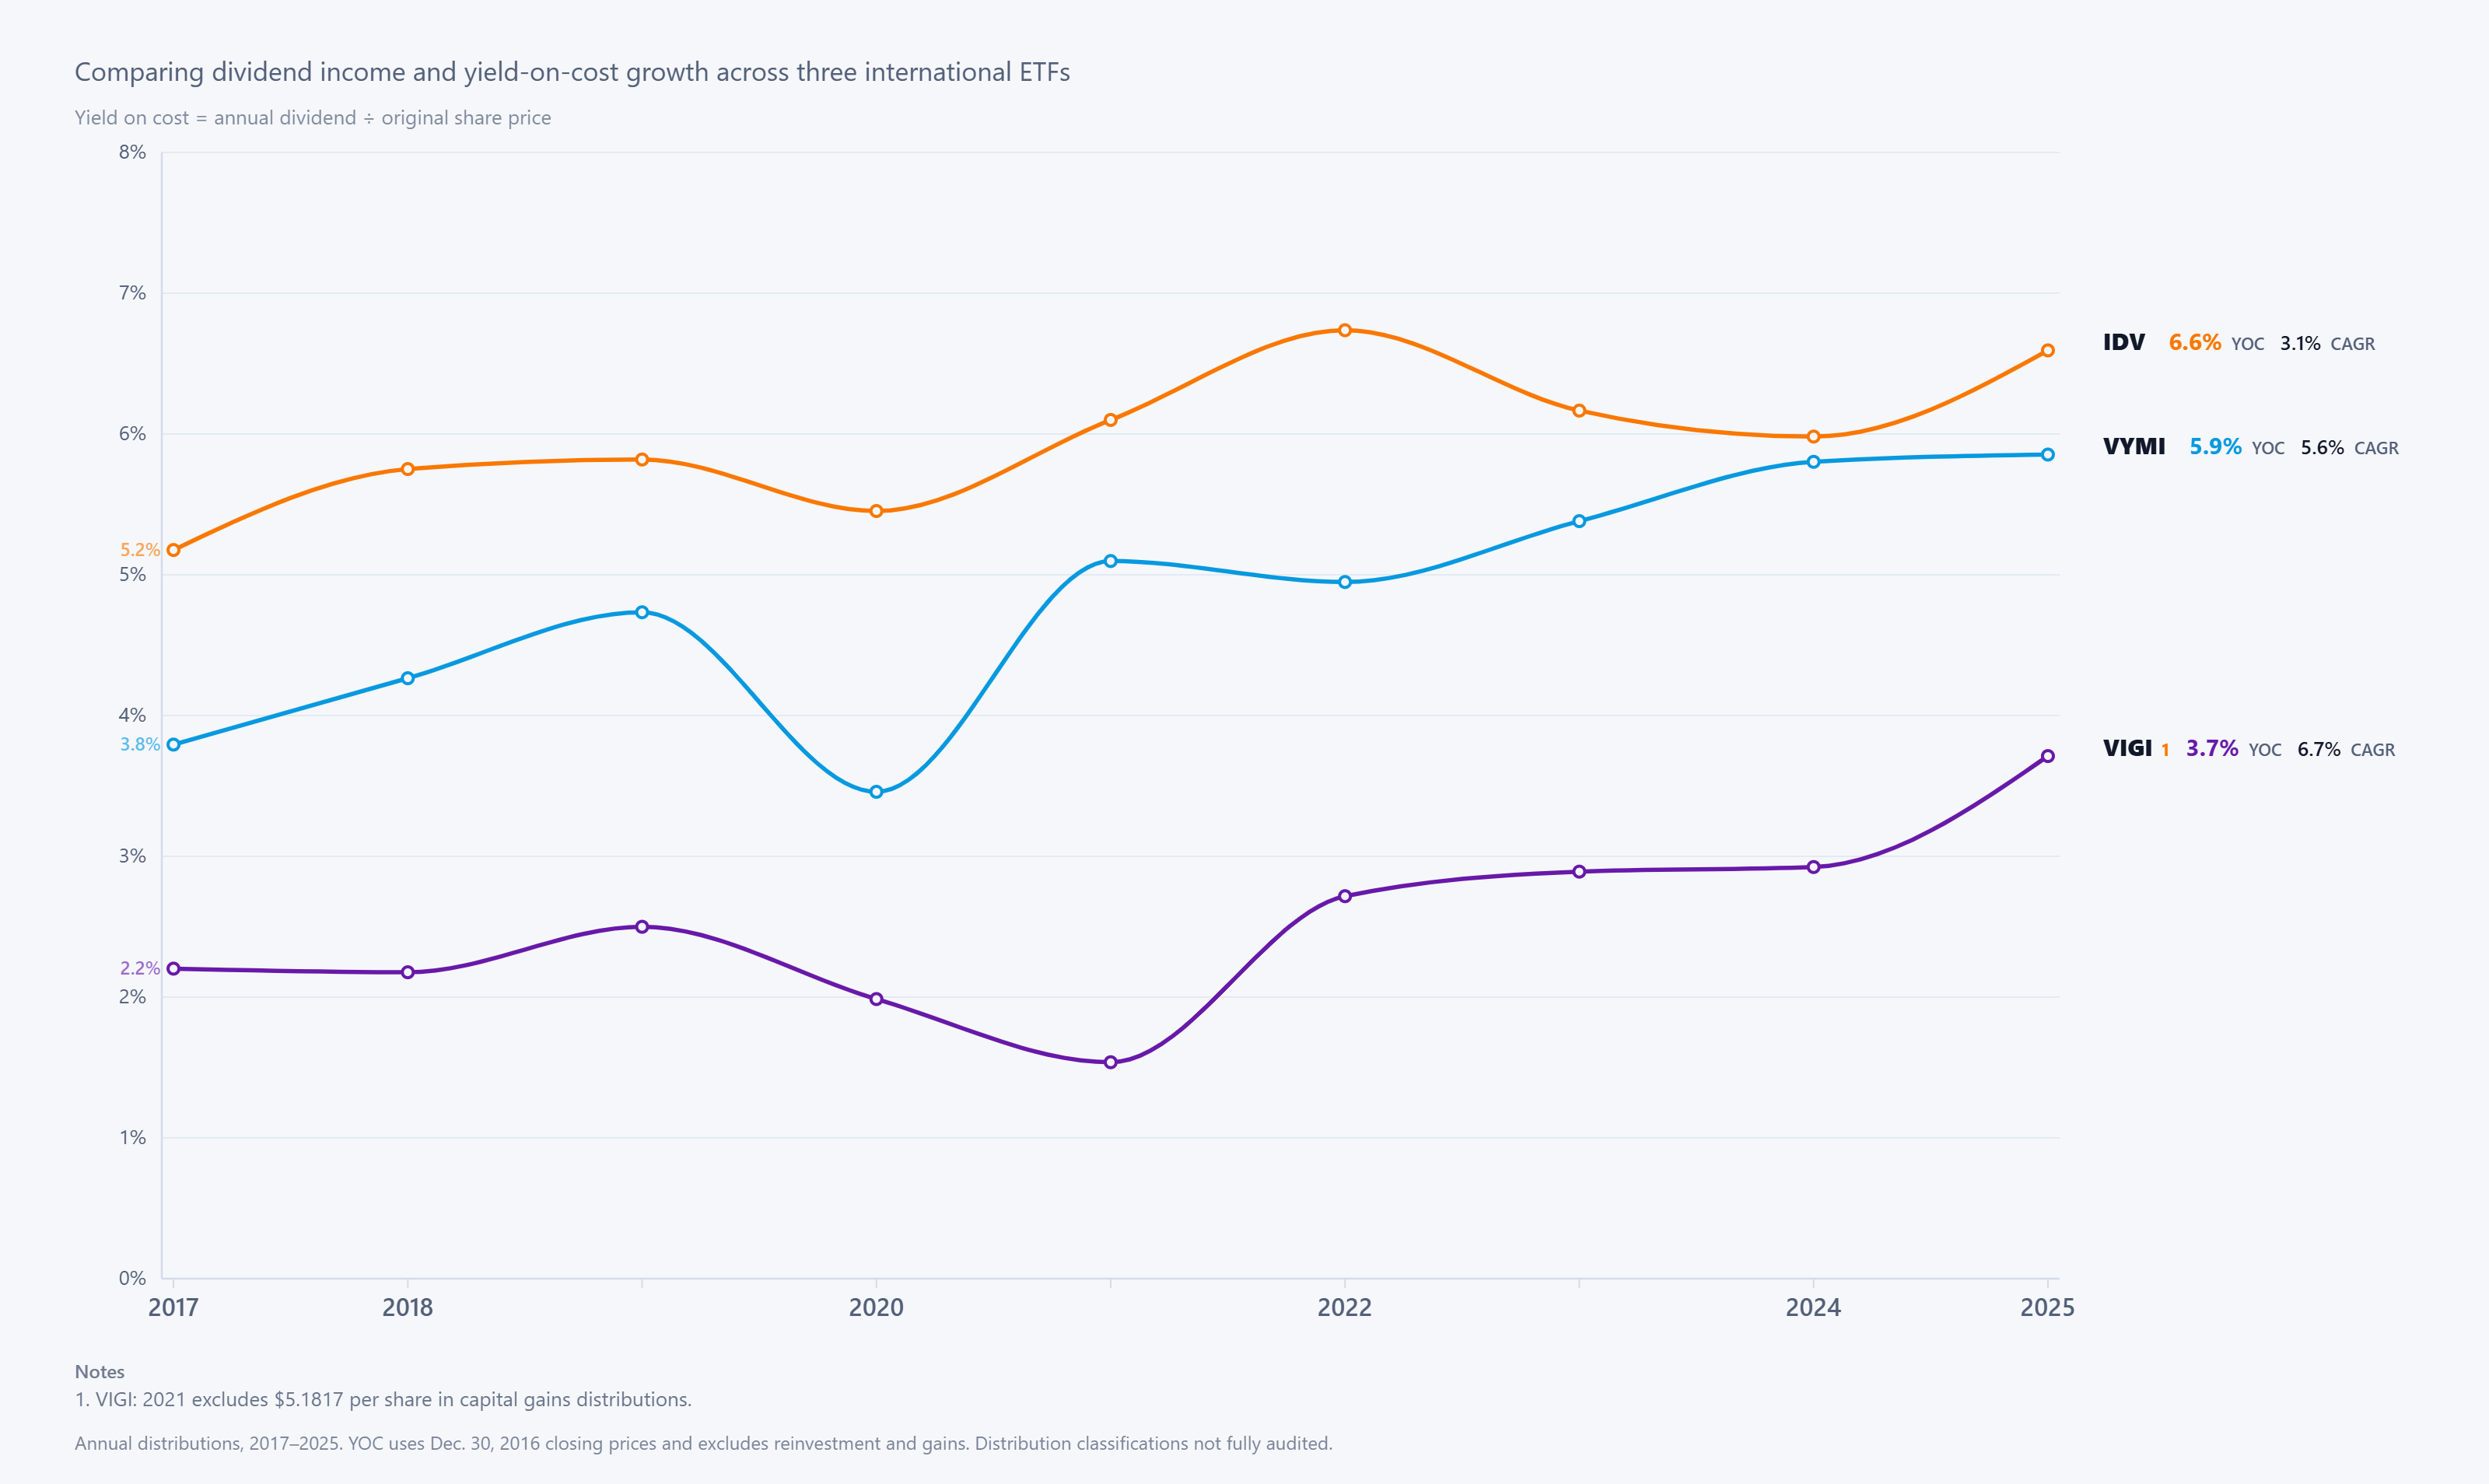
The yield-on-cost chart reveals three distinct income growth patterns.
IDV: The advantage of a higher starting yield
IDV began the period with the highest yield on cost at 5.2% and finished 2025 at 6.6%.
Its annualized dividend growth rate of 3.1% was the slowest among the three ETFs. Nevertheless, its substantial initial income advantage allowed it to maintain the highest yield on cost throughout the comparison.
For investors focused on generating income from the beginning, IDV illustrates how a higher starting yield can remain competitive even when dividend growth is relatively modest.
VYMI: Stronger growth narrows the income gap
VYMI started with a 3.8% yield on cost, below IDV, but delivered faster annualized dividend growth of 5.6%.
By 2025, its yield on cost had reached 5.9%, narrowing the gap with IDV.
The journey was not entirely smooth. VYMI experienced a sharp decline in dividend income during 2020, followed by a strong recovery in 2021.
This highlights an important consideration: dividend growth is rarely perfectly consistent, and temporary income declines can occur even within a longer-term growth trend.
Despite its faster growth, VYMI did not overtake IDV during the nine-year period.
VIGI: Faster dividend growth, but lower income
VIGI followed a different path.
It started with the lowest yield on cost at just 2.2%, but achieved the fastest annualized dividend growth rate at 6.7%.
By 2025, its yield on cost had increased to 3.7%.
That represents meaningful income growth relative to its starting point. However, VIGI still generated less annual dividend income relative to the original investment than either VYMI or IDV.
For consistency, VIGI's extraordinary 2021 capital gains distribution is excluded from this comparison.
VIGI demonstrates why faster dividend growth does not necessarily produce higher income within a limited investment horizon.
What the comparison reveals
Across all nine years, the initial income ranking remained unchanged:
- IDV: Highest starting and ending yield on cost.
- VYMI: Faster growth than IDV, narrowing the income gap without overtaking it.
- VIGI: Fastest annualized dividend growth, but the lowest yield on cost throughout the period.
The distinction between dividend growth rate and actual income is central to understanding these results.
A lower-yielding investment can grow its distributions faster while still taking many years to catch up with an investment that began with a substantially higher yield.
Final Takeaway
The VYMI, IDV, and VIGI comparison illustrates a fundamental trade-off in dividend investing: starting yield determines the initial income advantage, while dividend growth influences how that advantage changes over time.
From 2017 through 2025, faster dividend growth was not enough for either VYMI or VIGI to overtake the ETF immediately ahead of it in yield on cost.
That does not establish which ETF was the better overall investment. This analysis excludes dividend reinvestment and share price appreciation, so it does not measure total return.
For income-focused investors, the practical lesson is to evaluate starting yield, dividend growth, income consistency, and investment horizon together rather than focusing on a single metric.
Explore more dividend growth comparisons and interactive income visualizations on DividendXray to see how different dividend strategies have performed over time.
Educational content only. Not financial advice.