International Dividend ETF Income Goal Comparison: VYMI vs SCHY vs IDV vs EFAS

Introduction
How much capital do you need to generate $1,000 per month in dividend income from international dividend ETFs? The answer depends on current yield, dividend growth, and how efficiently each ETF converts invested capital into long-term income.
In this breakdown, we compare several popular international dividend ETFs against the same after-tax income goal using the DividendXray income goal calculator. The goal is not simply to compare yield today, but to understand how different combinations of starting yield and future dividend growth can influence long-term income generation.
Income Goal Comparison
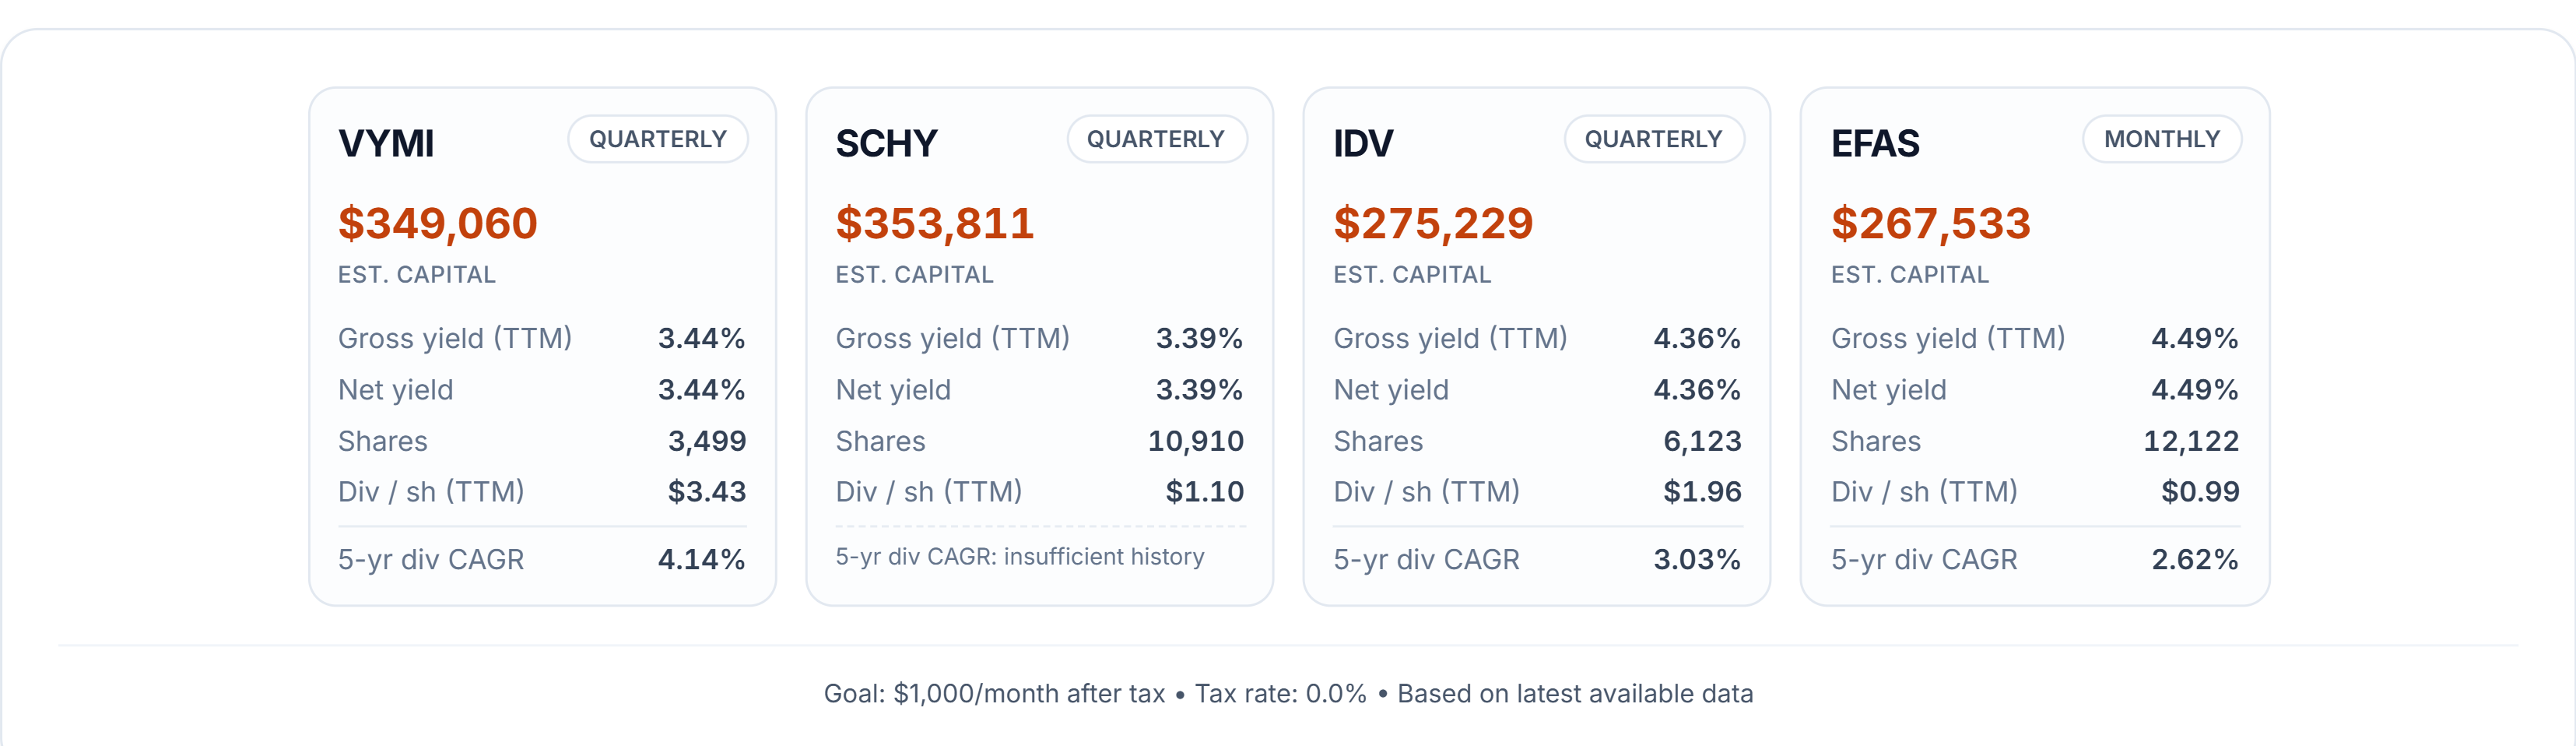
Here is a side-by-side comparison of how much capital each ETF would require to produce the same after-tax monthly income target, based on current yield assumptions.
For a $1,000/month after-tax target with a zero percent tax assumption, EFAS requires the least upfront capital at approximately $267,000, supported by a starting yield near 4.5%.
SCHY requires the most capital at roughly $353,000, reflecting its lower starting yield near 3.4%.
VYMI and IDV sit more toward the middle of the comparison, balancing current income generation with stronger long-term dividend growth characteristics.
The comparison cards highlight the tradeoff clearly: some international dividend ETFs generate more income immediately with less capital, while others may require larger investments today but potentially offer stronger long-term income growth through rising dividends.
Yield Catch-Up Timeline
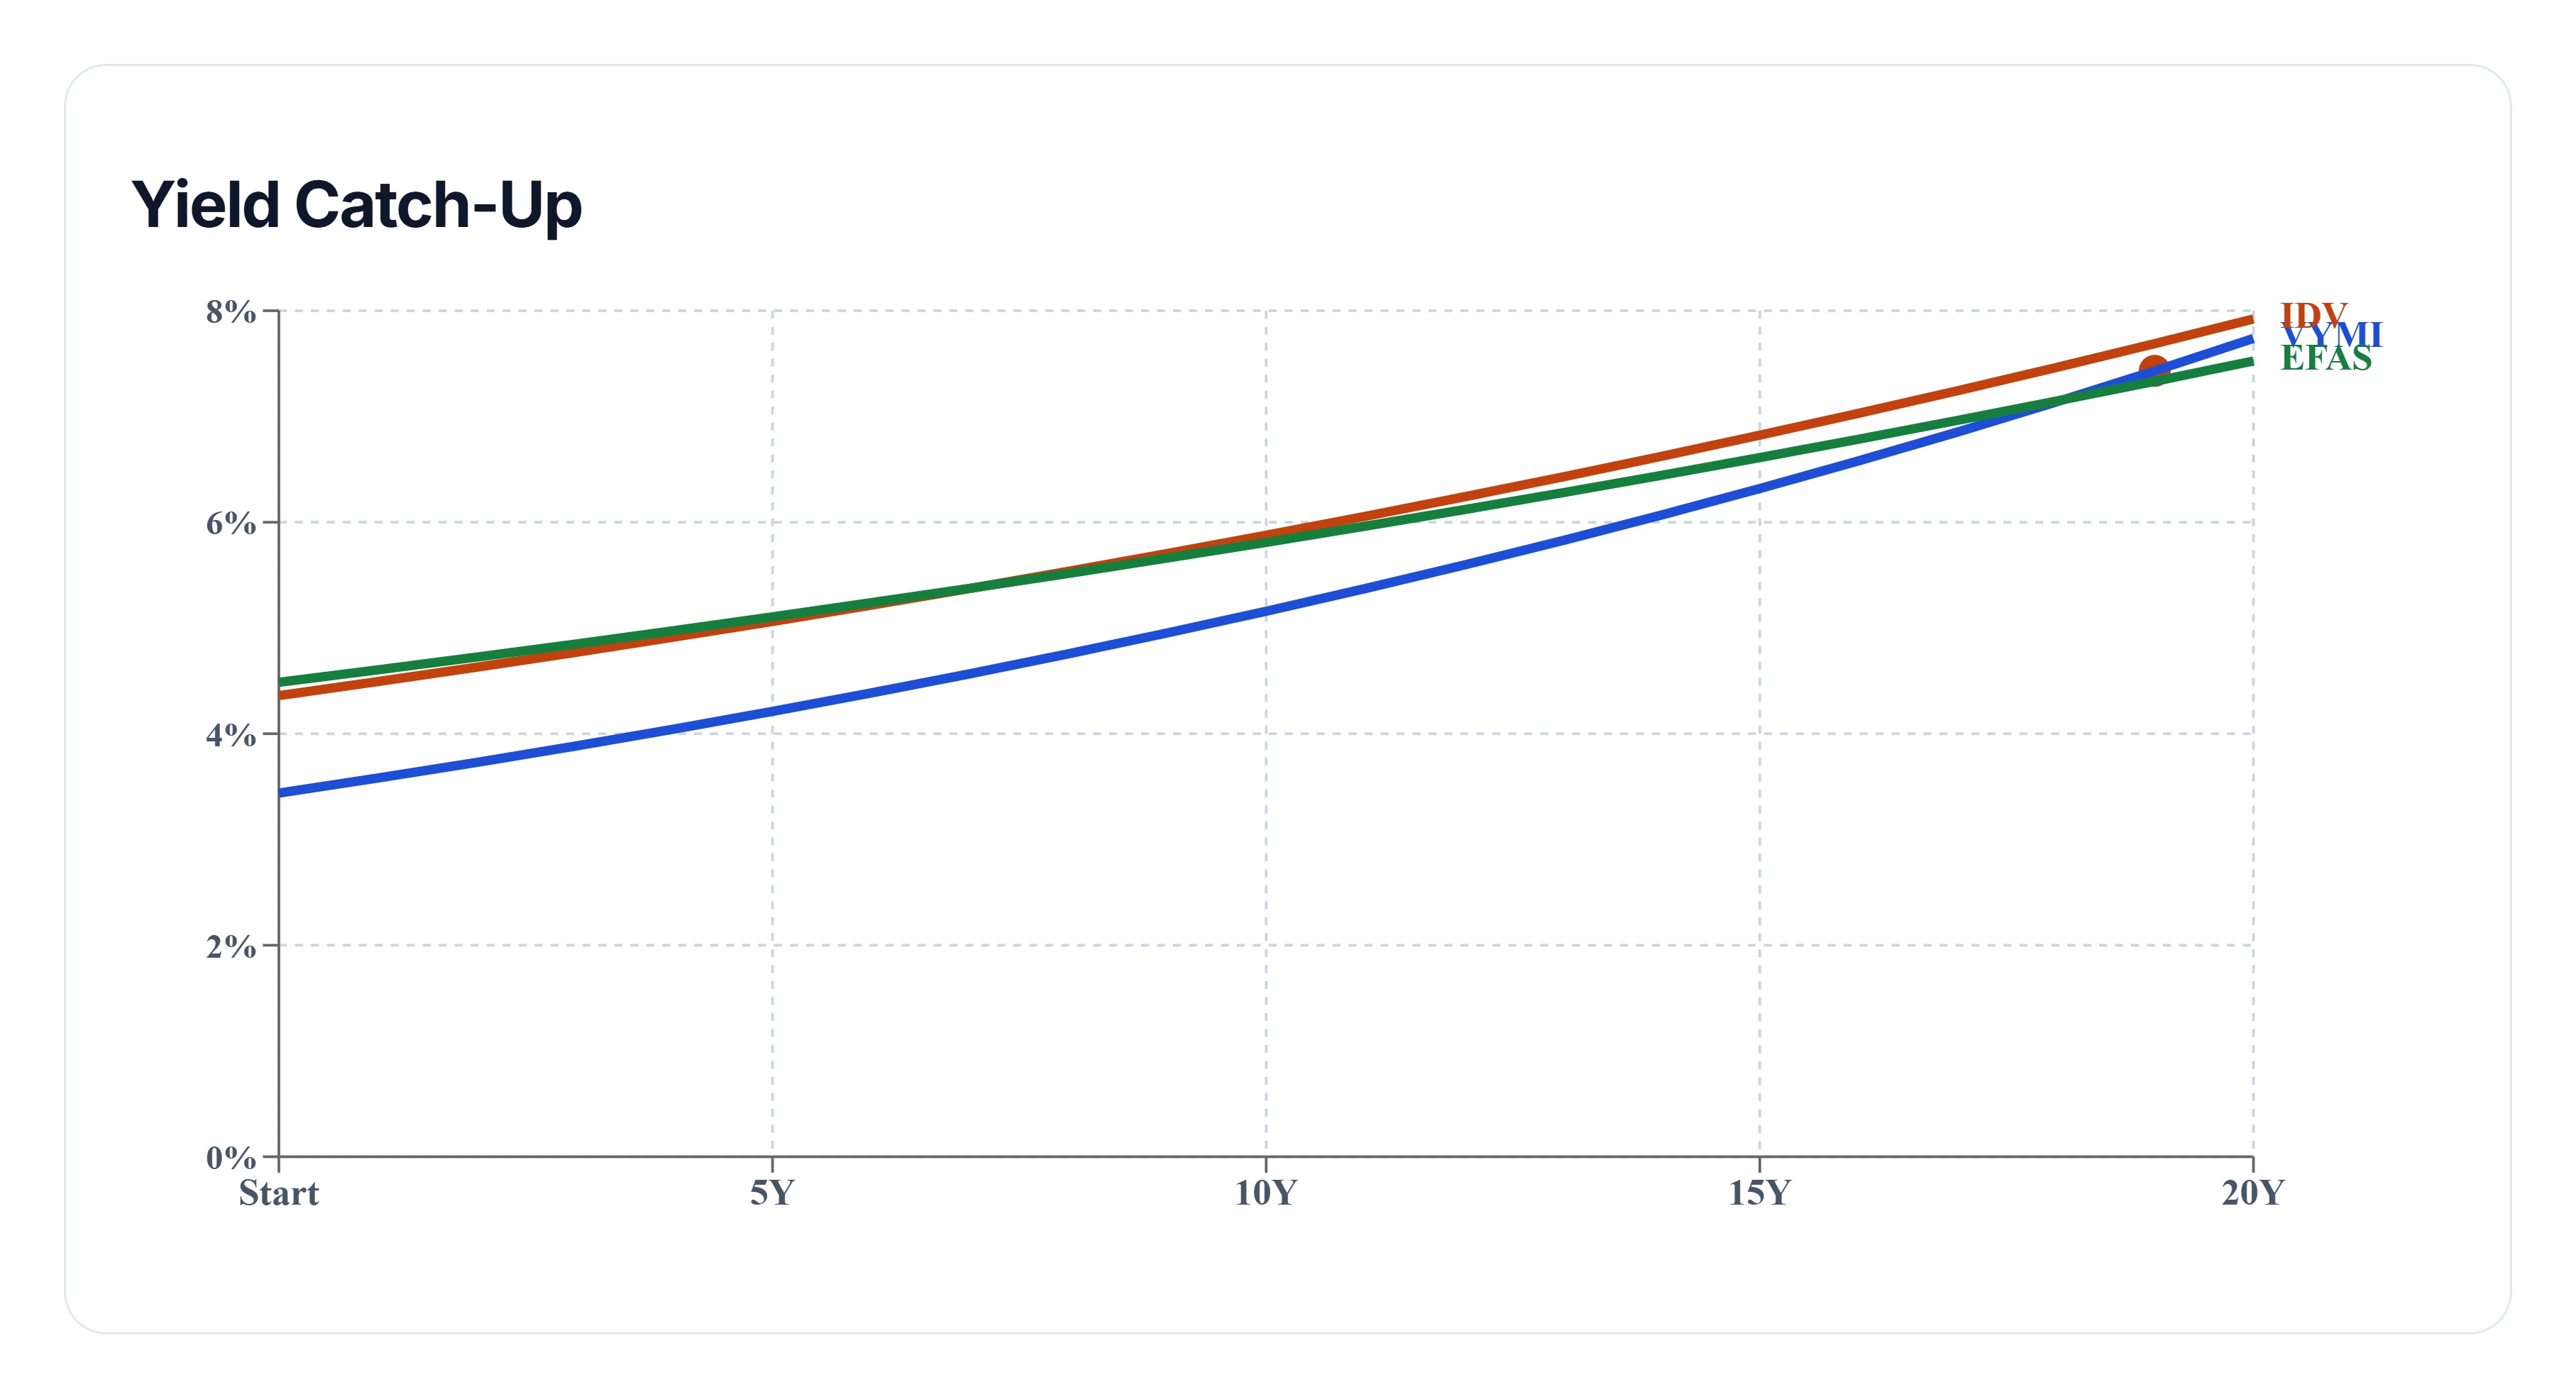
This chart projects how long it may take for a lower-yield dividend growth ETF to catch up to a higher-yield alternative on a yield-on-cost basis.
The projection assumes future dividend growth continues at a pace similar to the previous five years.
VYMI currently shows the strongest modeled dividend growth rate in this comparison at approximately 4.1% annually, while EFAS maintains the highest starting yield near 4.5%.
Because VYMI starts with a lower initial yield near 3.4%, its income profile grows more slowly during the early years despite the stronger dividend growth rate.
Based on this projection model, VYMI eventually surpasses EFAS in projected yield-on-cost around year 19.
SCHY was excluded from the catch-up timeline because its dividend history was not long enough to estimate five-year dividend growth using the same methodology.
The timeline demonstrates how higher-yield investments may dominate early income generation, while dividend growth can gradually reshape long-term income efficiency over extended holding periods.
Final Takeaway
There is no universal answer to which international dividend ETF is “best” for generating $1,000 per month in income. The right choice depends on whether you prioritize higher income today, lower upfront capital requirements, or stronger long-term dividend growth potential.
EFAS currently offers the strongest starting income generation with the least required capital, while VYMI demonstrates stronger modeled dividend growth over longer time horizons.
Use the comparison cards to evaluate current income efficiency, and use the catch-up timeline to understand how dividend growth may reshape long-term yield-on-cost over time.