SCHD vs VYM vs JEPI vs DIVO: Income, Dividend Growth & Yield-on-Cost Compared

Portfolio Overview
In this DividendXray battle, we compare four income-focused ETFs across dividend growth, yield-on-cost expansion, and price return over a five-year period.
- SCHD focuses on high-quality dividend-paying companies, with an emphasis on dividend growth and financial strength.
- VYM targets a broad portfolio of higher-yielding U.S. stocks, offering diversified dividend income.
- JEPI combines large-cap stocks with an options strategy designed to generate higher monthly income.
- DIVO takes a more concentrated approach, combining dividend-growing companies with covered calls for additional income.
These ETFs approach income investing differently. SCHD and VYM follow more traditional dividend-focused strategies, while JEPI and DIVO incorporate options strategies as part of their approach to generating income.
Category Winners
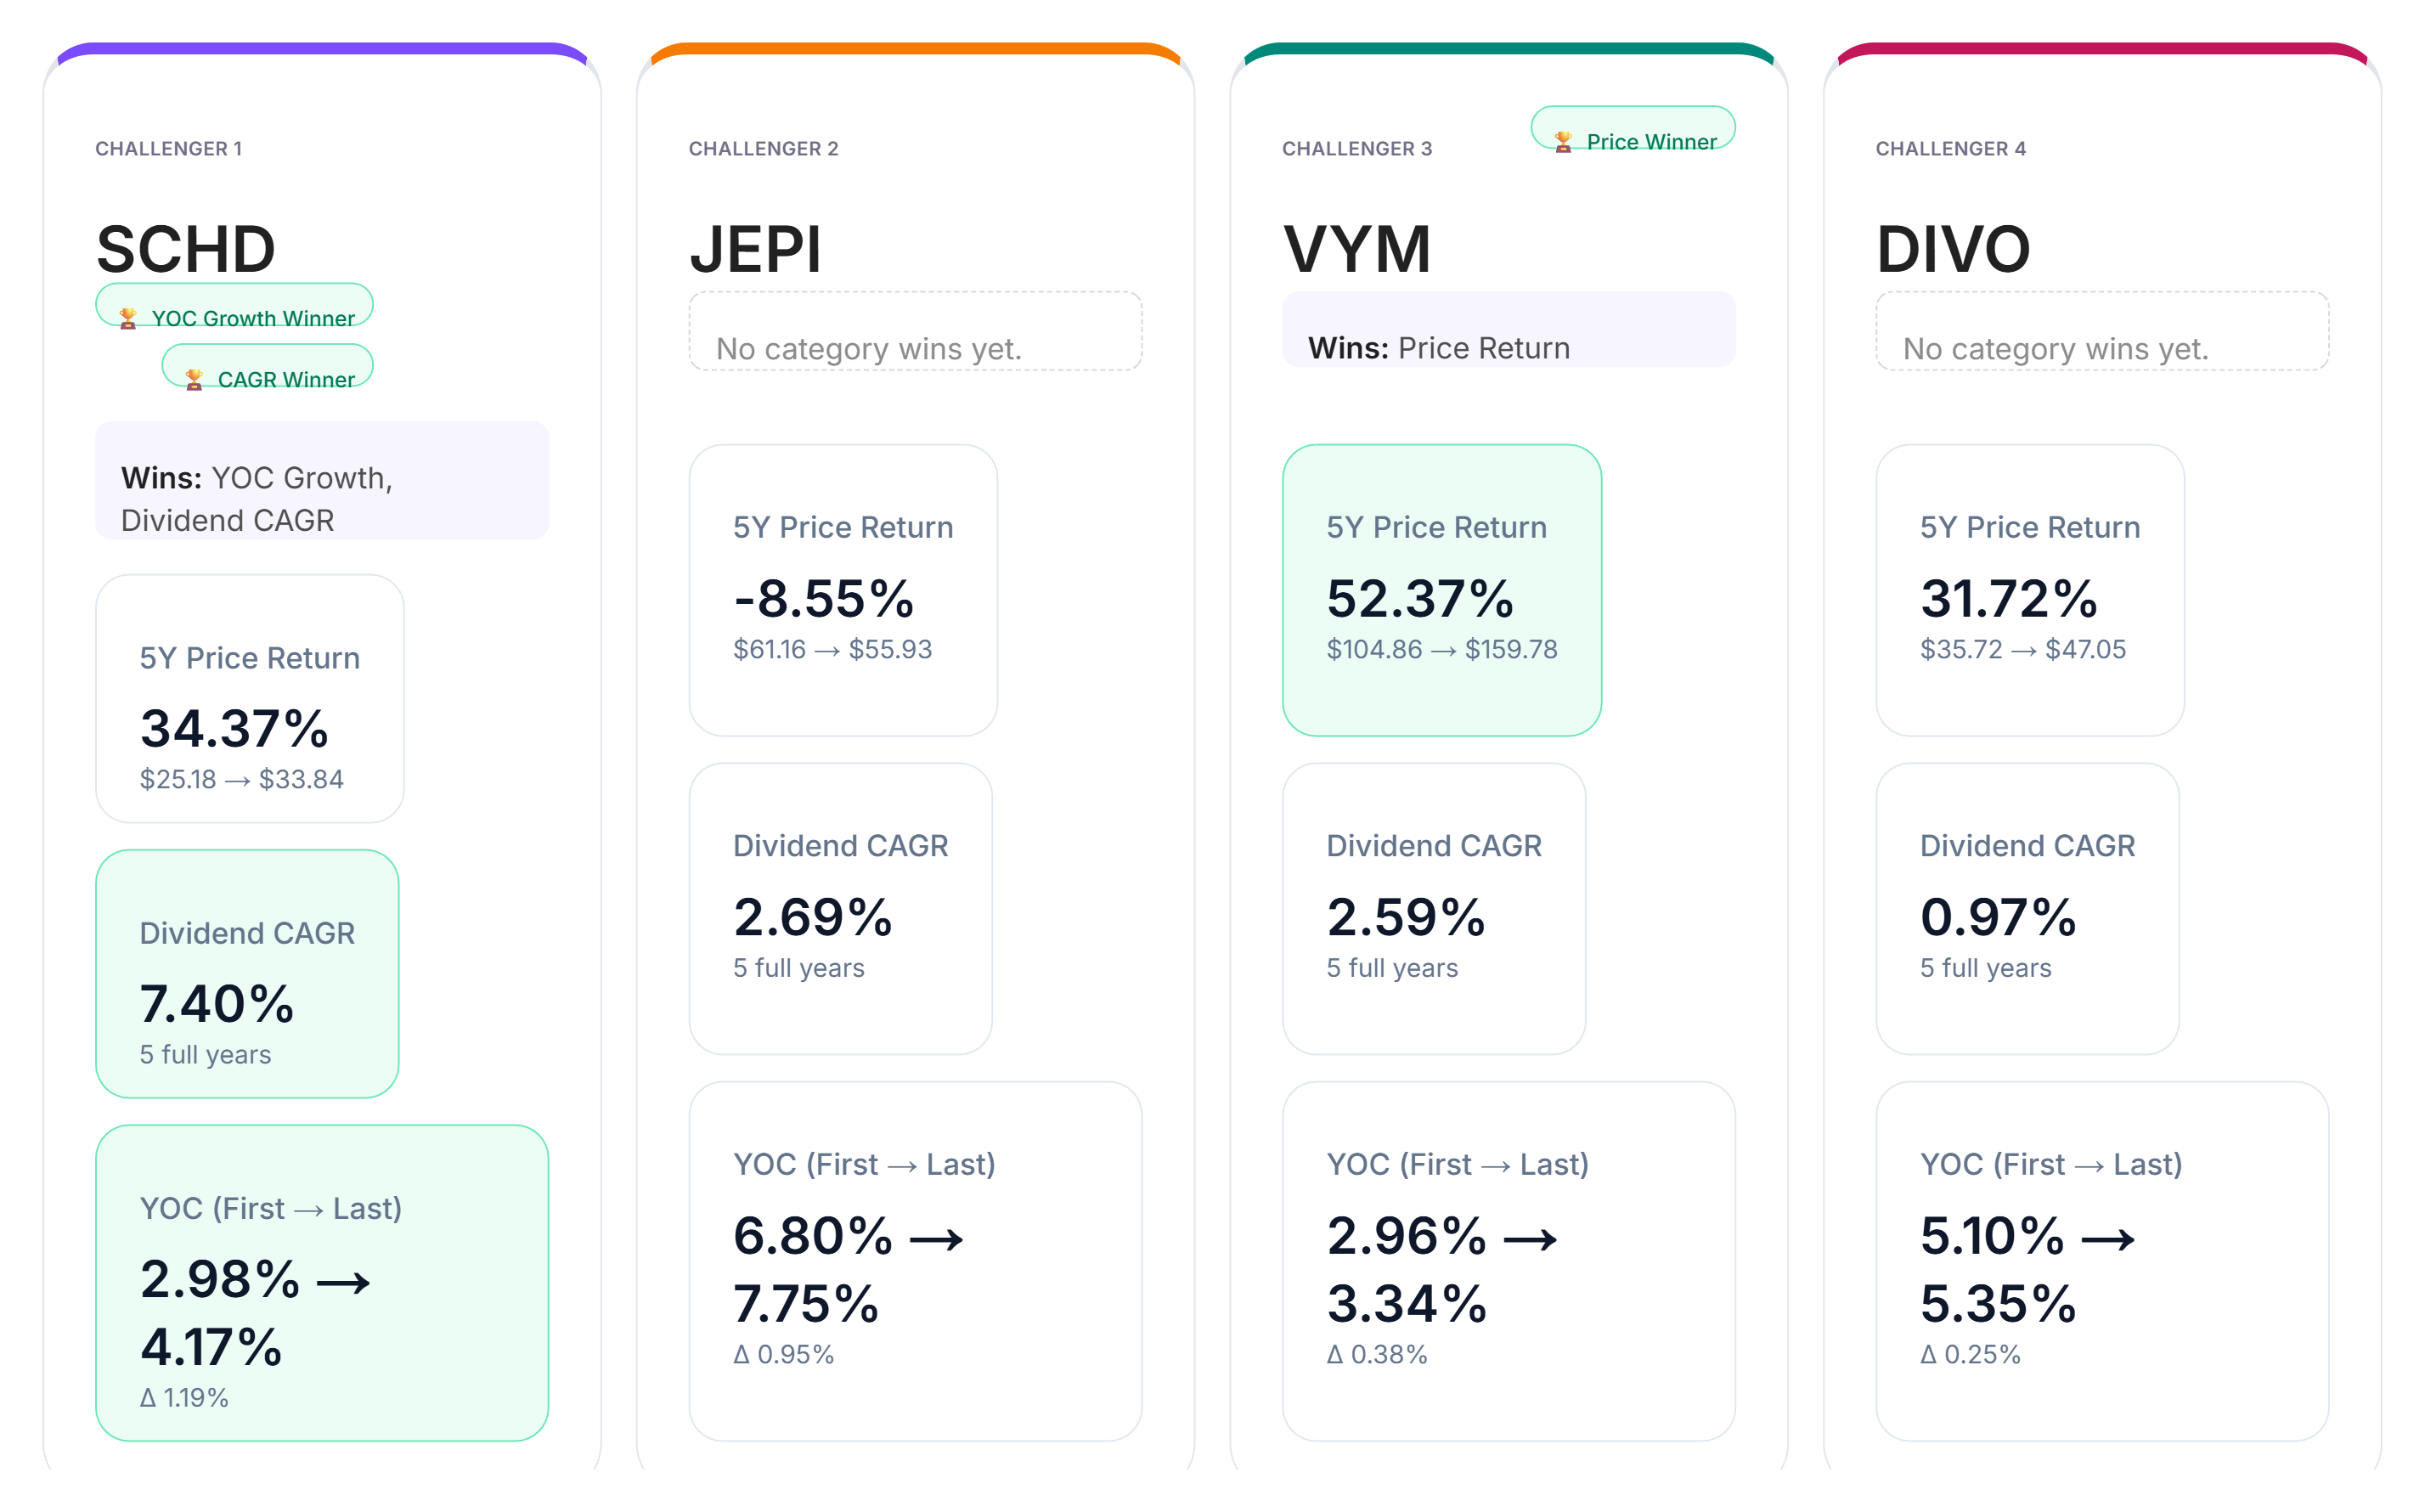
Looking at the five-year historical results across dividend growth, yield-on-cost growth, and price return, different strengths emerge.
In dividend growth, SCHD leads the group with a five-year dividend CAGR of 7.40%.
For yield-on-cost growth, SCHD also shows the strongest improvement from the first year to the last, highlighting how its income relative to the original investment increased over the period.
In price return, VYM takes the category win with a five-year return of 52.37%.
The comparison illustrates an important distinction between the different strategies. Leadership in dividend growth does not necessarily translate into leadership in price appreciation, while an ETF designed around higher current income can produce a very different income profile from a traditional dividend-growth fund.
Yield-on-Cost by Year
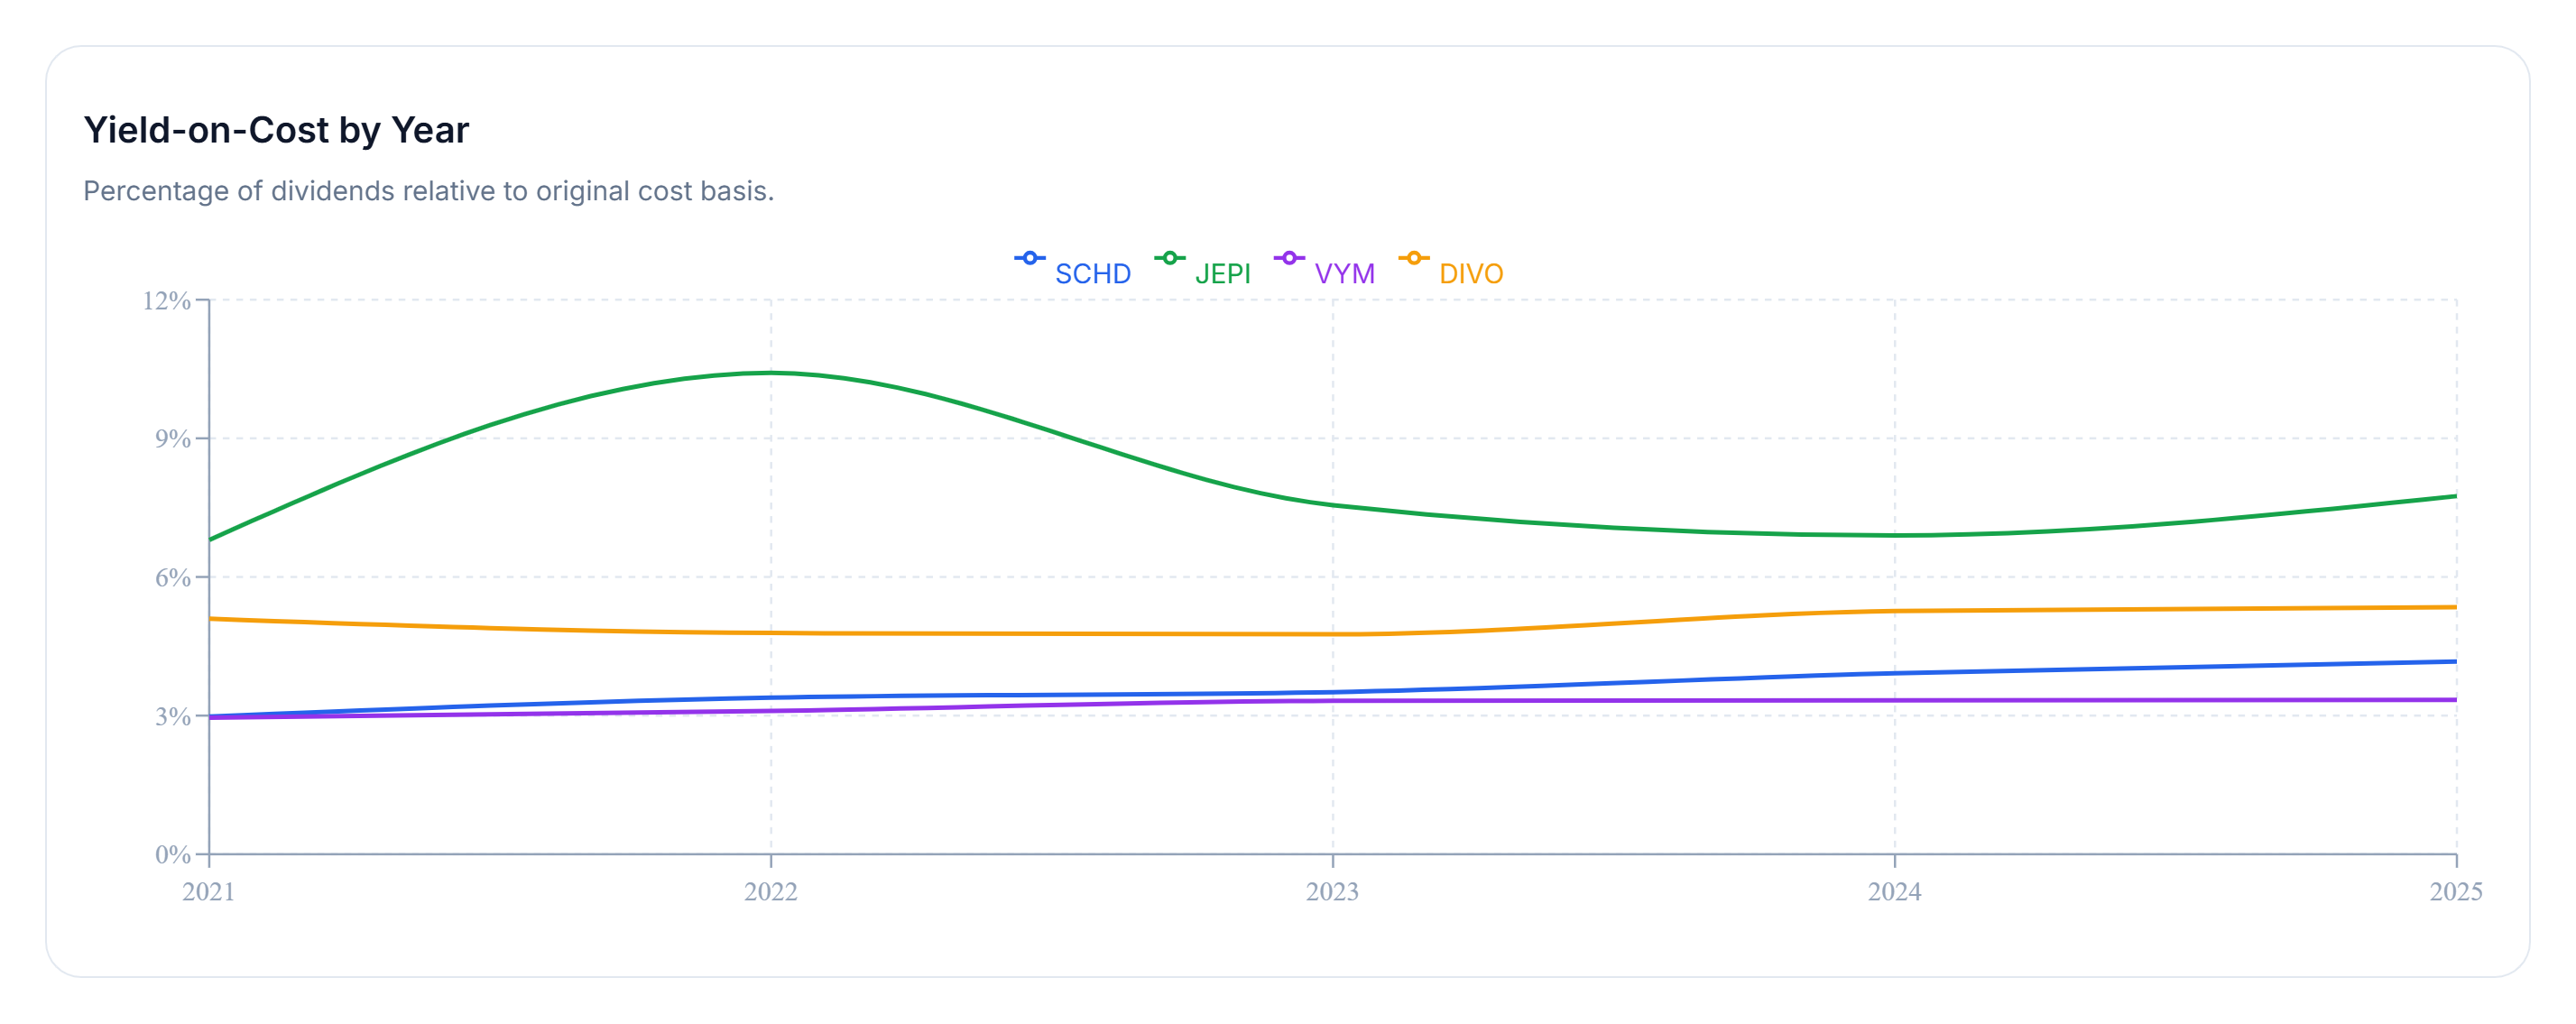
Yield on cost measures the income generated by an investment relative to the original capital invested rather than its current market price.
Across the five-year window, JEPI stands out for income efficiency, reaching approximately 7.75% yield on cost by the end of the period.
The other ETFs grow more gradually, but all show upward income trends over the same five-year window.
This creates an interesting contrast with the category winners. SCHD shows the strongest improvement in yield on cost from the first year to the last, while JEPI finishes the period with the highest income efficiency at approximately 7.75%.
For income-focused investors, that distinction matters. Starting income and the rate at which that income grows can produce very different outcomes, even when the investments are being compared over the same period.
Now let's shift from past performance to today's income picture.
Income Goal Comparison
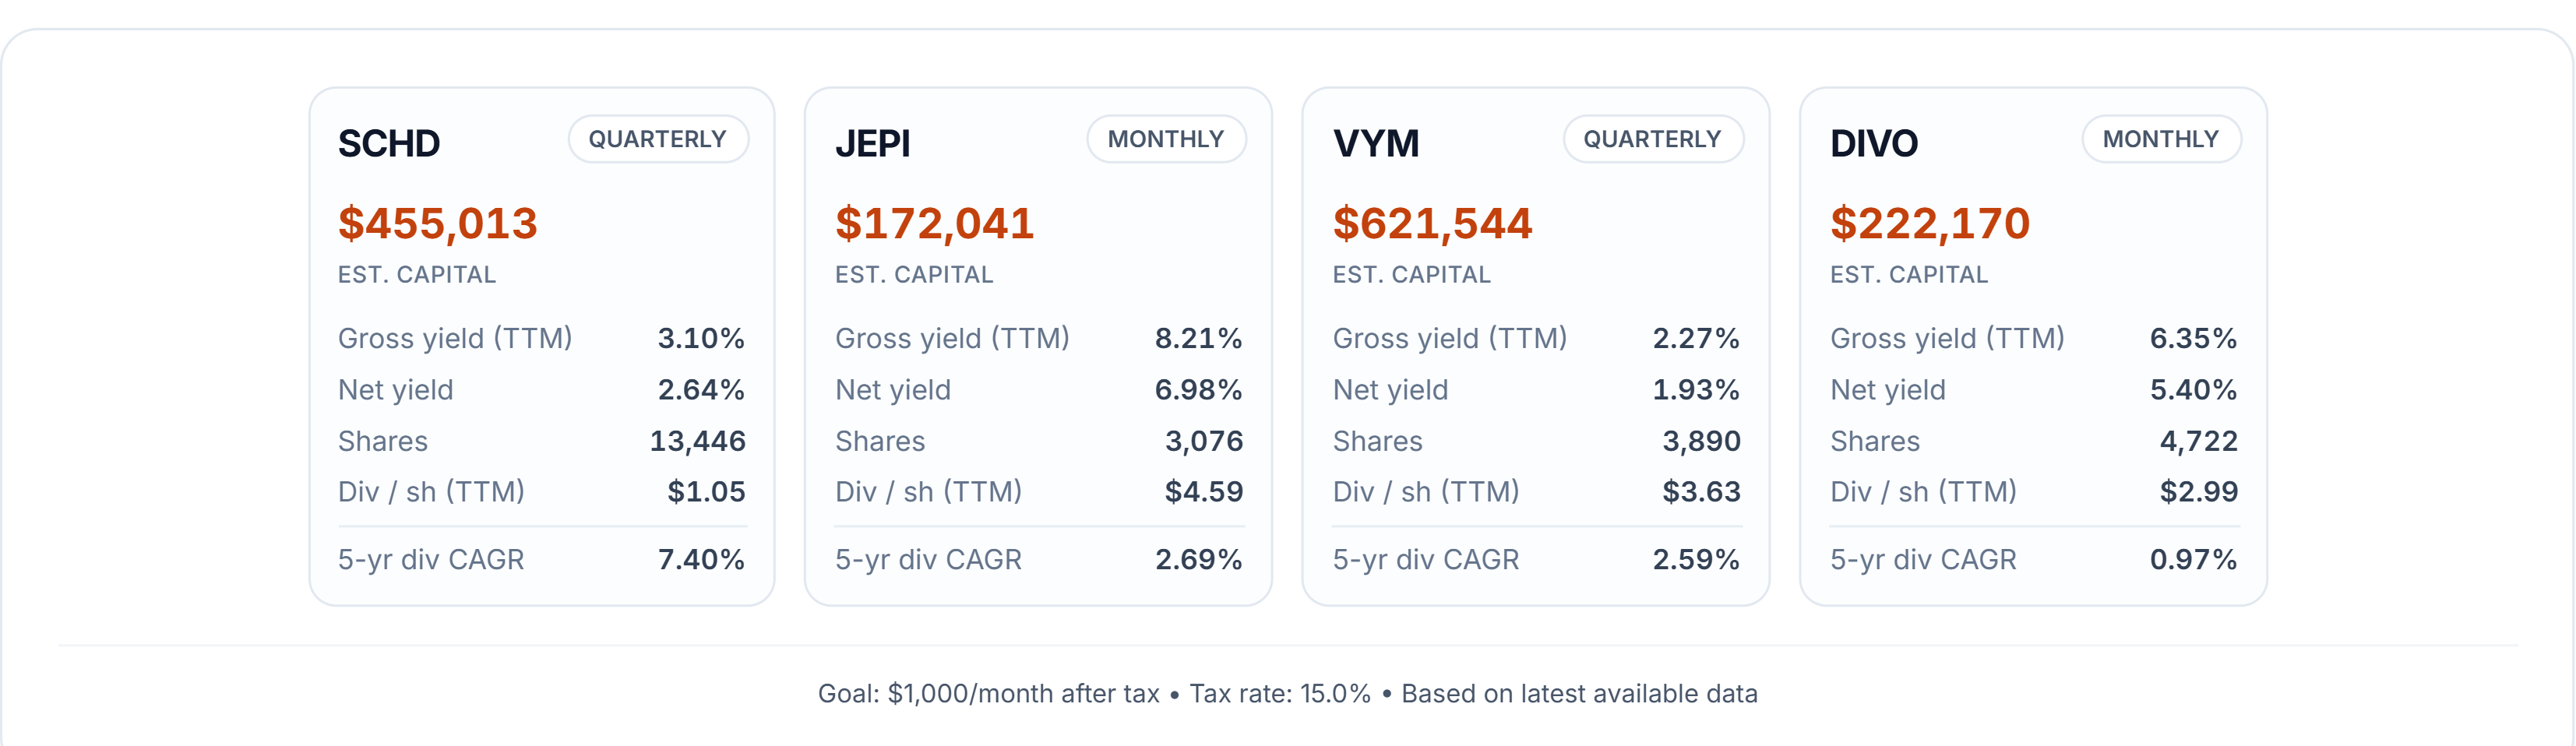
How much capital would be required today to generate $1,000 per month in after-tax income?
Using a 15% tax assumption, the difference between these ETFs is significant.
JEPI requires the least capital, at roughly $172,041, based on a current yield near 8.2%.
At the other end of the comparison, VYM requires about $621,544, with a current yield near 2.3%.
SCHD and DIVO fall between those two extremes, illustrating the tradeoff between current income and dividend growth without requiring additional figures beyond the available research.
The comparison makes the impact of starting yield particularly visible. A higher current yield can substantially reduce the amount of capital required to reach a specific income target today. A lower-yielding investment, however, may approach income generation differently by emphasizing dividend growth over time.
That leads directly to the final question: what happens if those dividends continue growing?
Yield Catch-Up Timeline
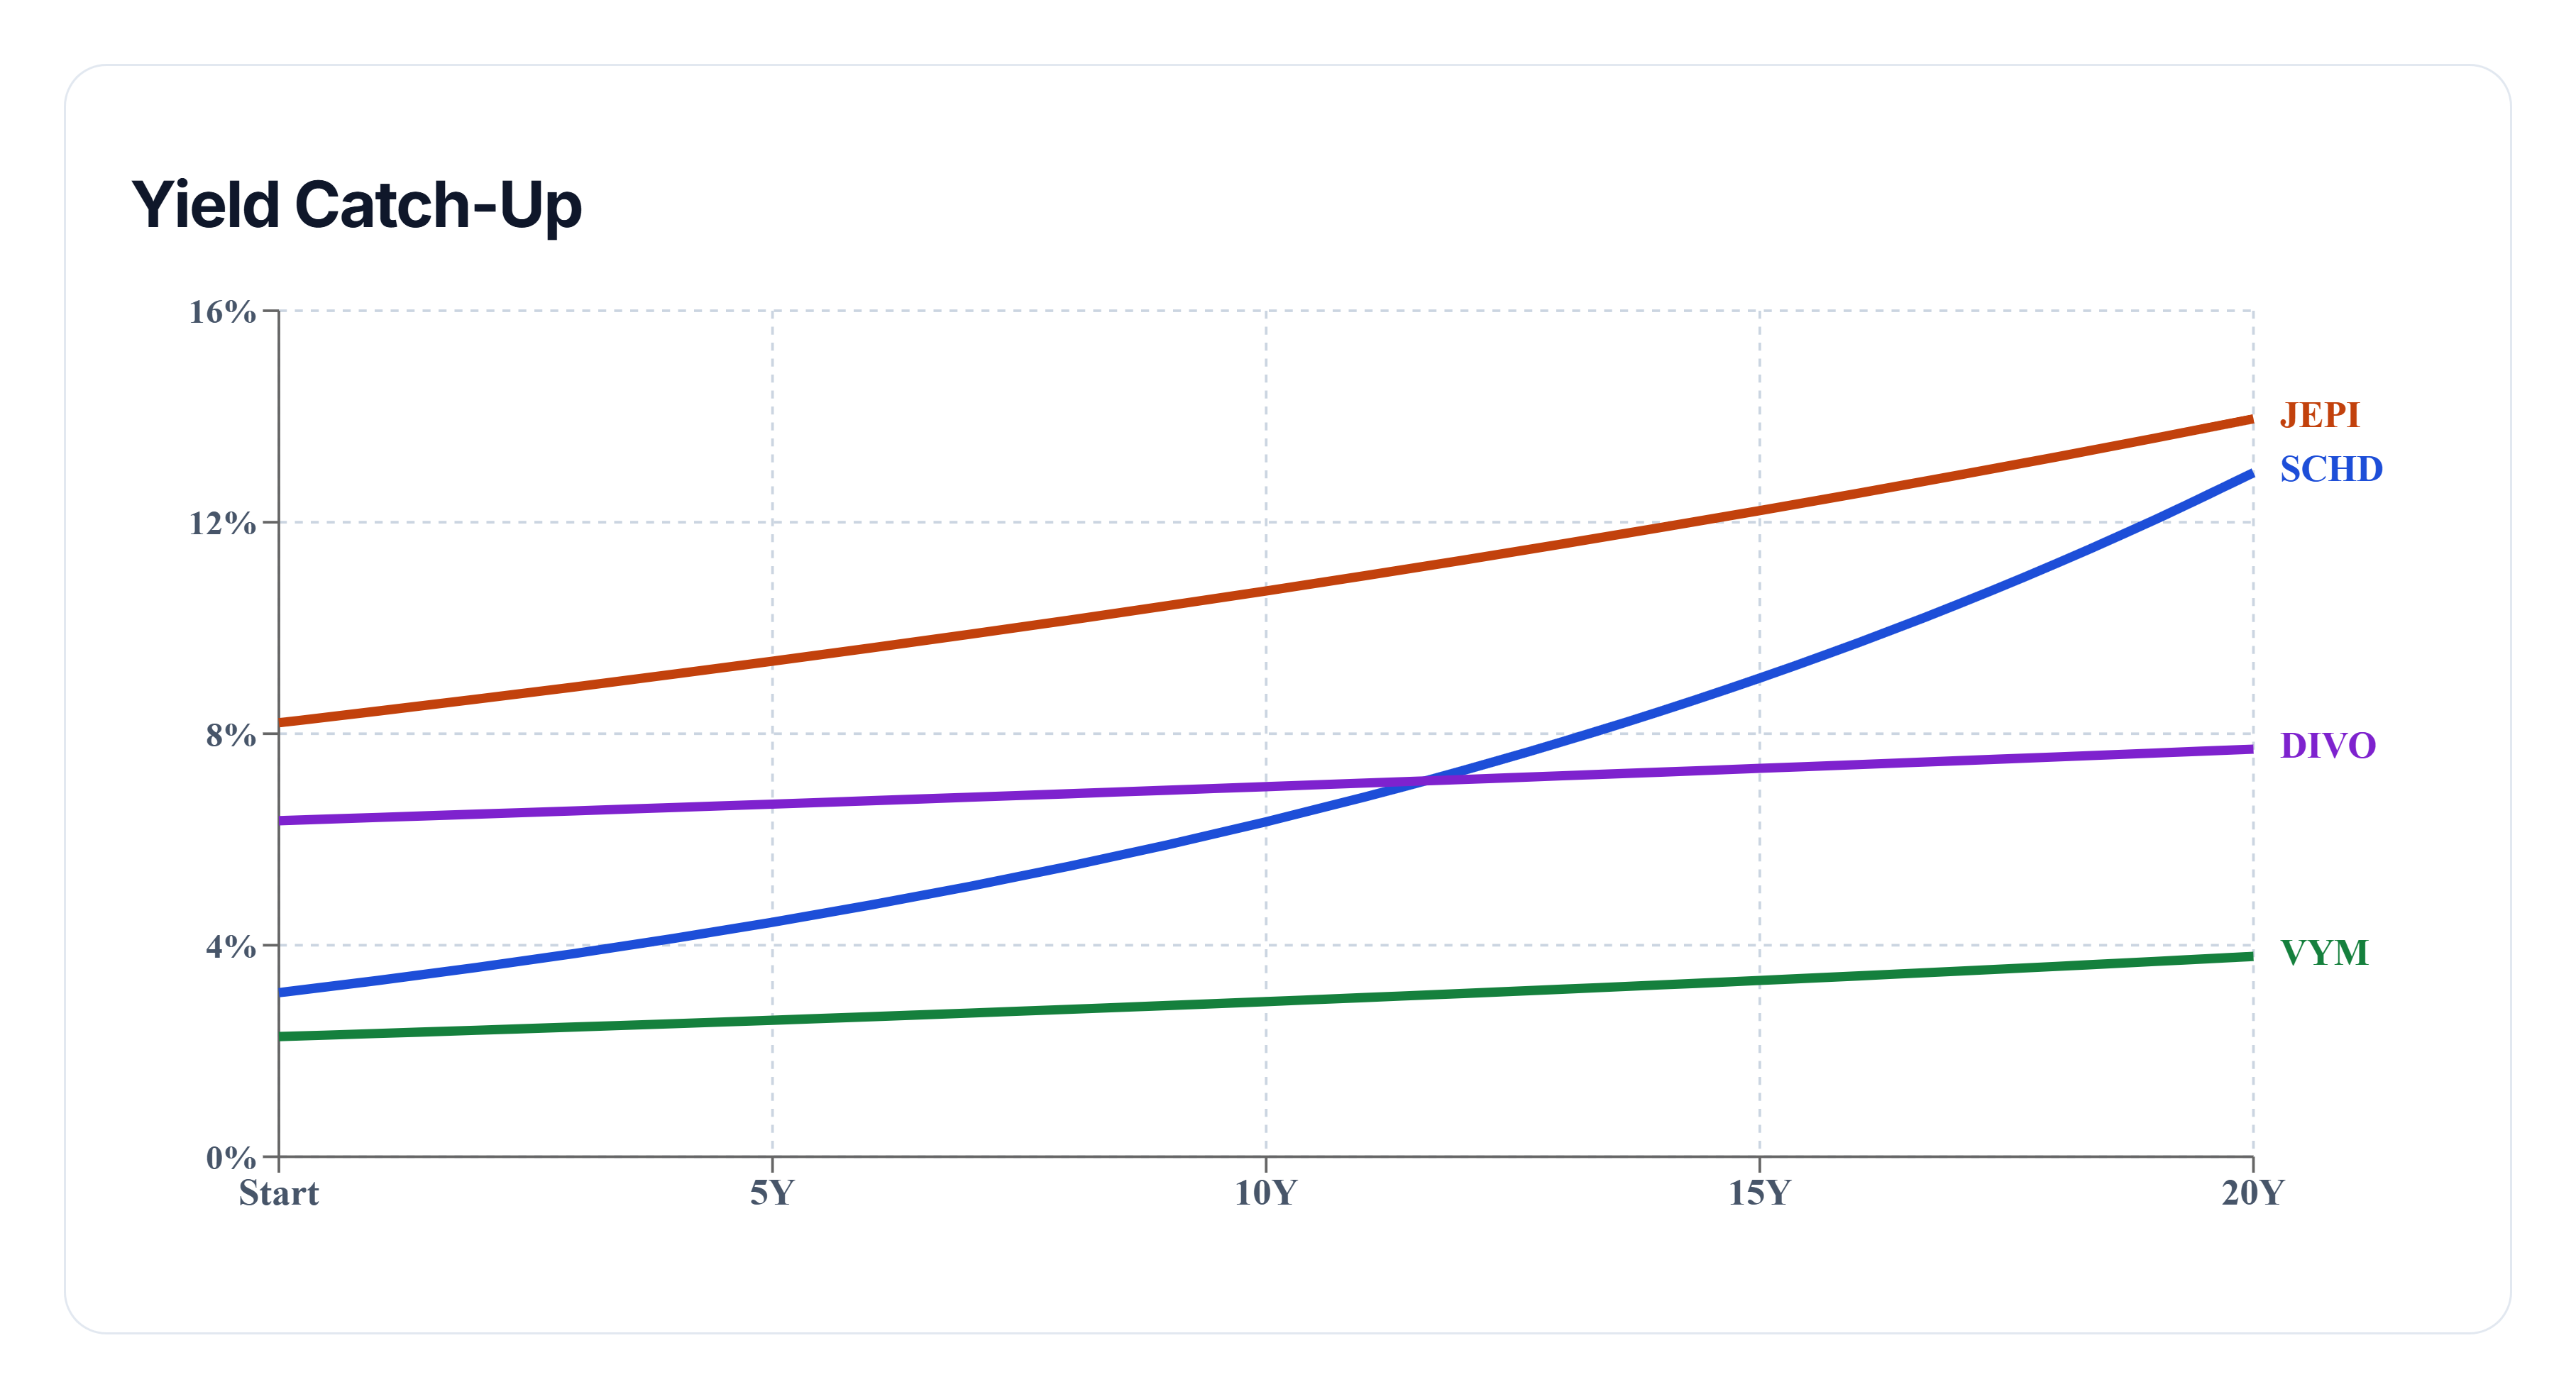
The yield catch-up projection shifts the analysis from today's income to a hypothetical view of how income efficiency could evolve over time.
The model assumes future dividend growth continues at a pace similar to the past five years.
SCHD enters the projection with the strongest modeled dividend growth rate, near 7.4%, while JEPI starts with the highest current yield, near 8.2%.
VYM begins much lower, at approximately 2.3%.
The key question is whether stronger dividend growth can eventually overcome the advantage created by a substantially higher starting yield.
Under these assumptions, VYM still does not catch JEPI in projected yield on cost within the 20-year projection period.
This highlights why both starting yield and dividend growth matter when evaluating income strategies. A higher starting yield creates an immediate income advantage, while stronger dividend growth can gradually change the relationship over longer periods.
The projection is not a forecast. It assumes historical dividend growth rates continue into the future, while actual distributions, dividend growth, and yields can change.
Final Takeaway
This battle highlights the different paths investors can take toward generating income.
Over the five-year historical window, SCHD leads dividend growth with a 7.40% CAGR and shows the strongest improvement in yield on cost from the first year to the last. VYM leads price return at 52.37%, while JEPI reaches approximately 7.75% yield on cost by the end of the period.
Today's income comparison reveals a different picture. For a $1,000 monthly after-tax income target using a 15% tax assumption, JEPI requires roughly $172,041 at a yield near 8.2%, compared with approximately $621,544 for VYM at a yield near 2.3%.
The 20-year projection then illustrates how difficult it can be for dividend growth alone to overcome a large starting-yield gap. Under the modeled assumptions, VYM does not catch JEPI in yield on cost during the projection period.
Together, the three phases show why historical dividend growth, current income, and projected income growth tell different parts of the story. Investors can use each perspective to better understand the tradeoffs among these different income-focused ETF strategies.
Past performance does not guarantee future results, and projections based on historical dividend growth should not be treated as predictions of future distributions or returns.