SCHD vs VIG vs DGRO: 9 Years of Dividend Growth
SCHD, VIG, and DGRO are all popular dividend-growth ETFs, but looking only at their current yields or a single long-term growth rate can hide an important part of the story.
Dividend growth does not happen at the same pace every year. Some periods bring double-digit increases, while others slow considerably.
Looking at annual dividend growth from 2017 through 2025 shows not only how quickly each ETF's distributions grew, but also the very different paths they took along the way.
SCHD, VIG, and DGRO all focus on dividend growth, but their year-to-year histories show that the path to long-term growth can look very different.
Rather than judging these ETFs by one headline number, the annual data gives us a better view of when dividend growth accelerated, when it slowed, and how consistent that growth actually was.
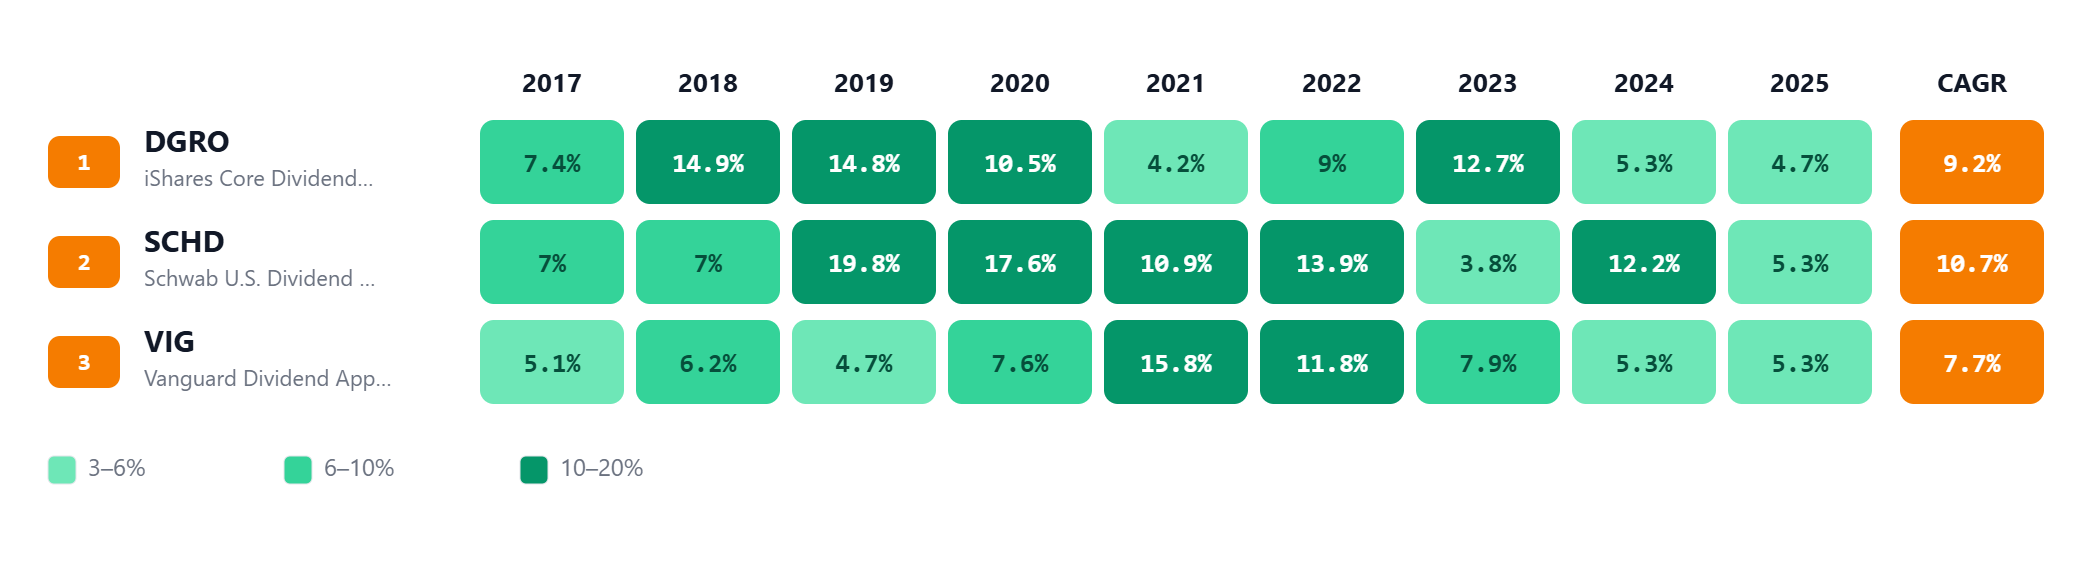
The heatmap shows that the three ETFs reached their long-term dividend growth rates through very different year-to-year patterns.
SCHD: Higher Growth, Bigger Swings
SCHD produced the highest dividend growth CAGR of the three over this period at 10.7%, but its annual results were far from consistent.
Some of its strongest years were exceptional. Dividend growth reached 19.8% in 2019, 17.6% in 2020, and 13.9% in 2022.
Then the pattern changed sharply. Growth dropped to just 3.8% in 2023 before rebounding to 12.2% in 2024.
DGRO: A Different Growth Pattern
DGRO finished with a 9.2% dividend growth CAGR, relatively close to SCHD, but the path looked different.
Dividend growth was roughly 15% in both 2018 and 2019, followed by 10.5% in 2020.
DGRO also delivered 12.7% growth in 2023, the same year SCHD experienced one of its weakest increases.
More recently, growth moderated to 5.3% in 2024 and 4.7% in 2025.
VIG: Strongest Years Came Later
VIG recorded a 7.7% dividend growth CAGR over the period.
Unlike SCHD and DGRO, some of VIG's strongest growth came later in the timeline. Dividend growth jumped to 15.8% in 2021 and remained strong at 11.8% in 2022.
Since then, growth has moderated, ending 2025 at approximately 5.3%.
What the Heatmap Reveals
This is where the visualization becomes more useful than looking at CAGR alone.
A long-term CAGR compresses the entire period into one number. It tells us the compounded rate of growth, but it doesn't show how that growth was distributed across individual years.
SCHD's higher CAGR was supported by several particularly strong years. DGRO finished relatively close behind while following its own year-to-year pattern, while VIG produced more moderate dividend growth overall.
The annual results also show why it can be useful to look beyond which ETF finished with the highest CAGR. Leadership changed from year to year, and periods of exceptional growth were often followed by much more moderate increases.
Final Takeaway
Dividend growth is more than a single CAGR.
For investors comparing dividend-growth ETFs, the annual history adds useful context by showing when growth accelerated, when it slowed, and how much the experience varied along the way.
SCHD, DGRO, and VIG all grew their distributions over this period, but they did not get there in the same way.
SCHD recorded the highest long-term dividend growth rate in this comparison, but with significant variation between individual years. DGRO finished relatively close behind through a different sequence of strong and moderate years, while VIG's strongest period arrived later in the timeline.
The practical takeaway is not that one pattern is necessarily better than another. It is that a long-term growth rate becomes more informative when you can see the individual years behind it.
If you want to explore more dividend ETF comparisons and visual analysis, explore DividendXray.