SCHD vs VIG: When Dividend Income and Total Return Tell Different Stories
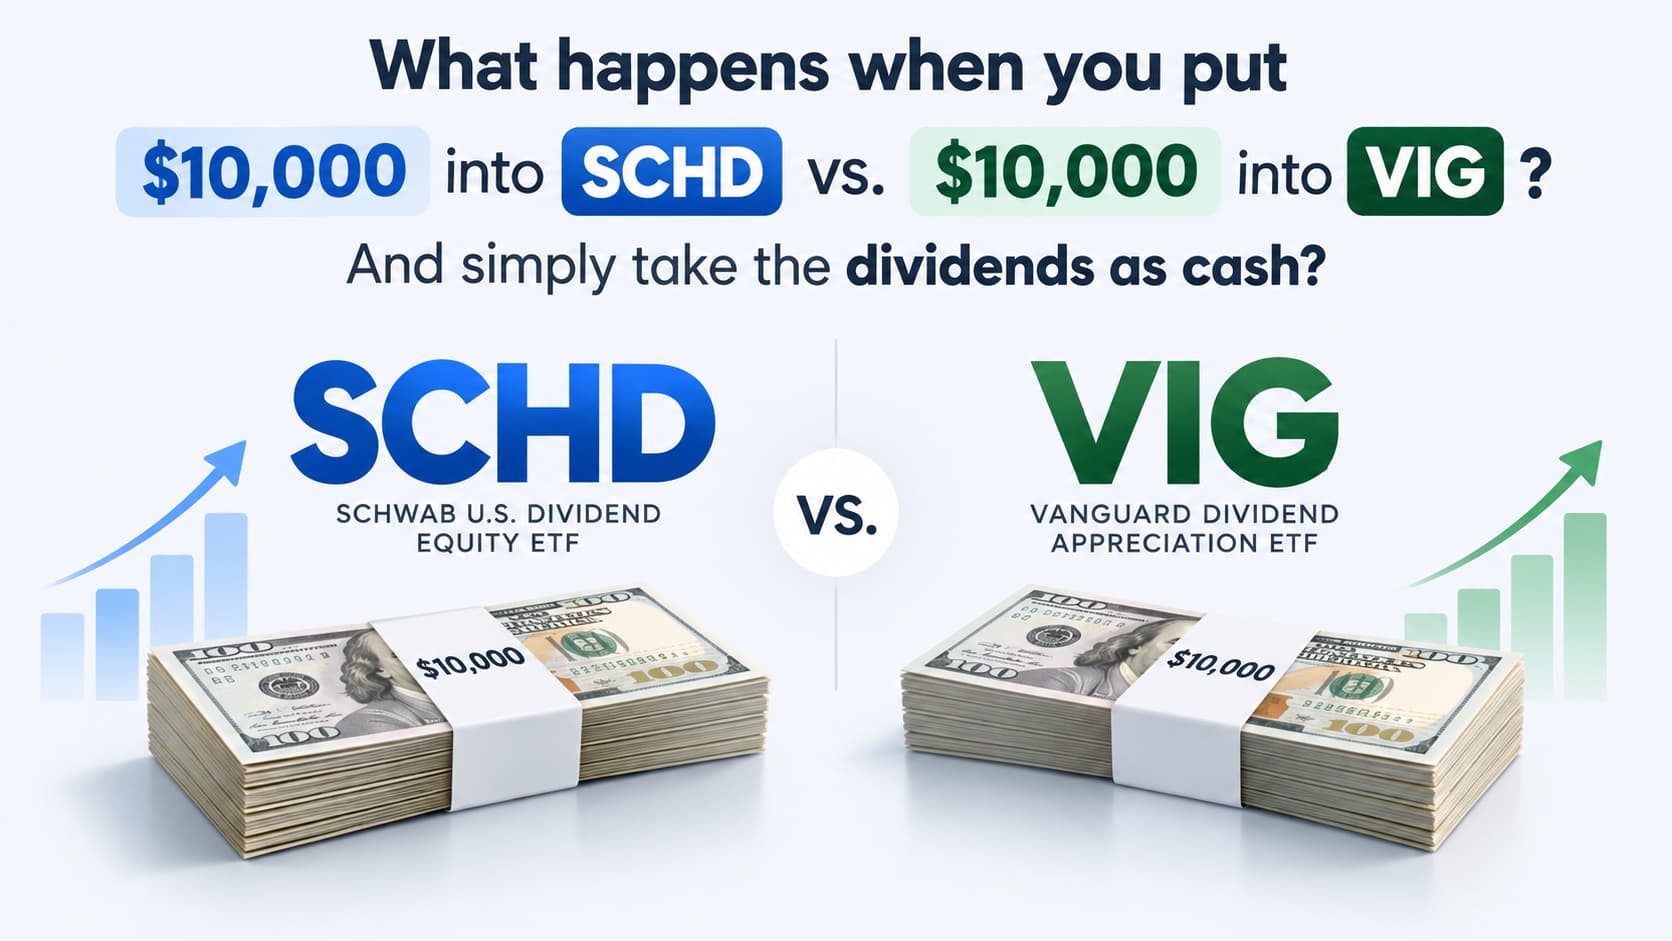
SCHD and VIG are both widely followed dividend-growth ETFs, but an equal investment in the two funds can produce very different results depending on what an investor chooses to measure.
Starting with $10,000 in each ETF, this analysis follows the annual cash income generated from 2018 through 2025. Dividends are taken as cash rather than reinvested.
The income comparison strongly favors SCHD by the end of the period. But once price appreciation and reinvested dividends enter the picture, the story changes.
That contrast is what makes this comparison useful: dividend income and total return measure two different outcomes.
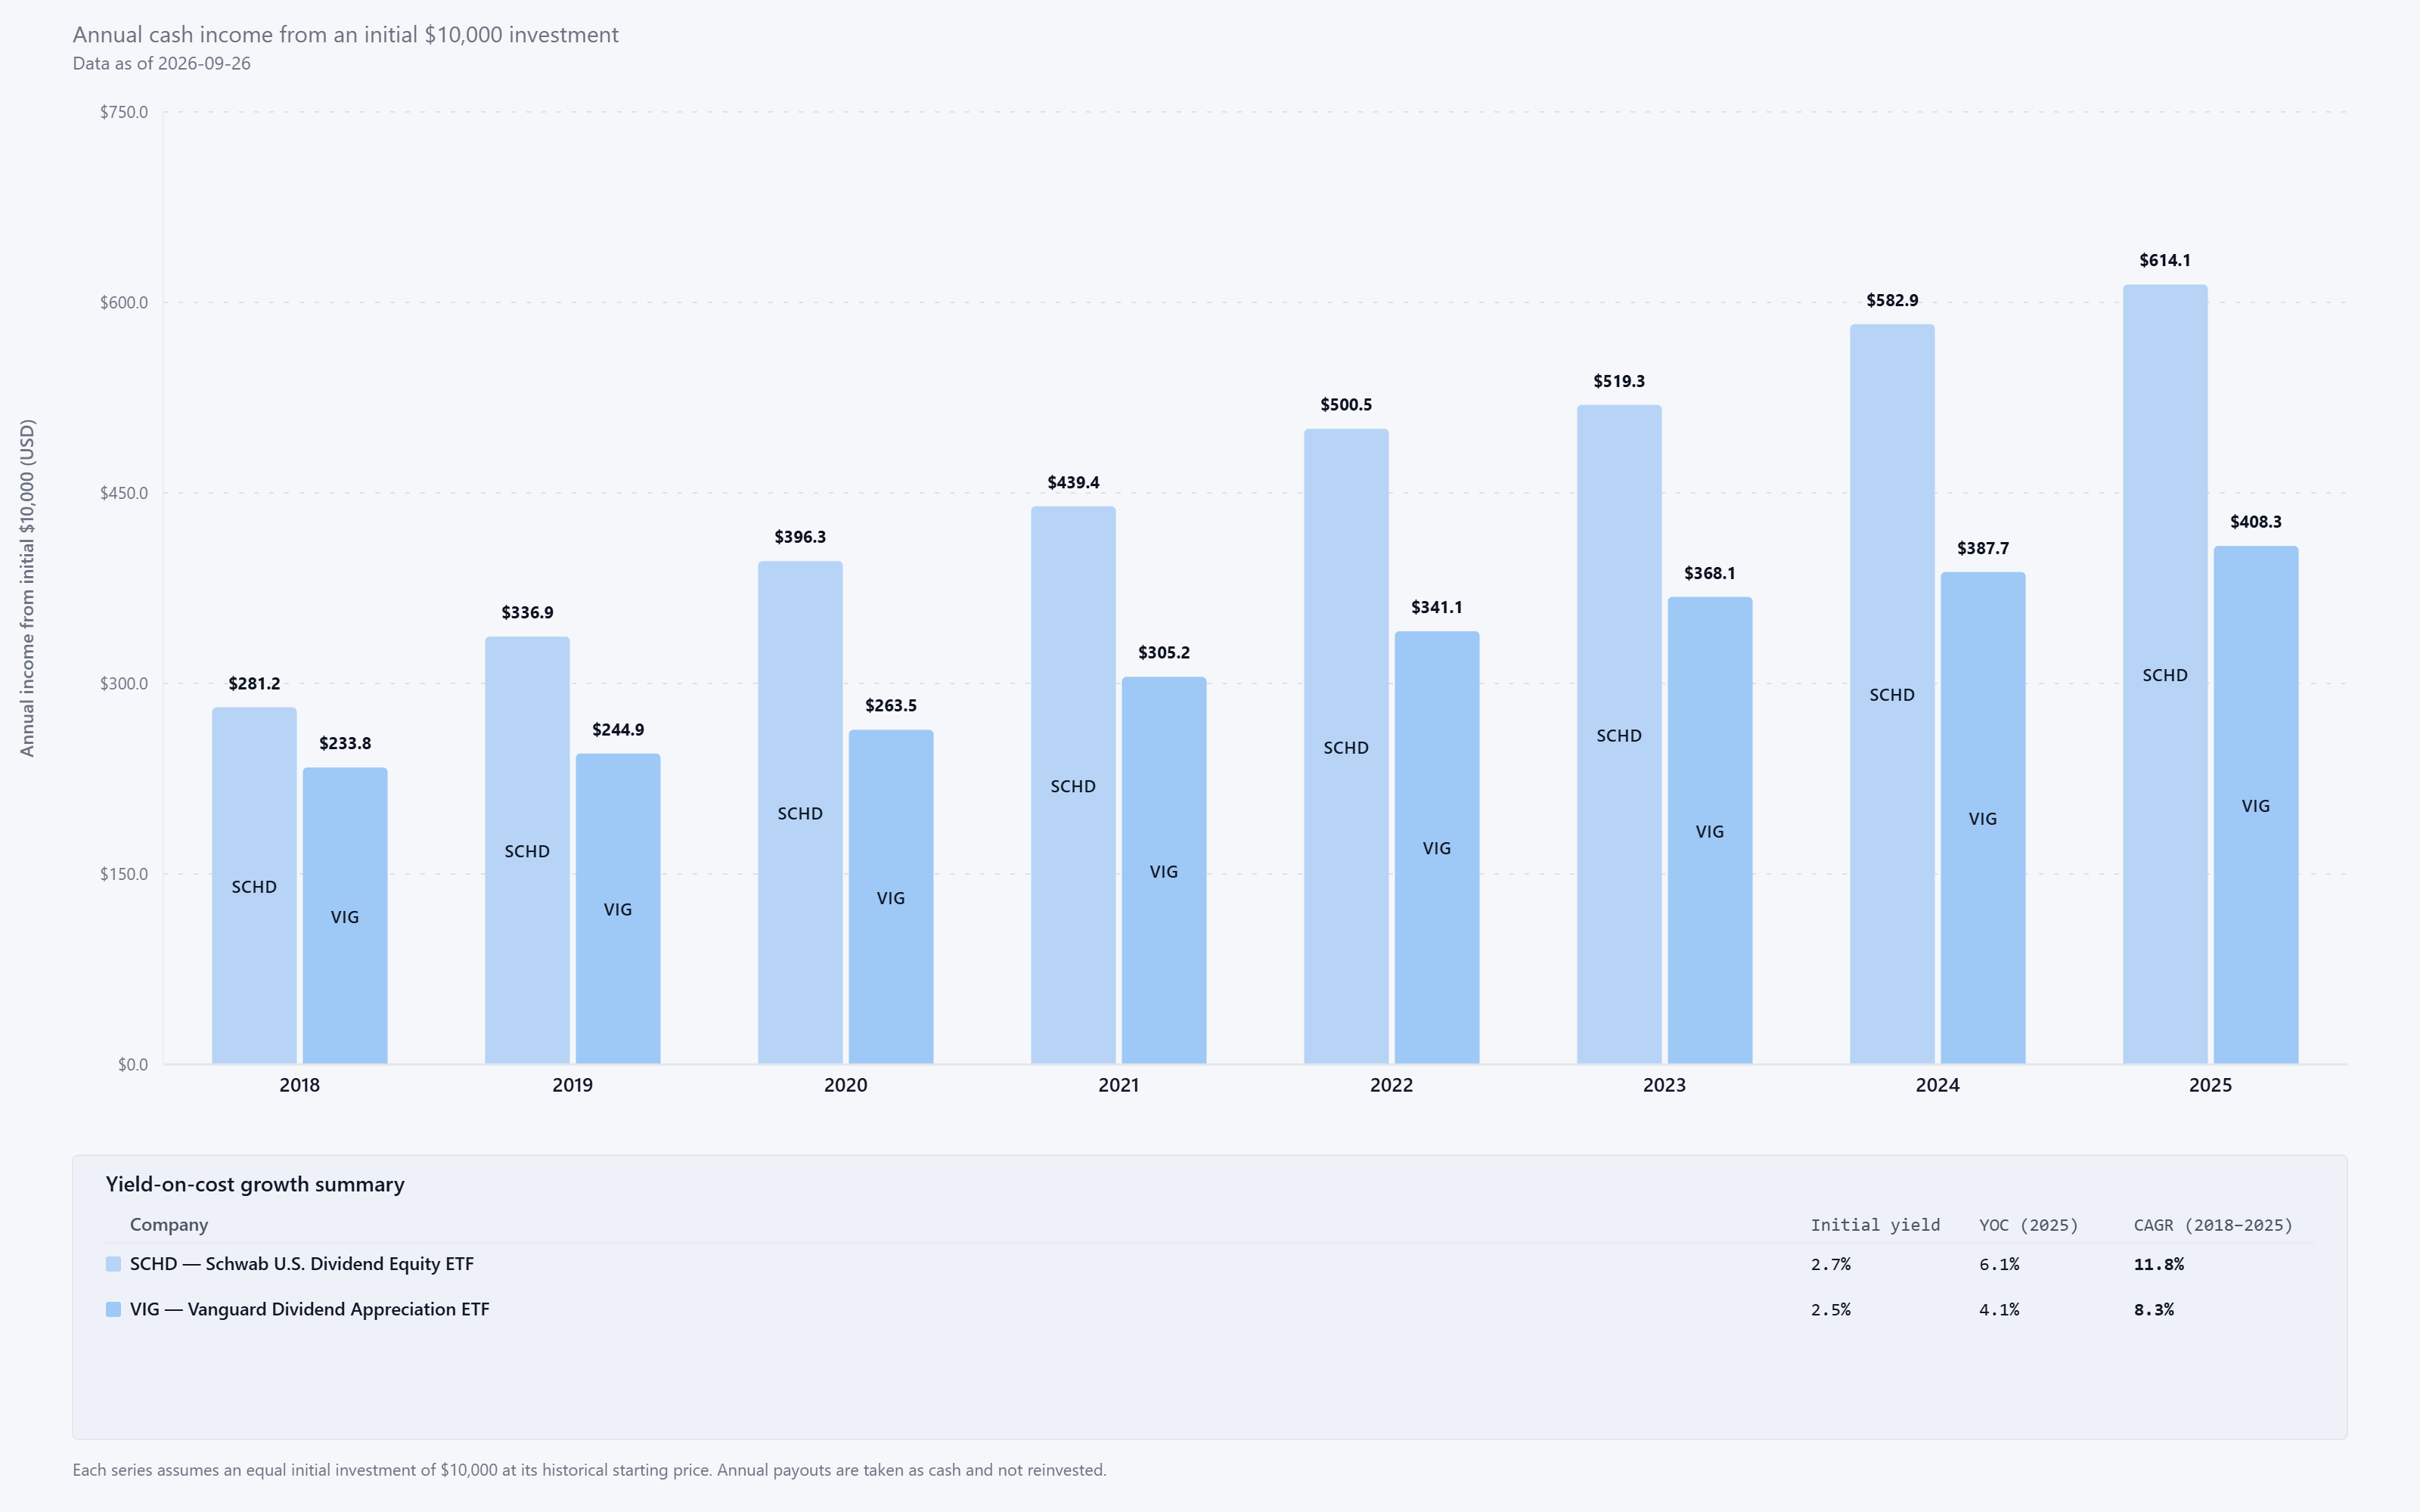
The chart tracks the annual cash distributions generated by an initial $10,000 investment in SCHD and VIG.
In 2018, SCHD generated about $281 in annual cash income, compared with roughly $234 from VIG. Both income streams then increased every year through 2025, even though the dividends were not reinvested.
The gap gradually became much larger.
By 2020, SCHD was generating about $396 annually compared with $264 from VIG. SCHD crossed $500 in 2022, while VIG produced about $341.
By 2025, the original $10,000 investment was generating approximately $614 per year from SCHD versus $408 from VIG.
The yield-on-cost figures show the same divergence. SCHD began with an initial yield of roughly 2.7% and reached about 6.1% on the original investment by 2025. VIG moved from approximately 2.5% to 4.1%.
From 2018 through 2025, SCHD's annual income grew at roughly 11.8% per year, compared with about 8.3% for VIG.
For an investor focused specifically on the cash generated by the original investment, that difference is meaningful.
But it does not tell us which investment produced the larger overall portfolio.
The Total-Return Picture Changes the Story
When dividends are reinvested and price appreciation is included, the comparison moves in the opposite direction.
Over the same 2018–2025 period, the original $10,000 grew to roughly $21,200 in SCHD compared with approximately $25,000 in VIG.
That creates an important distinction.
SCHD produced the larger cash-income stream during this period, while VIG produced the larger ending portfolio value when dividends were reinvested.
A faster-growing dividend does not automatically translate into a higher total return. Likewise, the investment with the higher total return does not necessarily generate the most current income.
These are different measurements answering different investor questions.
Final Takeaway
SCHD and VIG demonstrate why dividend ETF comparisons should not stop at yield or dividend growth alone.
From the same $10,000 starting investment, SCHD's cash income grew substantially faster and reached about $614 annually by 2025, compared with about $408 for VIG.
Yet when dividends were reinvested and total return was considered, VIG ended the period with the larger portfolio value.
Neither measurement tells the entire story by itself. Investors evaluating dividend ETFs can benefit from looking at income growth, yield on cost, price appreciation, and total return together.
DividendXray helps visualize these differences so you can compare dividend investments from more than one angle.
This analysis uses historical data for educational and informational purposes only and is not investment advice.