$10,000 in SCHD vs. JEPI: Five Years of Income Compared
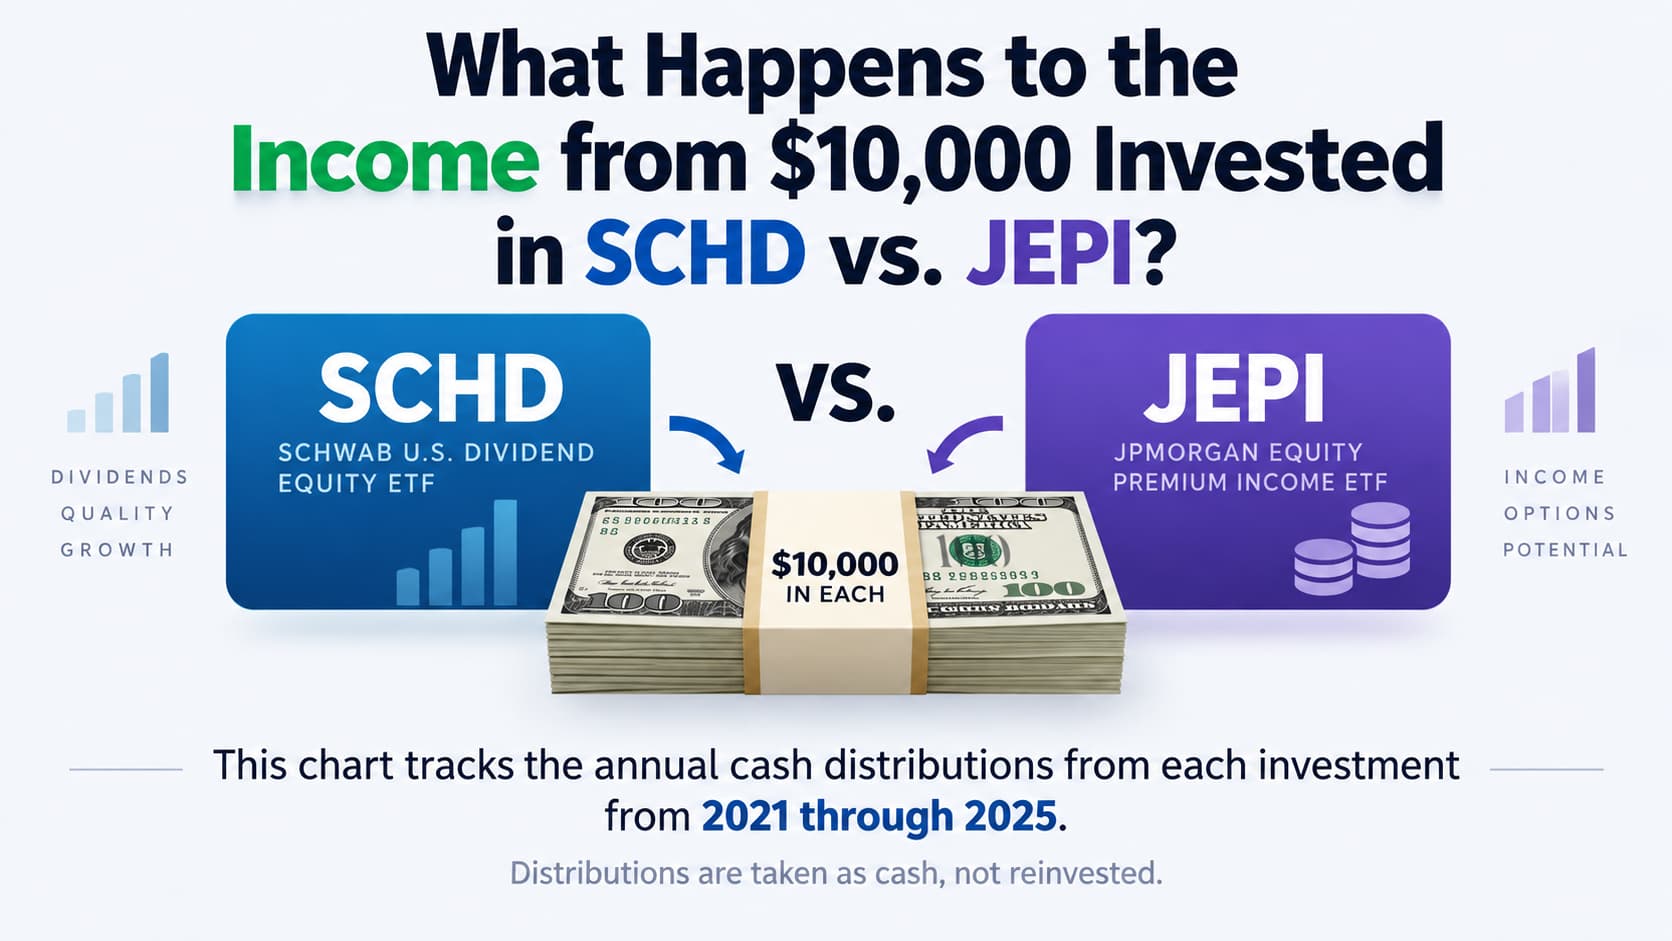
A $10,000 investment in SCHD and a $10,000 investment in JEPI can produce very different streams of cash income.
From 2021 through 2025, JEPI generated substantially more annual distributions from the original investment. SCHD started at a much lower income level, but its distributions followed a steadier growth path.
That makes the comparison interesting—but it is important to be precise about what the chart actually measures.
This is an income comparison, not a total-return comparison.
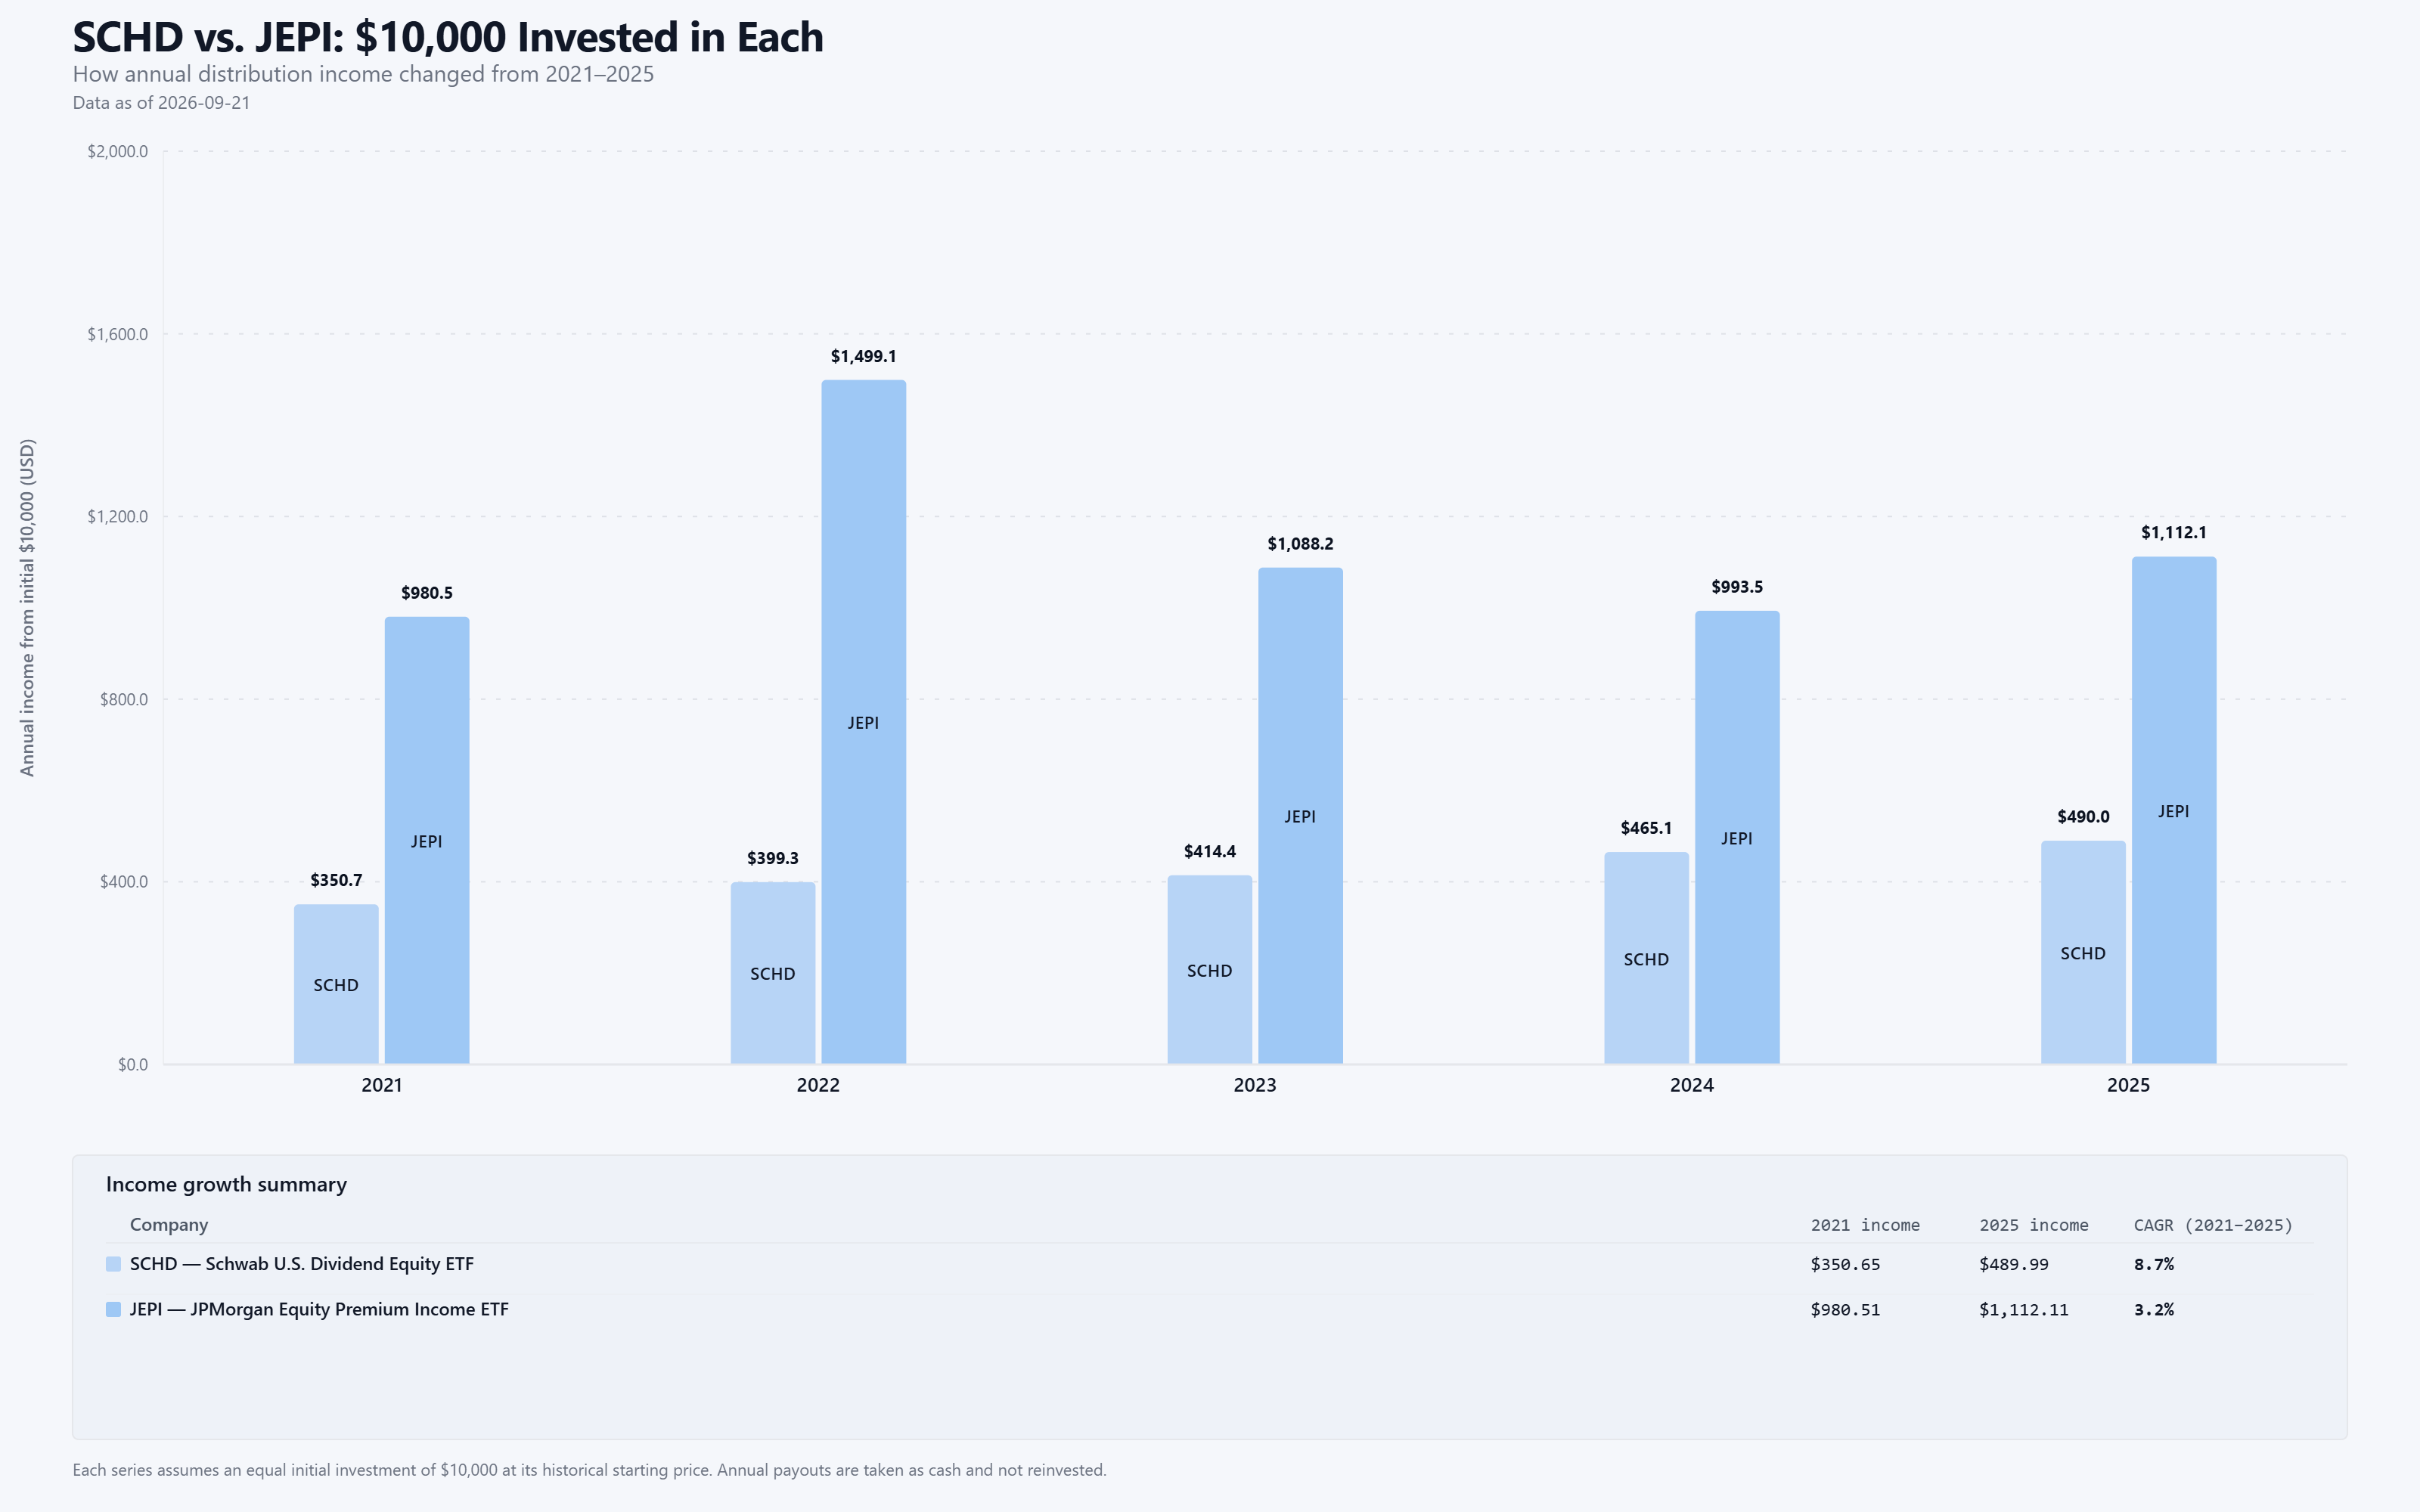
Starting with an equal $10,000 investment, SCHD generated about $351 of annual income in 2021, compared with approximately $981 from JEPI.
The difference became even larger in 2022. SCHD's annual income increased to roughly $399, while JEPI's distributions climbed to nearly $1,500—the highest annual payout shown in the five-year period.
JEPI's income then moved sharply lower. It generated approximately $1,088 in 2023 and $994 in 2024 before increasing to about $1,112 in 2025.
SCHD followed a different pattern. Its annual income increased from approximately $351 in 2021 to $490 in 2025.
Across the period shown, that represents annualized income growth of about 8.7% for SCHD compared with about 3.2% for JEPI.
The contrast is straightforward: JEPI generated substantially more cash income in every year shown, while SCHD delivered faster income growth from its much lower starting level.
But a taller income bar does not mean better overall investment performance.
The chart measures distributions generated by the original $10,000 investments, with those distributions taken as cash rather than reinvested. It does not account for changes in share price, reinvestment, or total return.
That distinction is especially important because SCHD and JEPI use very different strategies.
SCHD follows an index-based dividend strategy focused on dividend-paying U.S. companies selected using dividend history and fundamental criteria. JEPI combines an actively managed equity portfolio with an options strategy designed to generate additional income.
Those differences mean the two funds are not simply competing versions of the same strategy. JEPI's higher distributions come from a structure built specifically around generating income, while that structure can also limit participation in some market upside.
This chart therefore answers a narrower question: what happened to the annual cash income generated by the same initial investment?
It does not answer which ETF delivered the better total return.
Final Takeaway
Starting with $10,000 in each, SCHD and JEPI produced two very different income paths between 2021 and 2025.
JEPI delivered much more immediate cash income throughout the period. SCHD generated less income, but its annual distributions grew more consistently and at a faster annualized rate over the years shown.
Neither observation tells the entire investment story.
Income, income growth, price appreciation, volatility and total return measure different aspects of an investment. A useful comparison depends on which question an investor is trying to answer.
For this chart, the question is deliberately narrow: how did the annual cash income from the original $10,000 change over time?
Explore more dividend ETF comparisons and visual analyses on DividendXray.
This analysis is for educational and informational purposes only and is not investment advice.