How SCHD's Top Holdings Grew Dividend Income Over Time
Dividend investors often begin by comparing current dividend yields.
While yield is an important starting point, it doesn't explain how much income an investment may generate several years from now. Companies that consistently increase their dividends can quietly transform a portfolio's income without requiring investors to chase ever-higher yields.
This visual analysis follows the top 10 holdings in SCHD between 2018 and 2025, showing how steady dividend growth contributed to a significant increase in annual dividend income.
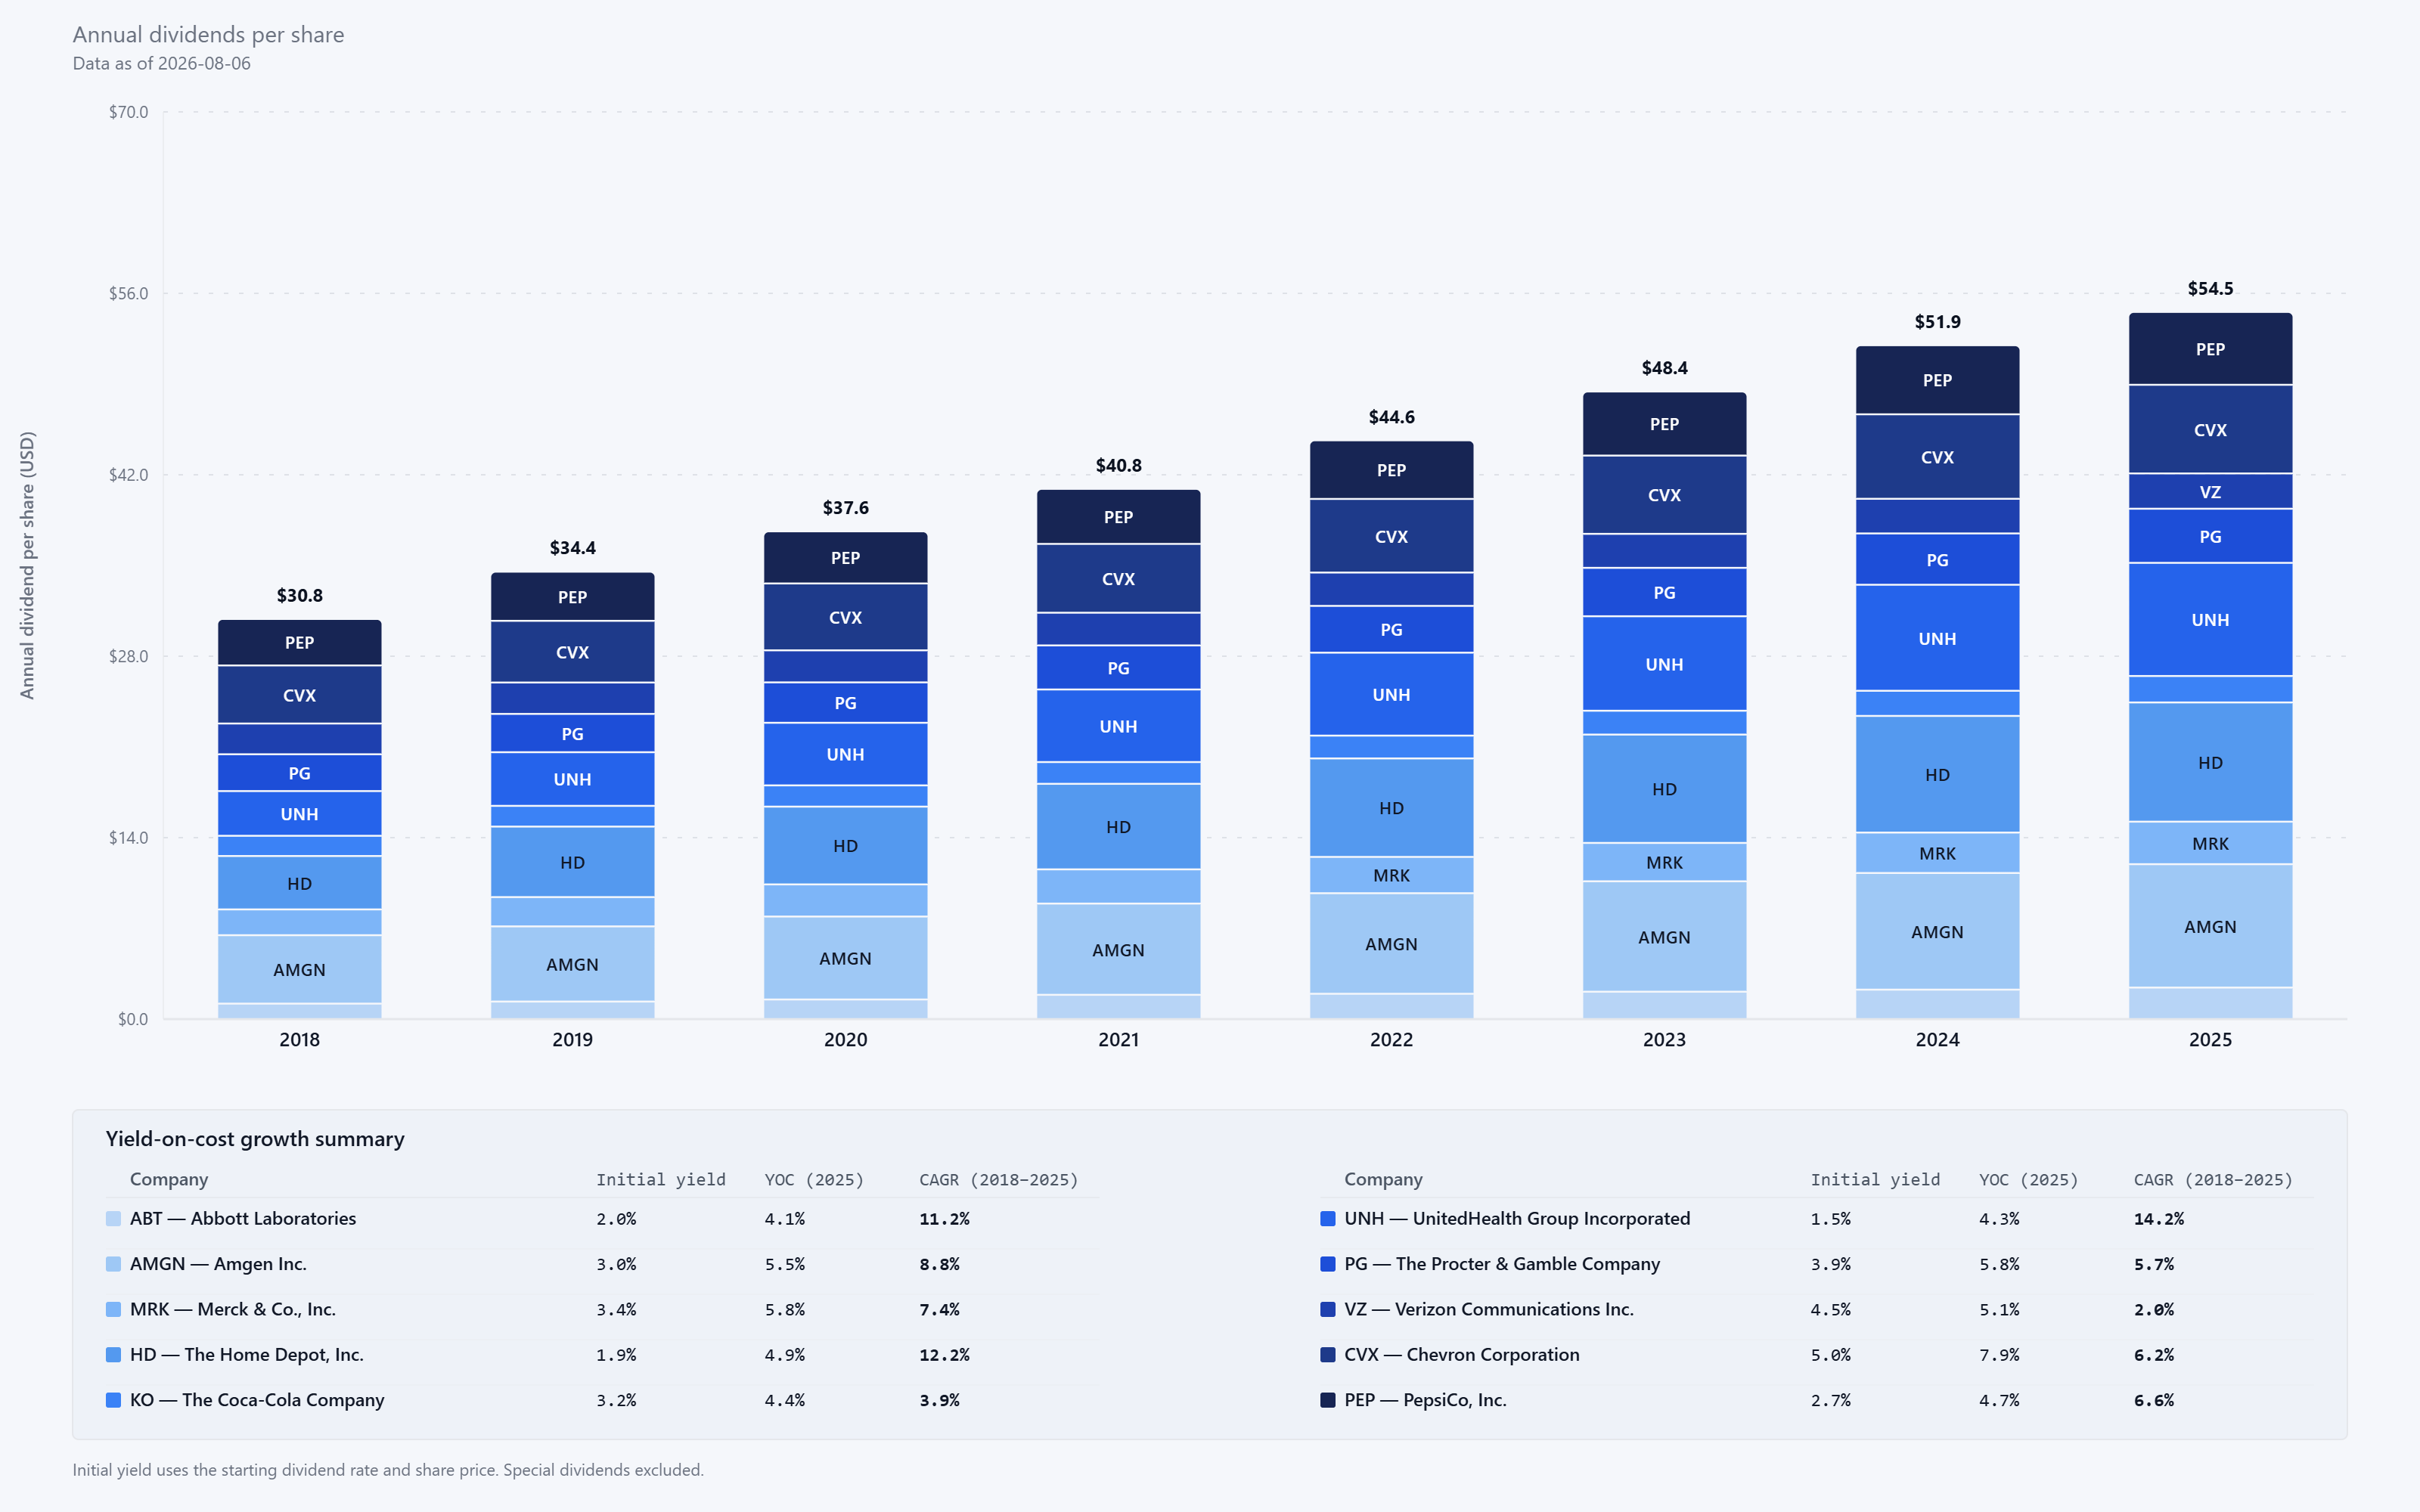
Each colored layer represents one of SCHD's ten largest holdings, while the total height of the stacked bars shows the combined annual dividends per share generated by the group.
Between 2018 and 2025, the combined annual dividends increased from just over $30 to more than $54 per share—an increase of approximately 77%. The portfolio achieved this growth without adding new companies, illustrating how existing holdings can steadily raise shareholder income over time.
Looking closer, not every company contributed equally.
UnitedHealth and Home Depot delivered some of the strongest dividend growth in the group, both producing annual dividend growth rates above twelve percent. Abbott Laboratories also achieved double-digit growth despite beginning with a relatively modest dividend yield.
By contrast, Verizon started with one of the highest dividend yields but experienced much slower dividend growth. That difference highlights an important trade-off many dividend investors face: choosing between higher income today or faster income growth over the long term.
The summary table beneath the chart reinforces this idea by comparing each company's starting dividend yield, estimated yield on cost by 2025, and dividend growth rate. Rather than predicting future returns, yield on cost helps visualize how years of consistent dividend increases can improve the income generated from an original investment.
Final Takeaway
Current dividend yield is only one part of the story.
For long-term dividend investors, consistent dividend growth can become an increasingly important driver of portfolio income. A diversified collection of businesses that regularly increase their payouts may ultimately produce stronger income growth than simply selecting the highest-yielding stocks available today.
If you enjoy exploring investing through data-driven visuals, explore more visual analyses and interactive tools at DividendXray.