How Much Capital for $1,000/Month? O vs KIM vs REG vs SPG
Introduction
How much capital do you need to generate $1,000 per month in dividend income after taxes? The answer depends on the stock, the yield, and how quickly the dividend grows.
In this breakdown, we compare Realty Income, Kimco Realty, Regency Centers, and Simon Property Group against the same after-tax income goal using the DividendXray income goal calculator. The objective is not simply to find the highest yield, but to illustrate how different combinations of starting yield and dividend growth affect the capital required to reach the same monthly income target.
Income Goal Comparison
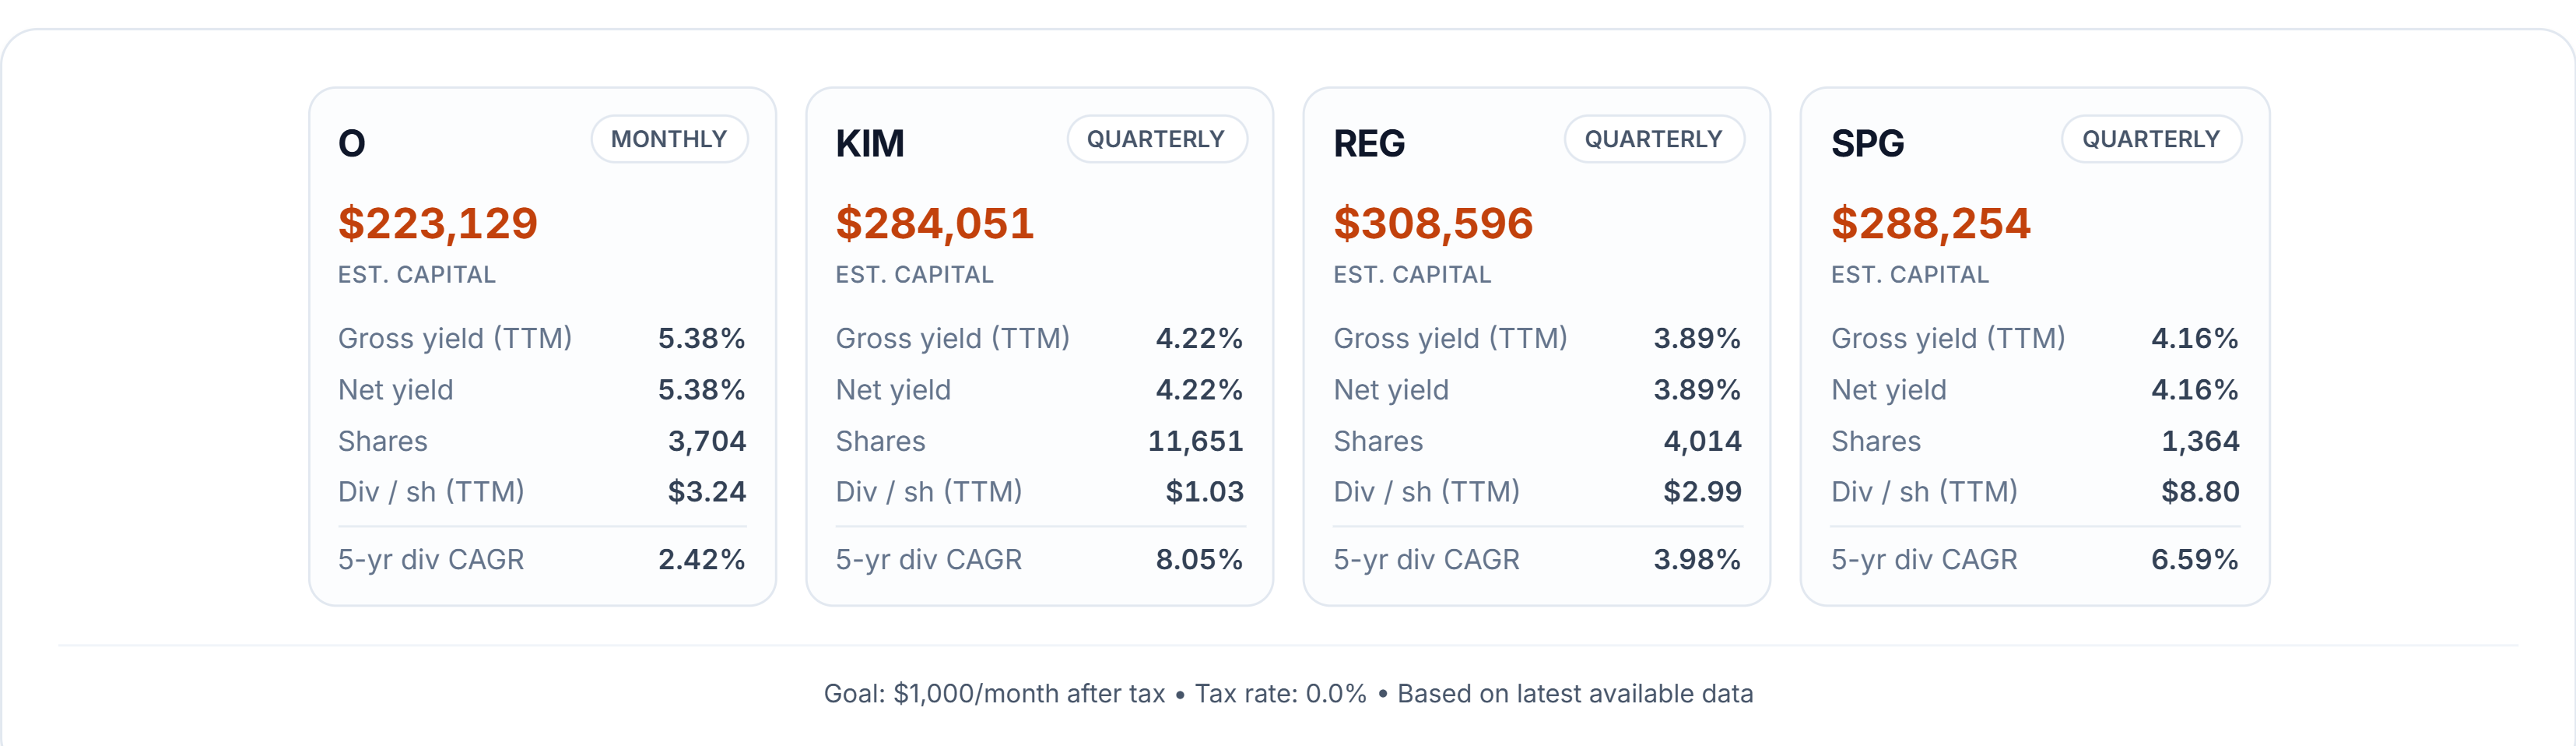
Here is a side-by-side comparison of how much capital each REIT would need to produce the same after-tax monthly income goal, based on current yield and tax assumptions.
For a $1,000/month after-tax target with a 0% tax assumption, Realty Income requires the least capital at roughly $223,000, supported by its yield near 5.4%. Regency Centers requires the most capital at about $309,000, reflecting its lower yield of approximately 3.9%.
The comparison cards highlight the tradeoff. Higher-yield names require less capital today, while lower-yield dividend growers may demand more upfront investment but can potentially narrow the gap over time. Kimco Realty and Simon Property Group sit between the two extremes, balancing current income with dividend growth.
Yield Catch-Up Timeline
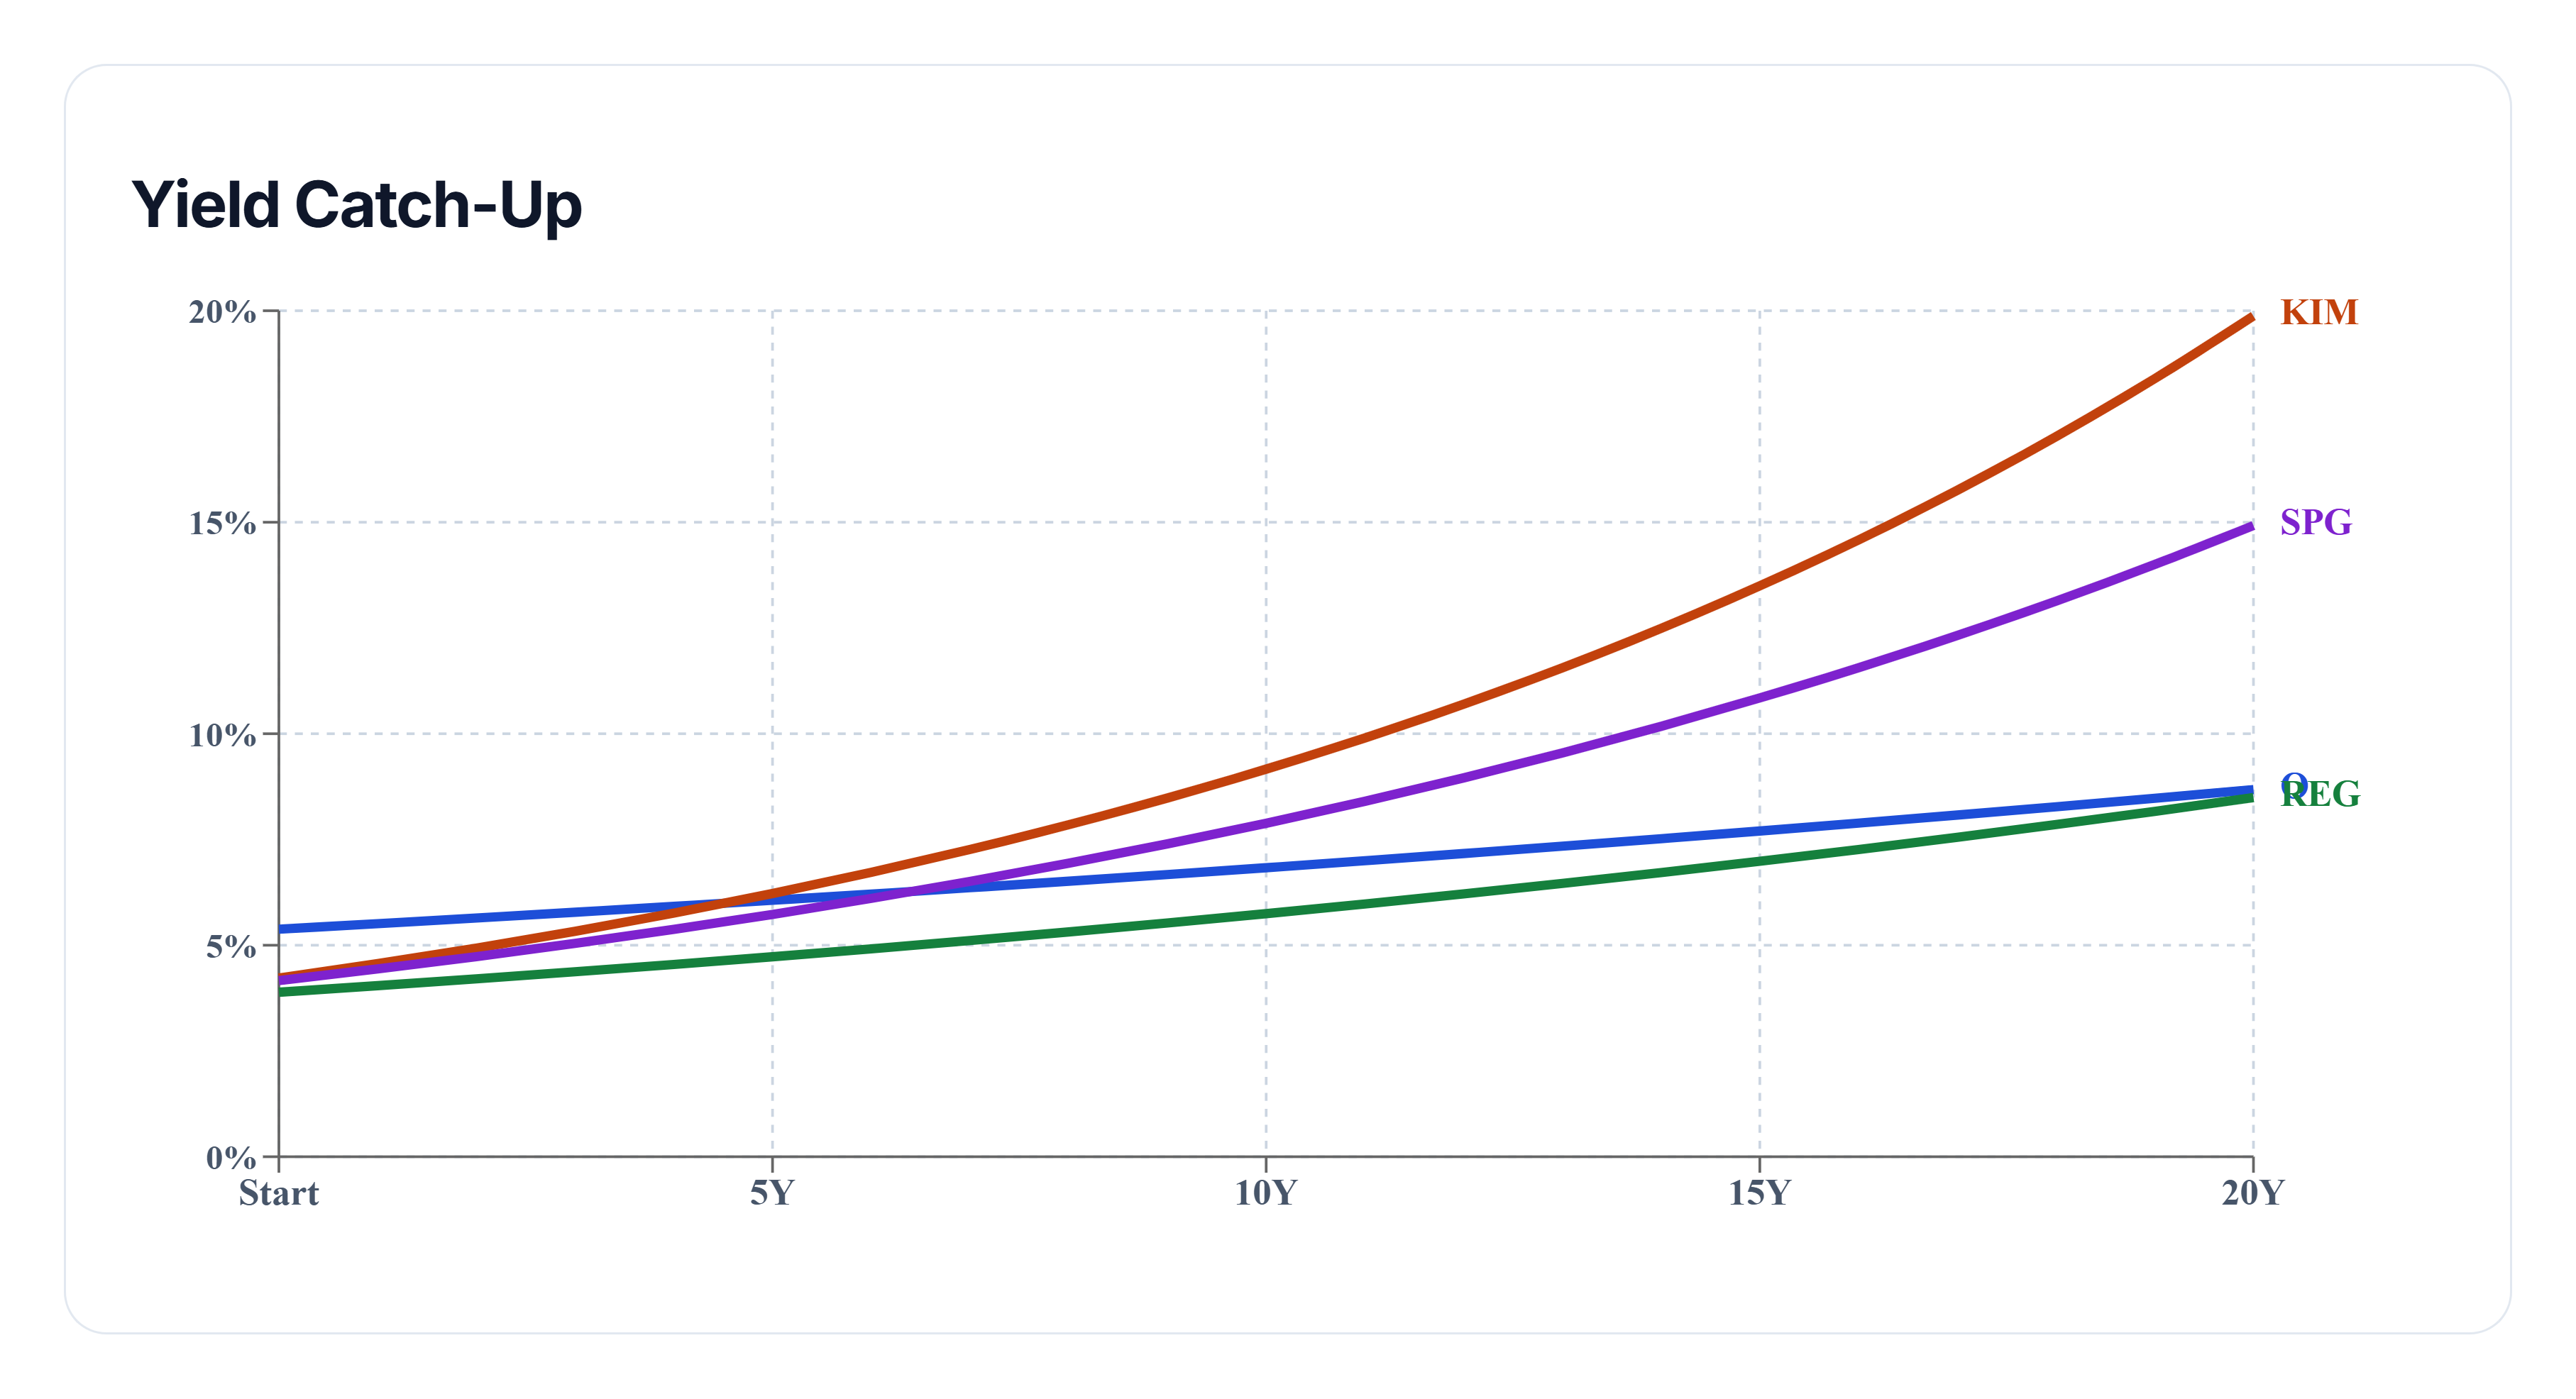
This chart shows how long it may take for a lower-yield dividend grower to match the income efficiency of a higher-yield alternative, measured by yield on cost.
Realty Income starts with the highest yield, while Kimco Realty delivers the strongest modeled dividend growth, averaging roughly 8.1% annually over the past five years. Regency Centers begins with a lower yield near 3.9%, making the climb more difficult.
Even after twenty years, REG still does not catch O in projected yield-on-cost. The timeline illustrates an important lesson: while dividend growth can narrow the gap, a meaningful yield advantage at the starting line can remain difficult to overcome.
Final Takeaway
There is no universal answer to the question of how much capital is needed for $1,000 per month. The best choice depends on whether you prioritize less capital today, higher starting income, or faster dividend growth over time.
Use the comparison cards to see which REIT reaches the income goal with the least upfront capital, and use the catch-up timeline to determine whether a lower yield is simply a temporary disadvantage or a long-term opportunity. Realty Income currently offers the highest starting income, while Kimco Realty demonstrates the strongest modeled dividend growth.