MPLX vs WMB vs EPD vs KMI — Midstream Dividend Battle

Portfolio Overview
In this DividendXray battle, we compare four major midstream and energy infrastructure holdings across dividend growth, yield-on-cost expansion, and total return performance over a five-year period.
- MPLX focuses on pipeline infrastructure and stable cash flow generation with a strong emphasis on income growth.
- WMB combines natural gas infrastructure exposure with long-term dividend expansion and price appreciation.
- EPD delivers broad energy transportation and storage exposure through one of the largest midstream networks in the sector.
- KMI prioritizes large-scale pipeline operations and consistent cash flow backed by North American energy demand.
Each holding approaches energy infrastructure investing differently, but all aim to generate durable cash flow and long-term shareholder income.
Category Winners
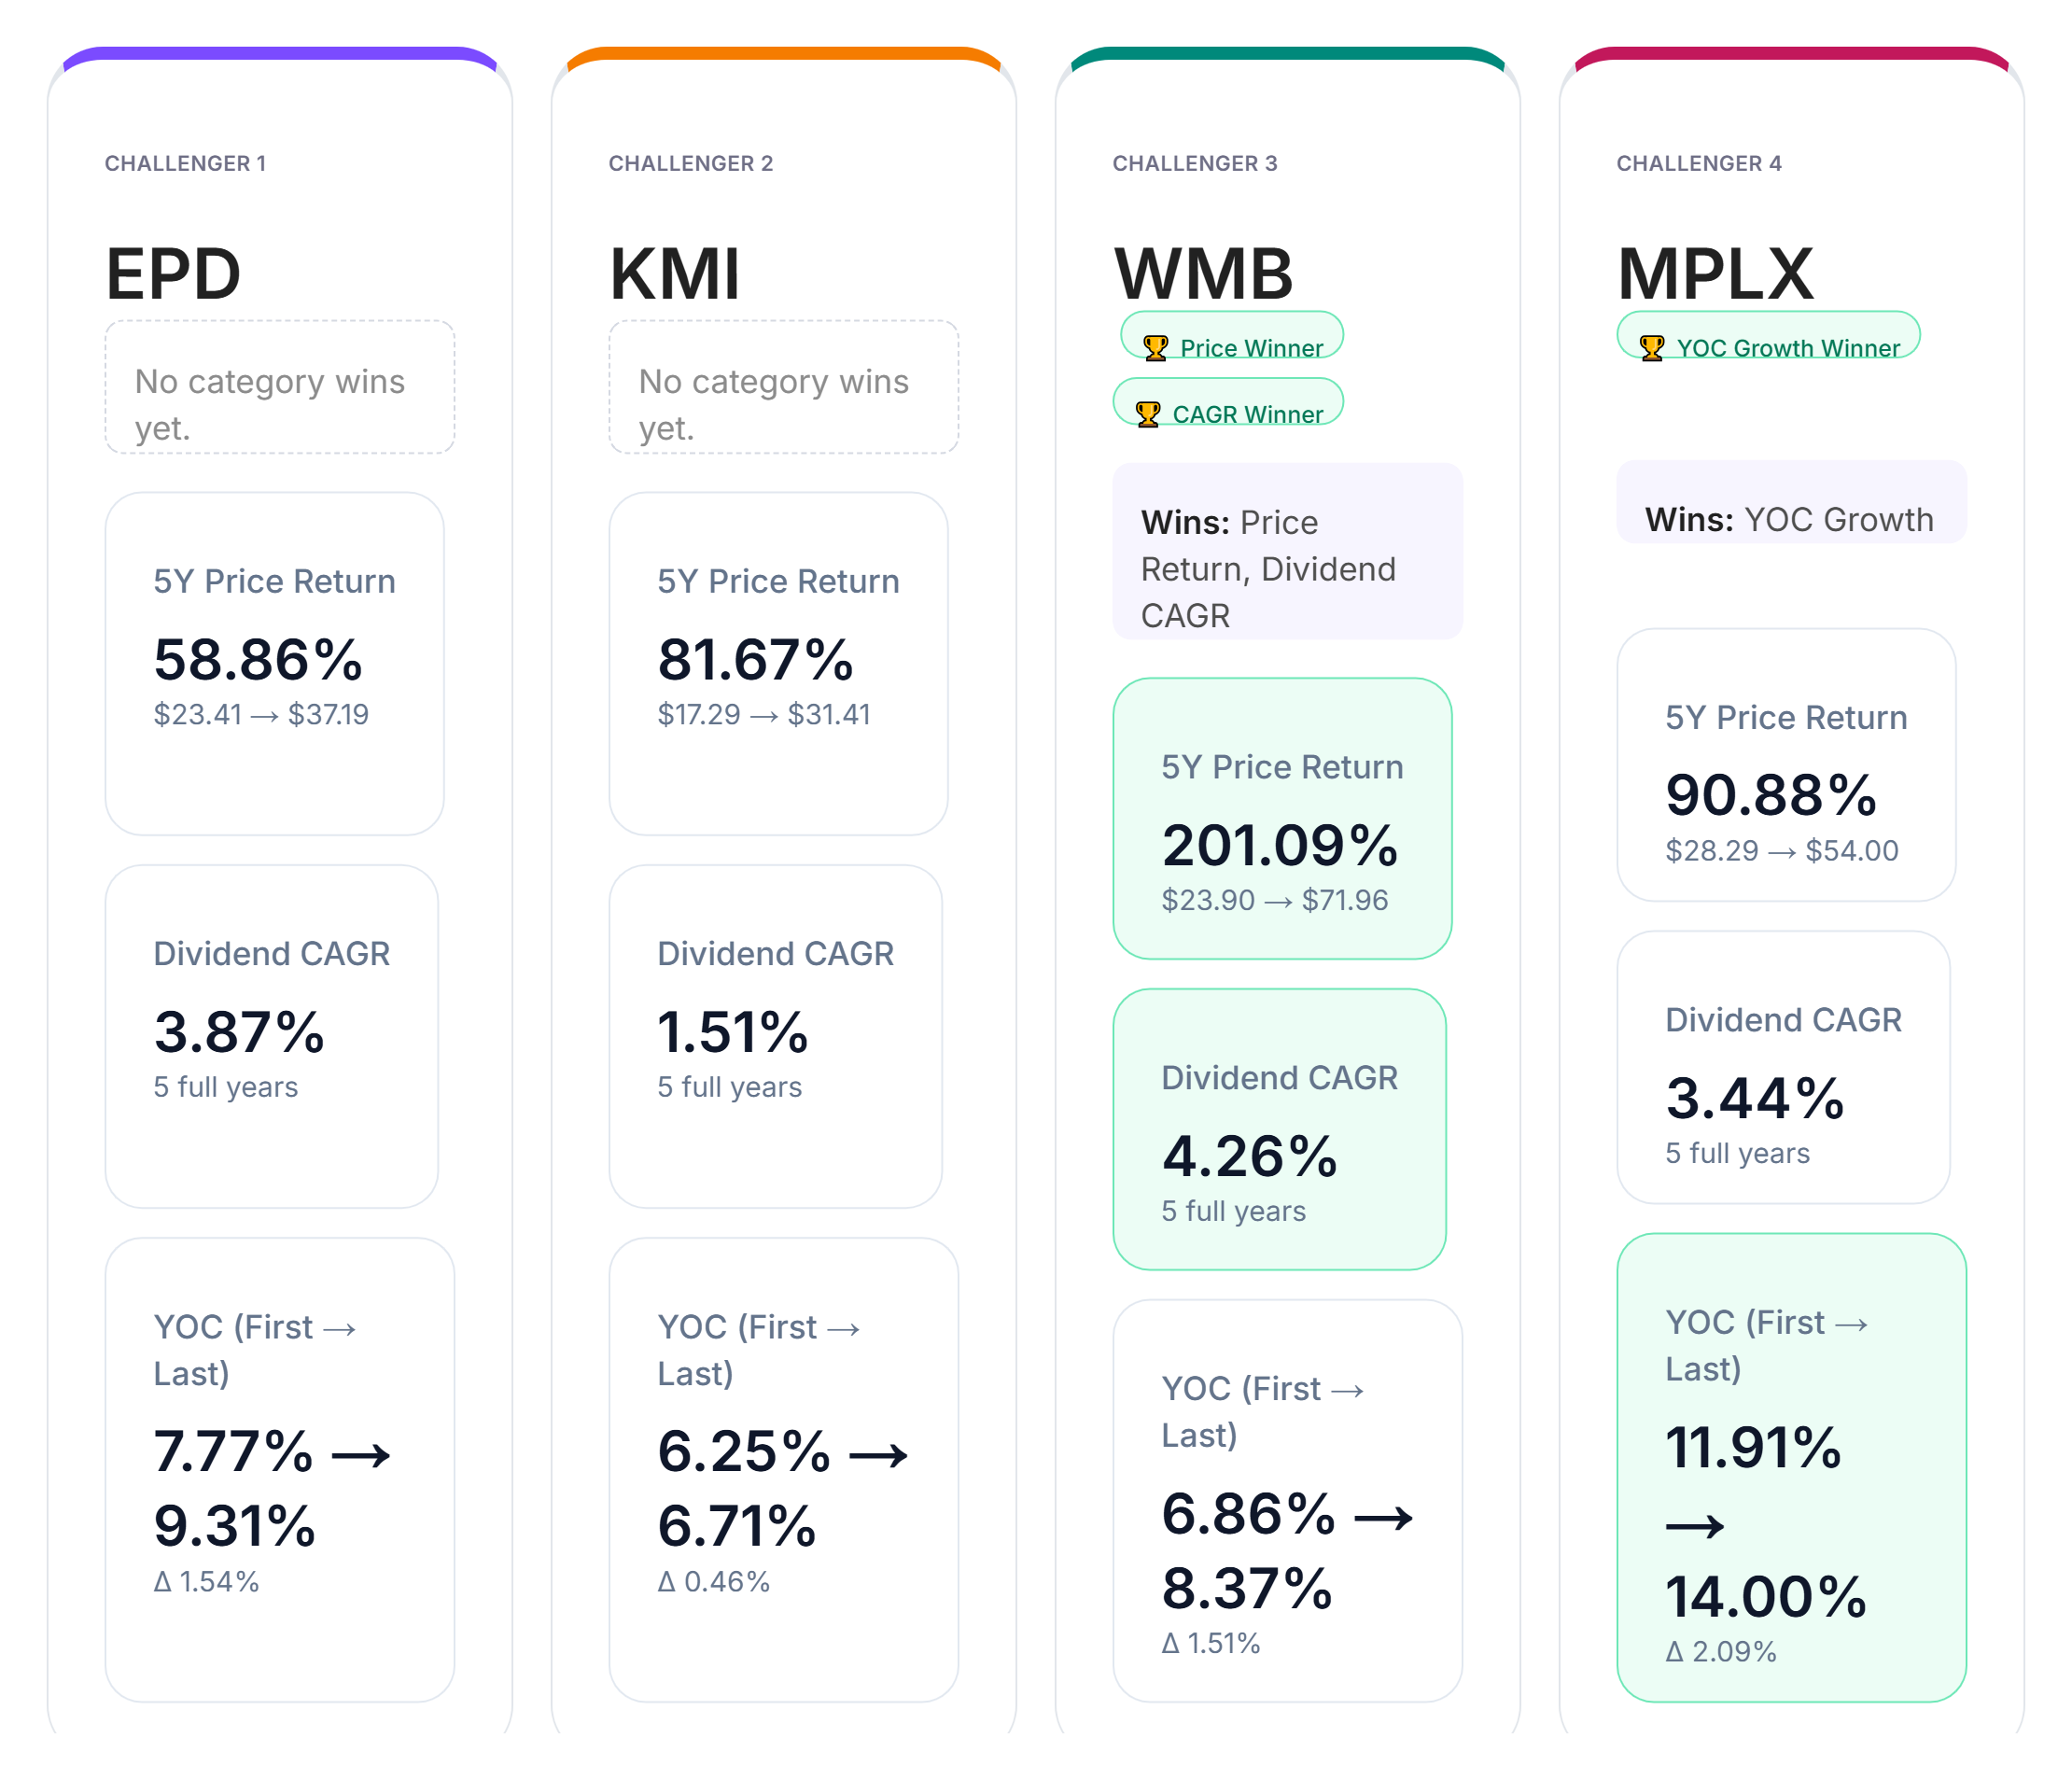
Looking at the data across dividend CAGR, yield-on-cost growth, and price return, clear category leaders emerge.
In dividend growth, WMB leads the group with a five-year dividend CAGR of 4.26%.
For yield-on-cost growth, MPLX shows the strongest improvement from first to last year, reflecting efficient long-term income expansion relative to the original investment.
In price return, WMB again takes the lead with a five-year return of 201.09%, significantly outperforming the other challengers in total appreciation.
EPD and KMI deliver solid performance across categories, but do not secure a category win in this comparison. The results highlight how different infrastructure strategies — pipeline scale, natural gas exposure, and cash flow allocation — shape long-term income and return outcomes.
Yield-on-Cost by Year
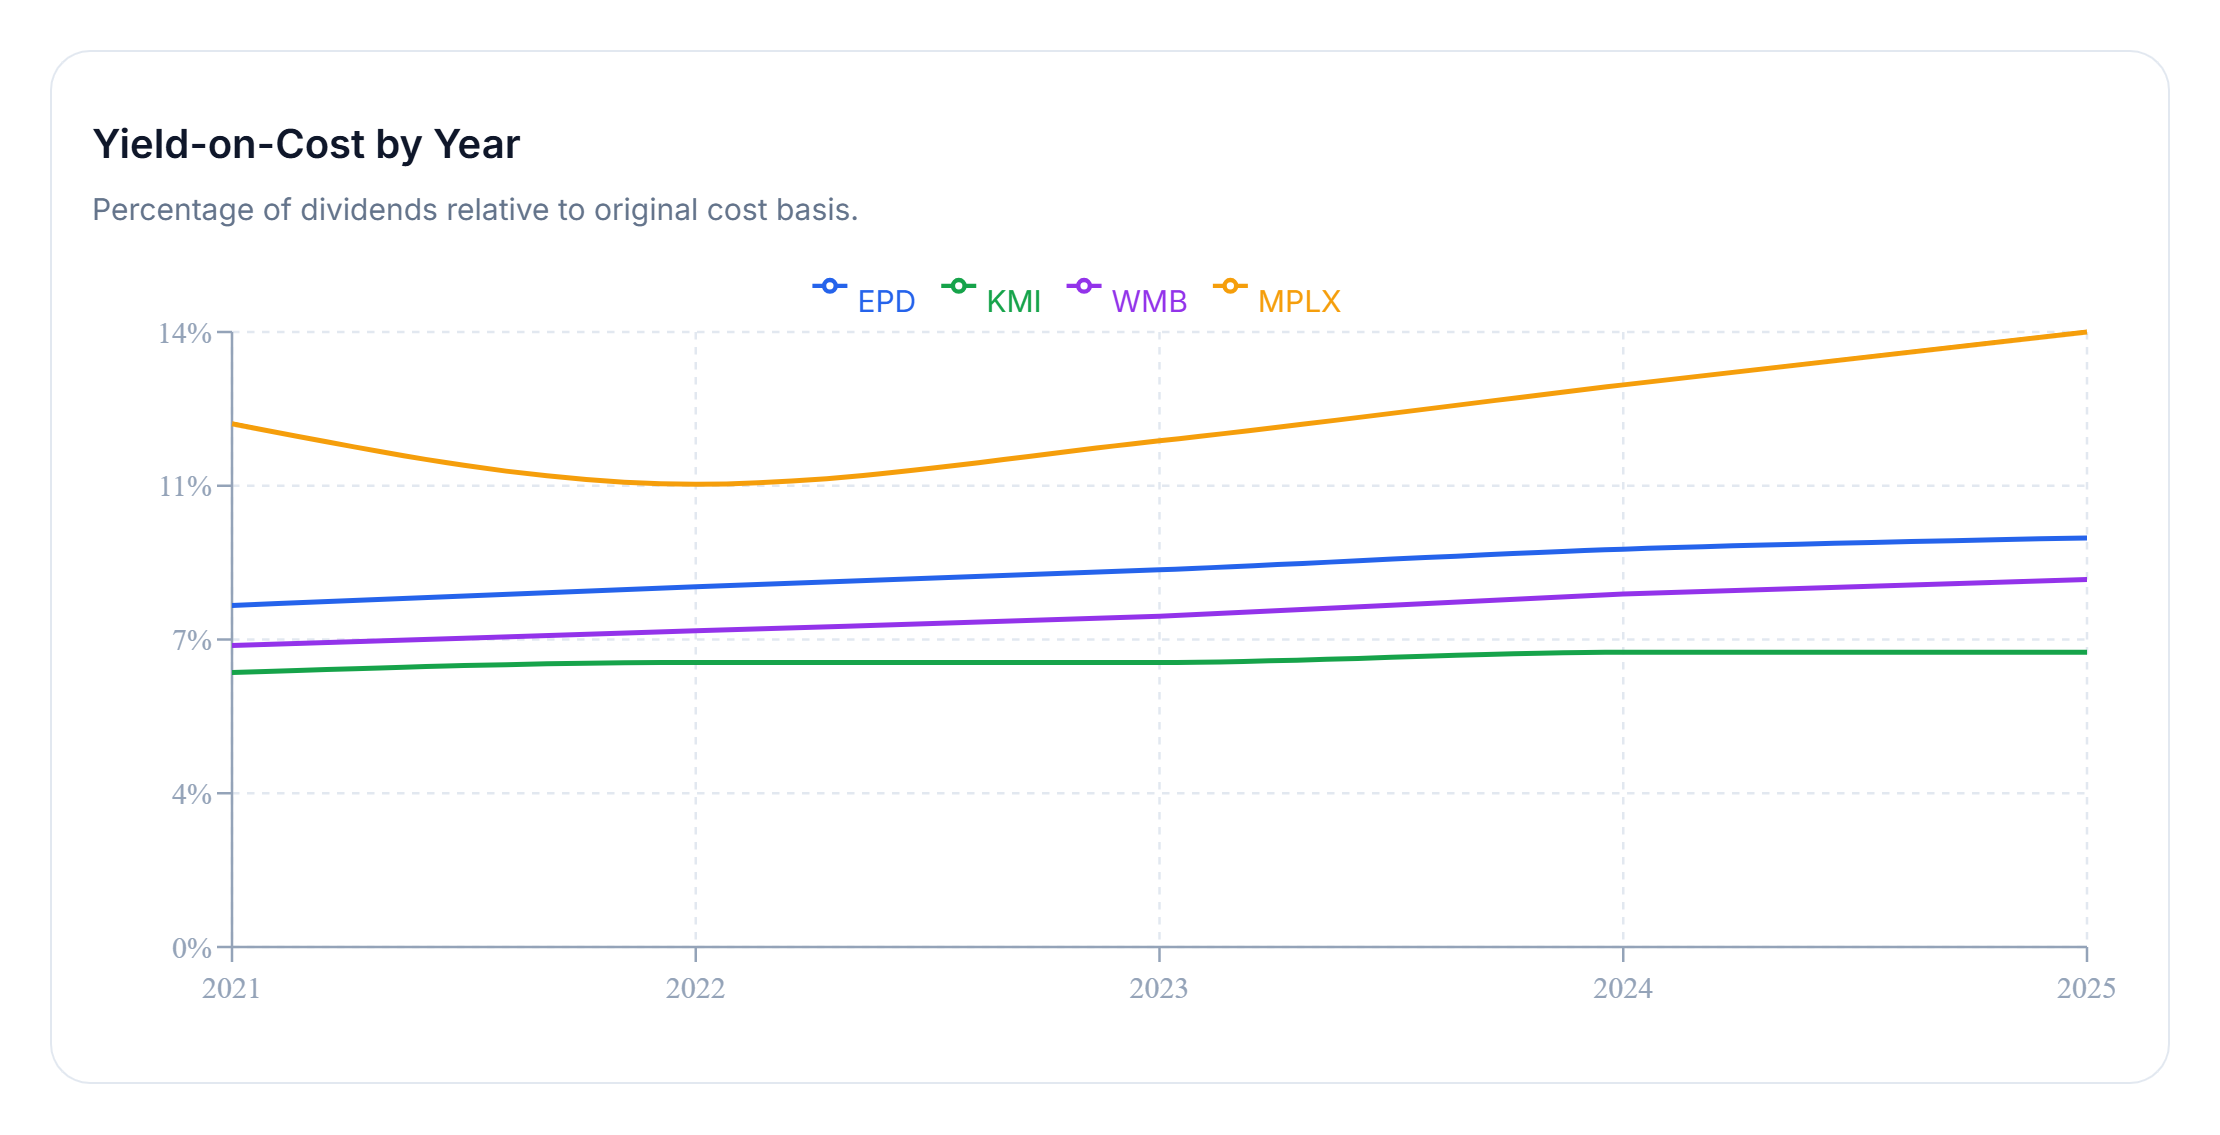
Yield-on-cost measures dividend income relative to the original capital invested. Unlike current yield, it shows how efficiently a holding grows income over time.
Over the five-year window, MPLX stands out with the strongest income efficiency, reaching approximately 14.00% yield on cost by the end of the period.
WMB, EPD, and KMI all demonstrate steady upward income trends as well, though their growth trajectories are more gradual over the same period. While annual differences may appear modest, compounding effects become increasingly visible over longer time horizons.
For long-term income investors, these distinctions matter. Strong cash flow generation combined with disciplined dividend growth can meaningfully increase portfolio income — even without adding new capital.
Final Takeaway
There is no single "perfect" midstream holding. Each company reflects a different balance between dividend growth, infrastructure stability, and total return potential.
This battle shows that WMB currently dominates in dividend growth and price appreciation, while MPLX stands out in long-term income efficiency through superior yield-on-cost expansion.
Ultimately, the best choice depends on whether an investor prioritizes maximizing present income, accelerating long-term dividend growth, or balancing both within a diversified energy infrastructure portfolio.