Materials Dividend Battle: Air Products vs Linde vs Ecolab vs Sherwin-Williams

Portfolio Overview
In this DividendXray battle, we compare four leading industrial dividend stocks across income growth, yield-on-cost expansion, and total return performance over a five-year period.
- APD is a global leader in industrial gases with a long history of dividend growth.
- LIN is the world's largest industrial gas company, recognized for its scale, profitability, and consistent dividend increases.
- ECL specializes in water, hygiene, and industrial solutions, serving customers around the world.
- SHW is a leading paint and coatings manufacturer with a strong track record of earnings and dividend growth.
Although all four companies operate in different parts of the industrial sector, each has built a reputation for rewarding shareholders through steadily growing dividends and durable businesses.
Category Winners
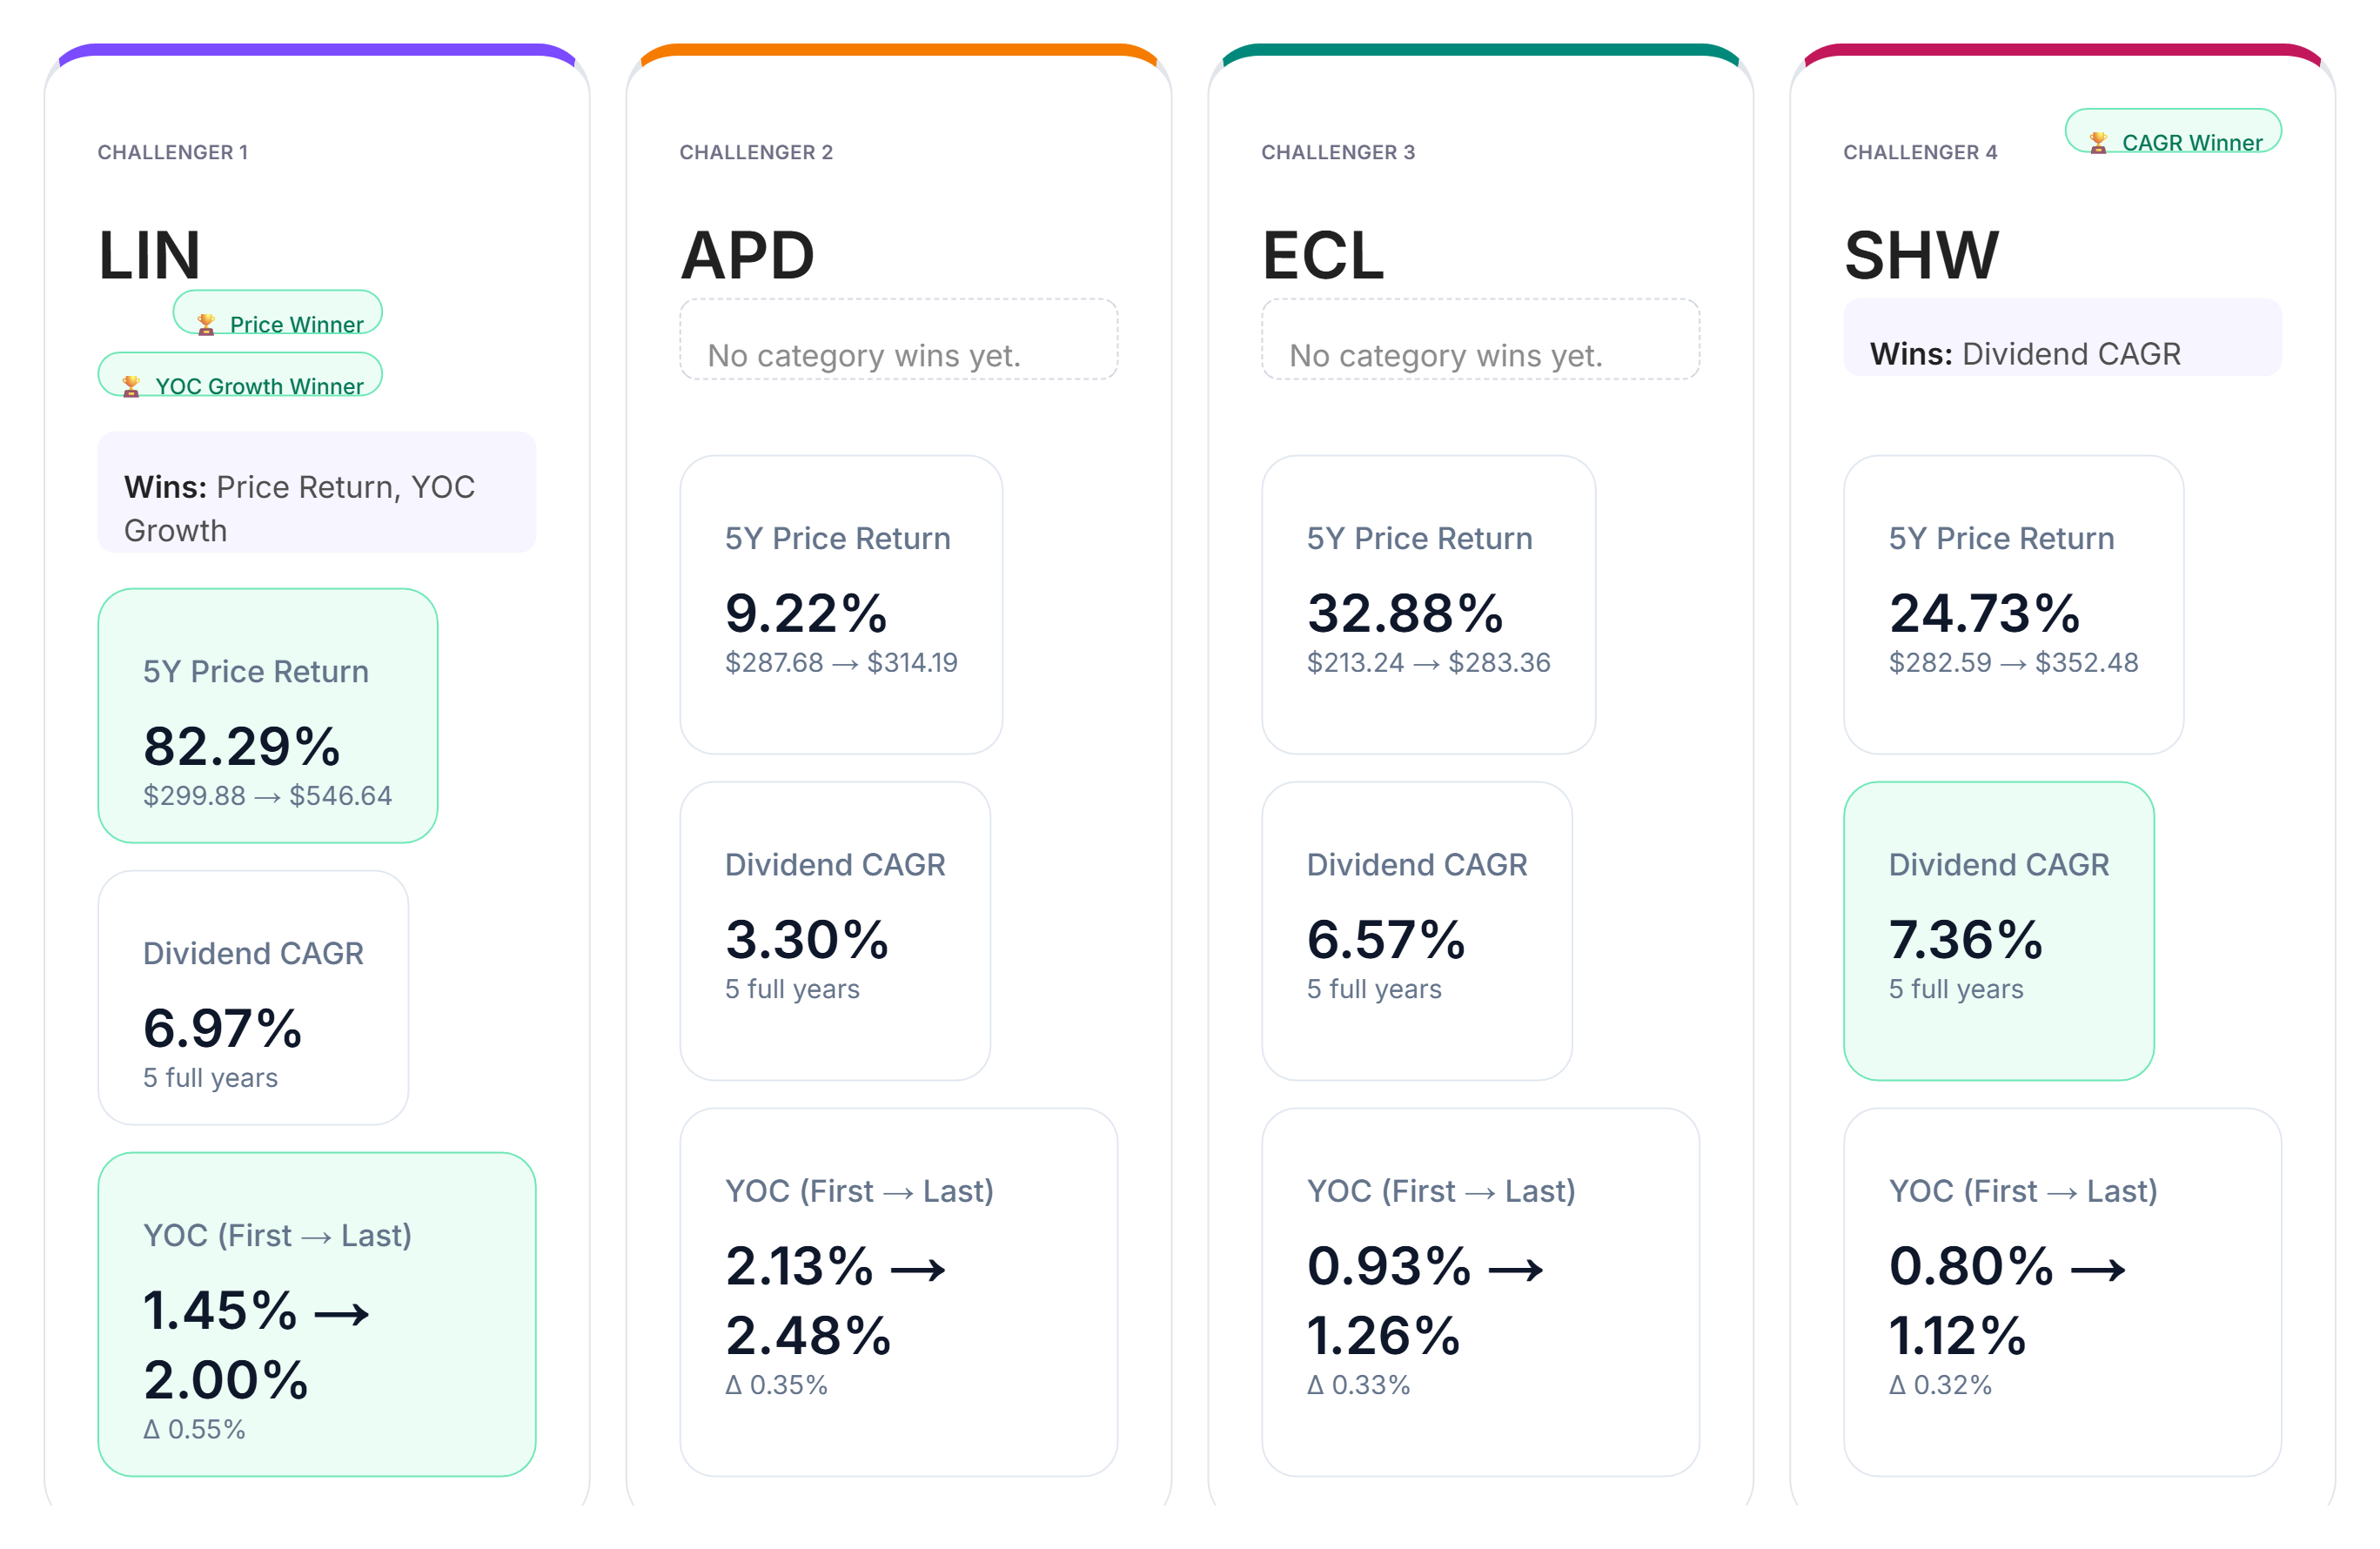
Looking across dividend CAGR, yield-on-cost growth, and total price return, several clear leaders emerge.
In dividend growth, SHW leads the group with a five-year dividend CAGR of 7.36%.
For yield-on-cost growth, LIN records the strongest improvement from the first year to the last, demonstrating excellent income compounding over time.
LIN also leads total price return, producing an impressive 82.29% gain over the five-year period.
APD and ECL remain strong long-term dividend businesses, but neither captures a category win in this comparison. Together, the results illustrate the balance between current income, dividend growth, and capital appreciation.
Yield-on-Cost by Year
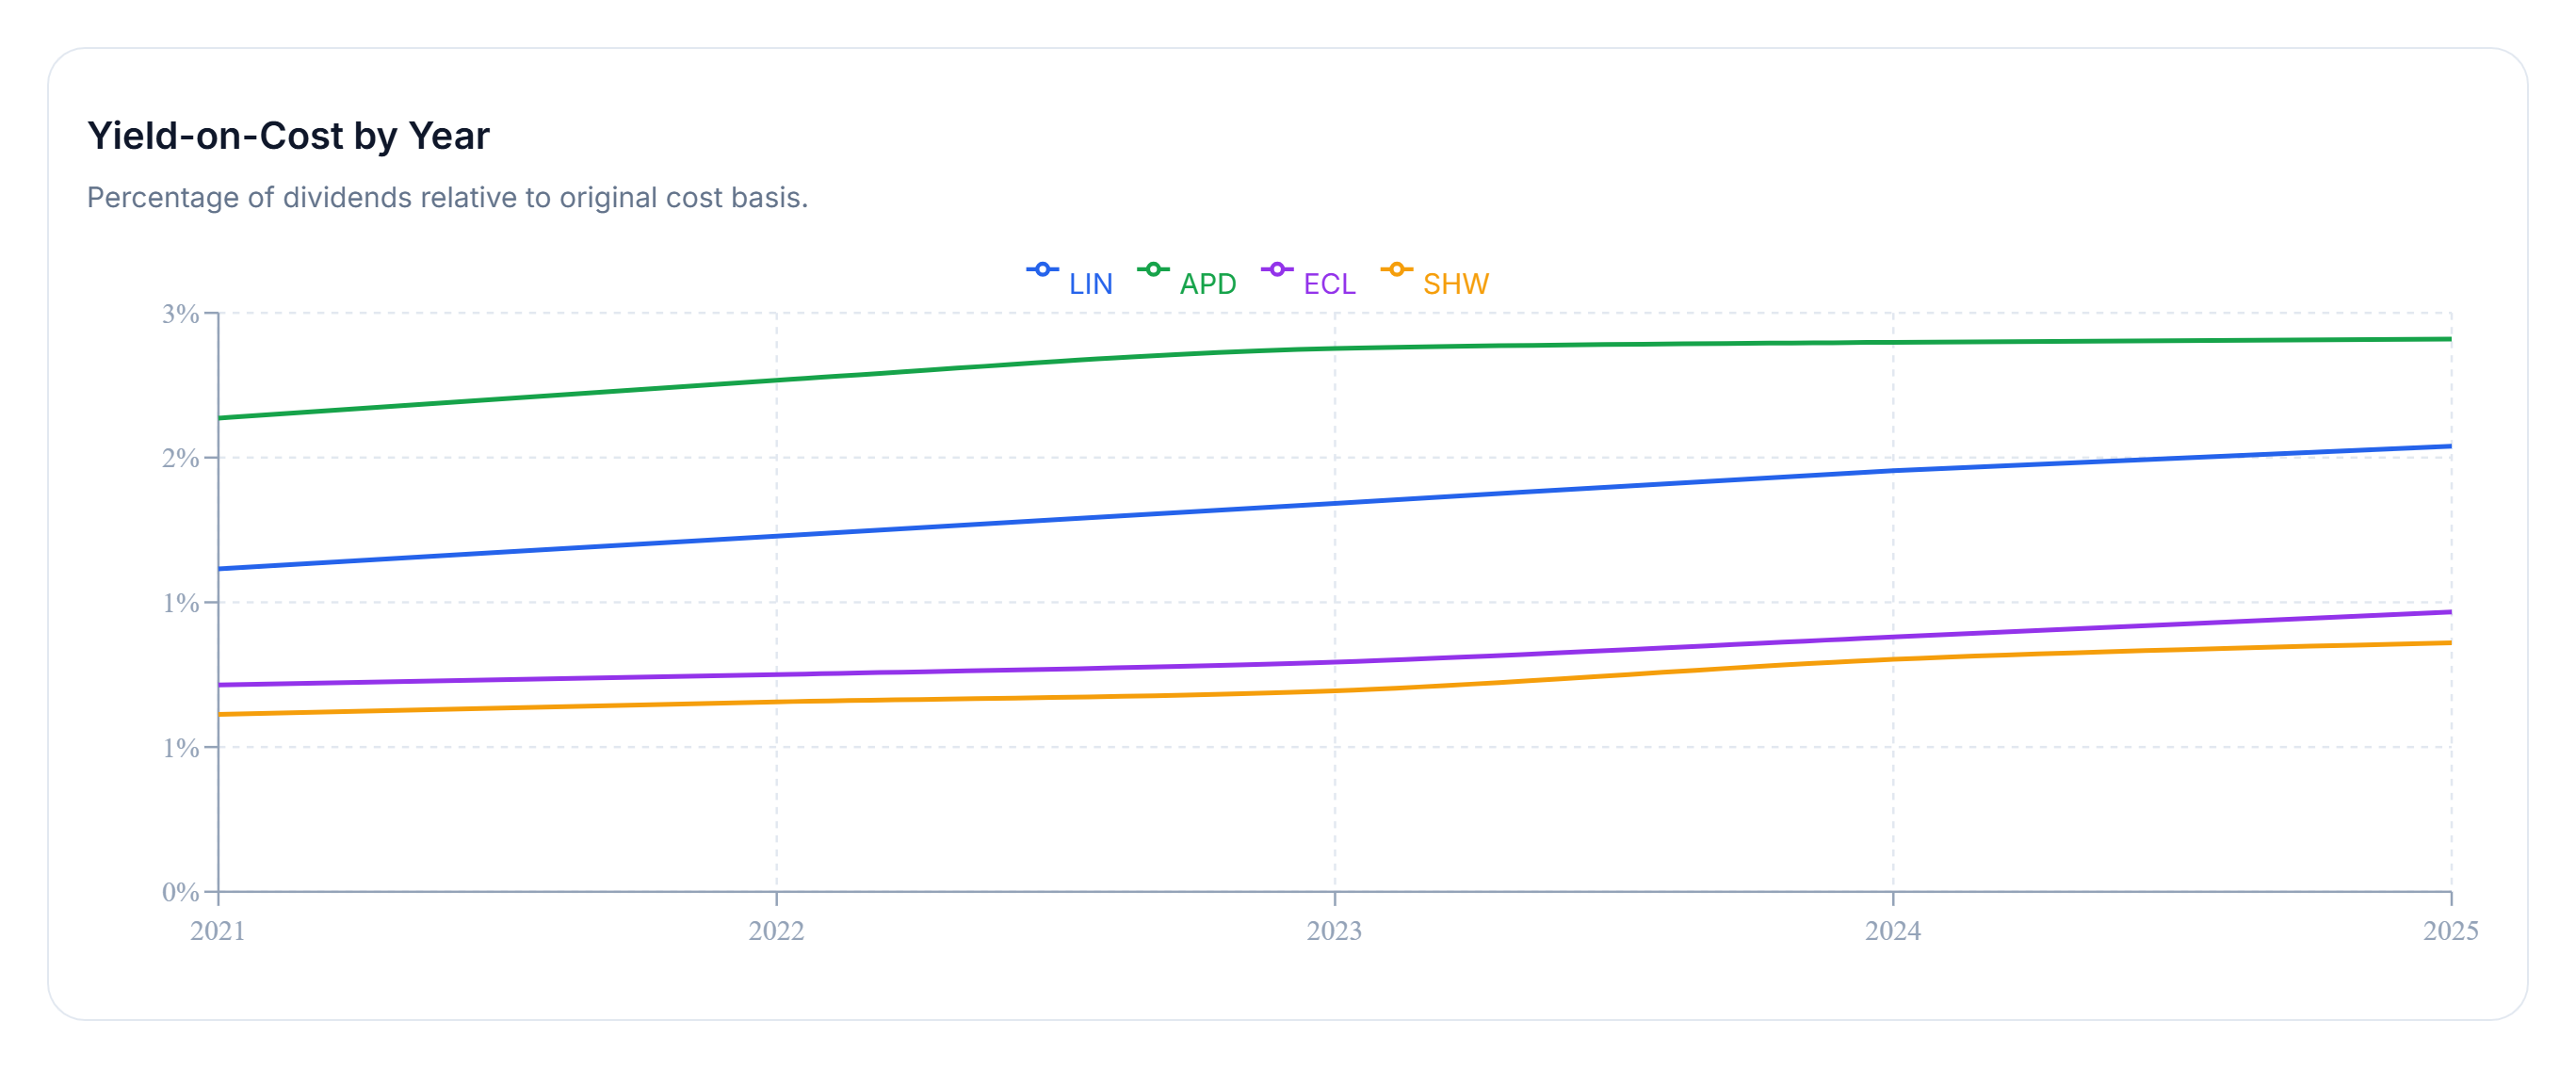
Yield-on-cost measures dividend income relative to the original investment rather than the current share price. It provides a useful perspective on how efficiently dividend income compounds over time.
Among these four companies, APD delivers the strongest income efficiency, reaching approximately 2.48% yield on cost by the end of the five-year period.
LIN, ECL, and SHW all exhibit healthy upward trends as well, although their income growth progresses more gradually throughout the same timeframe.
For dividend investors focused on growing passive income, even relatively small annual increases can compound into meaningful differences over many years.
Now let's shift from past performance to today's income picture.
Income Goal Comparison
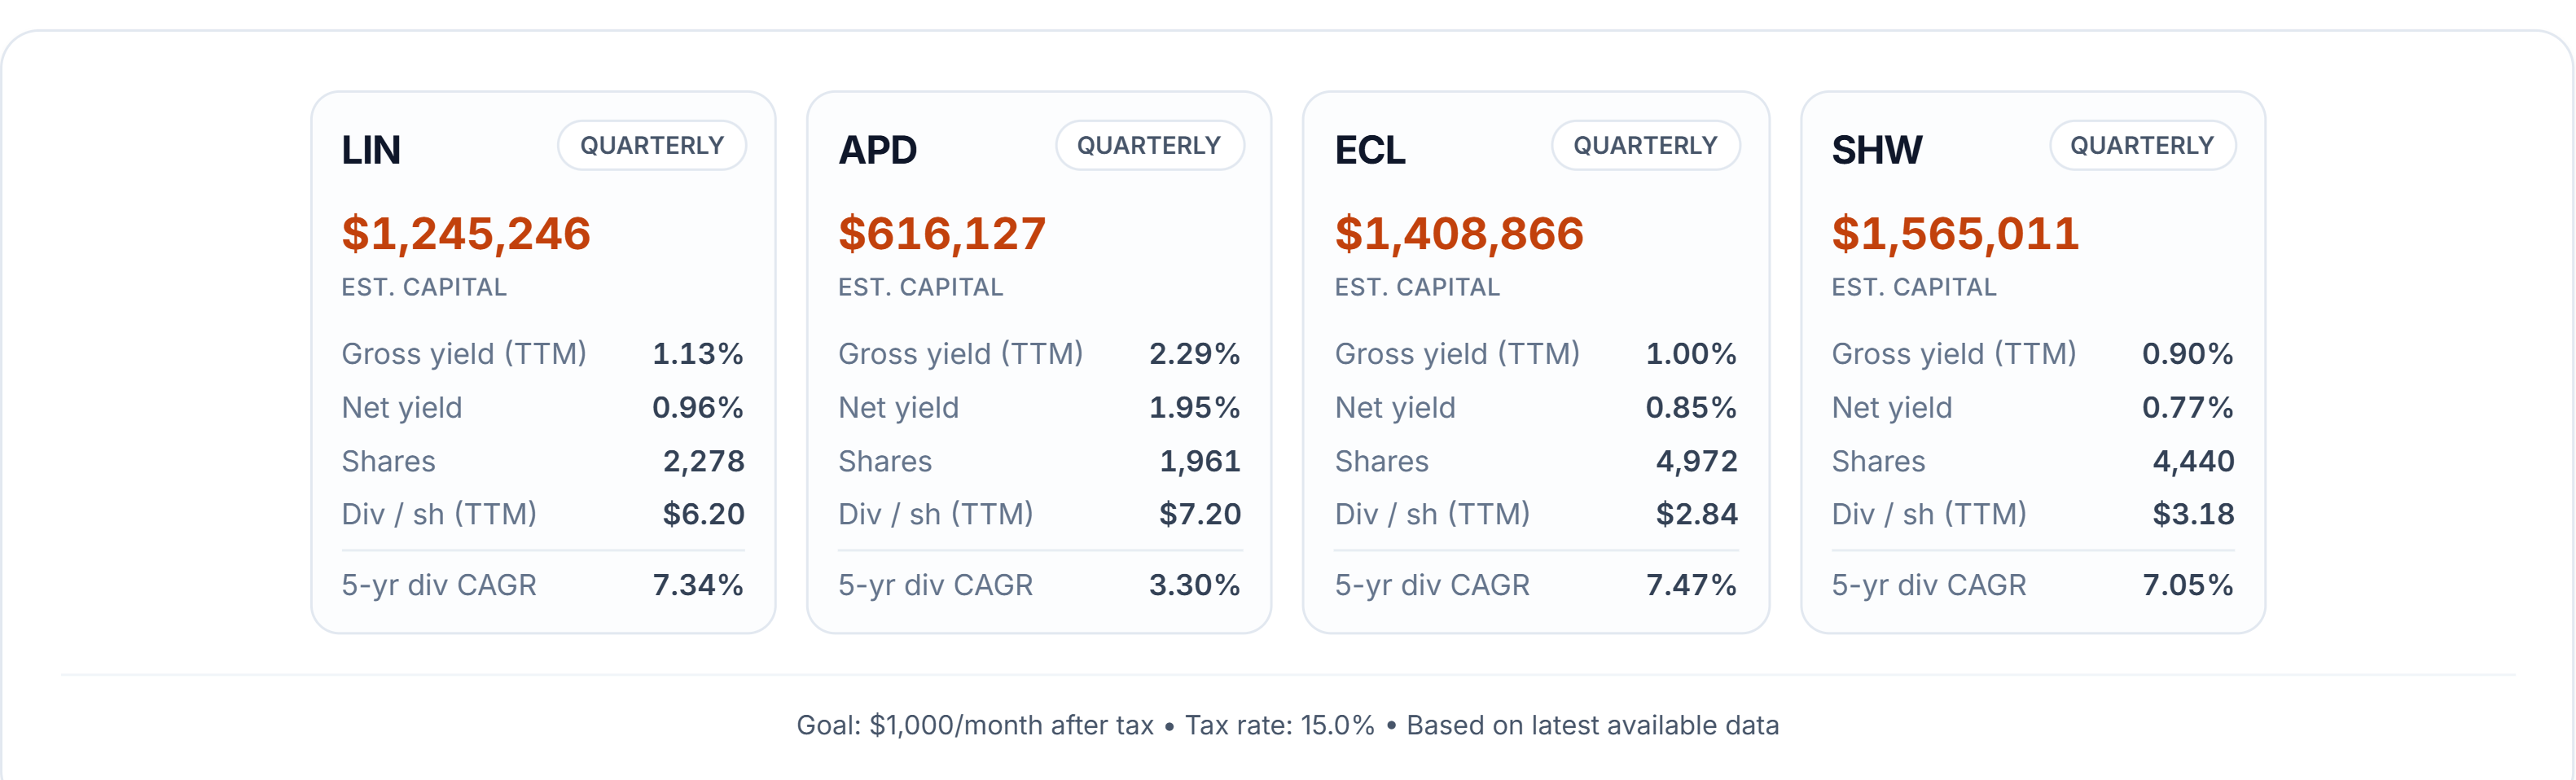
How much capital is required to generate $1,000 per month in after-tax dividend income? Current dividend yield plays a significant role in determining the answer.
Assuming a 15% dividend tax rate, APD requires the least capital at approximately $616,127, supported by its current yield of roughly 2.3%.
At the opposite end, SHW requires approximately $1.57 million because its current dividend yield sits just below 1%.
LIN and ECL fall between those two extremes, offering a more balanced mix of current income and long-term dividend growth potential.
The comparison illustrates one of the most common dividend investing tradeoffs: higher-yield companies can generate target income with less capital today, while lower-yield businesses often rely more heavily on future dividend growth.
Yield Catch-Up Timeline
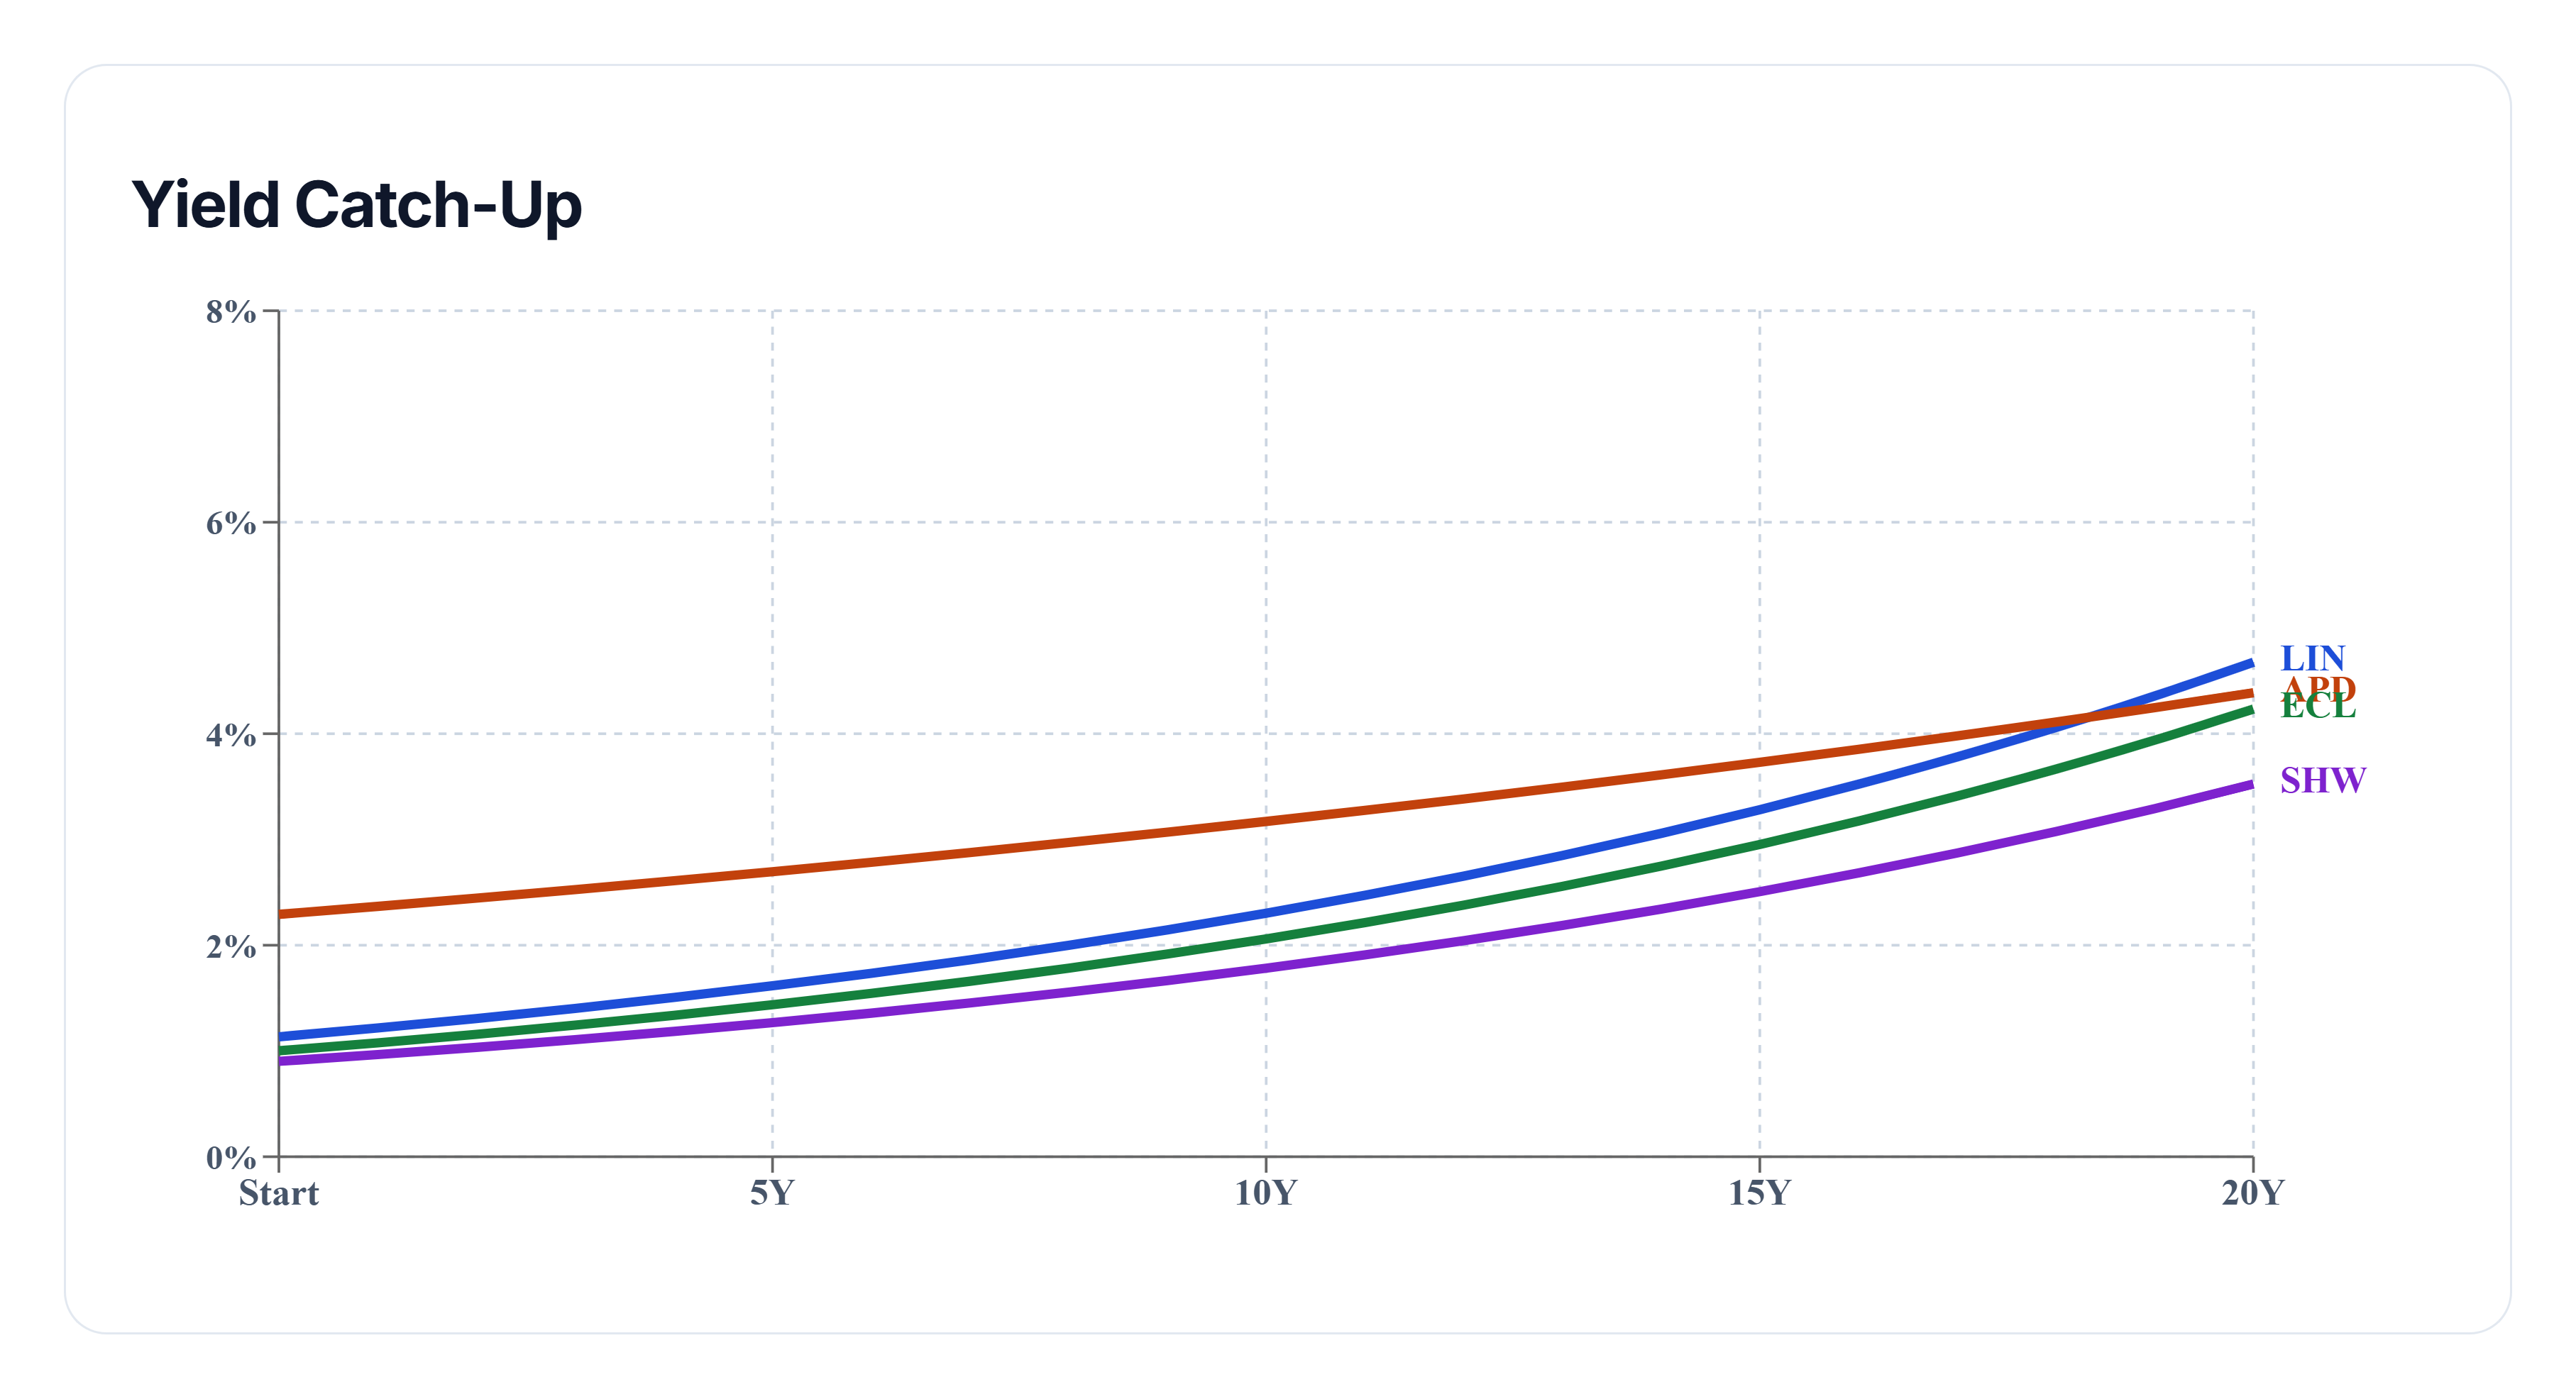
The catch-up projection estimates future yield-on-cost by assuming each company continues increasing dividends at a pace similar to its historical five-year average.
ECL produces the strongest projected dividend growth rate at approximately 7.5%, while APD begins with the highest current yield at roughly 2.3%.
SHW starts from a much lower yield of approximately 0.9%. Although its dividend growth remains strong, it still does not overtake APD's projected yield-on-cost even after twenty years.
The timeline demonstrates how an initially higher dividend yield can maintain a lasting advantage, even when lower-yield companies continue delivering impressive dividend growth.
Final Takeaway
Each of these industrial dividend stocks brings different strengths to a long-term income portfolio.
LIN stands out with exceptional price appreciation and yield-on-cost growth, while SHW delivers the fastest historical dividend growth. APD offers the strongest current income profile by requiring the least capital to achieve the target monthly dividend income, and ECL projects the fastest future dividend growth in the long-term model.
Ultimately, the best choice depends on your objective. Investors seeking higher income today may prefer APD, while those prioritizing dividend growth or long-term total return may find LIN, ECL, or SHW better aligned with their investment strategy.