KO vs PEP vs PG vs MDLZ Dividend Battle: Consumer Staples Income Comparison

Portfolio Overview
In this DividendXray battle, we compare four classic consumer-staples dividend payers across income growth, yield-on-cost expansion, and total return performance over a five-year period.
- Coca-Cola (KO) delivers dependable global beverage income backed by decades of dividend increases.
- PepsiCo (PEP) combines powerful snack and beverage brands with steady dividend growth and strong income efficiency.
- Procter & Gamble (PG) provides stable household-products cash flow supported by a long history of dividend reliability.
- Mondelez (MDLZ) focuses on global snack brands and contributes faster dividend growth within the group.
Each company represents a different balance of brand strength, dividend consistency, and long-term income potential.
Category Winners
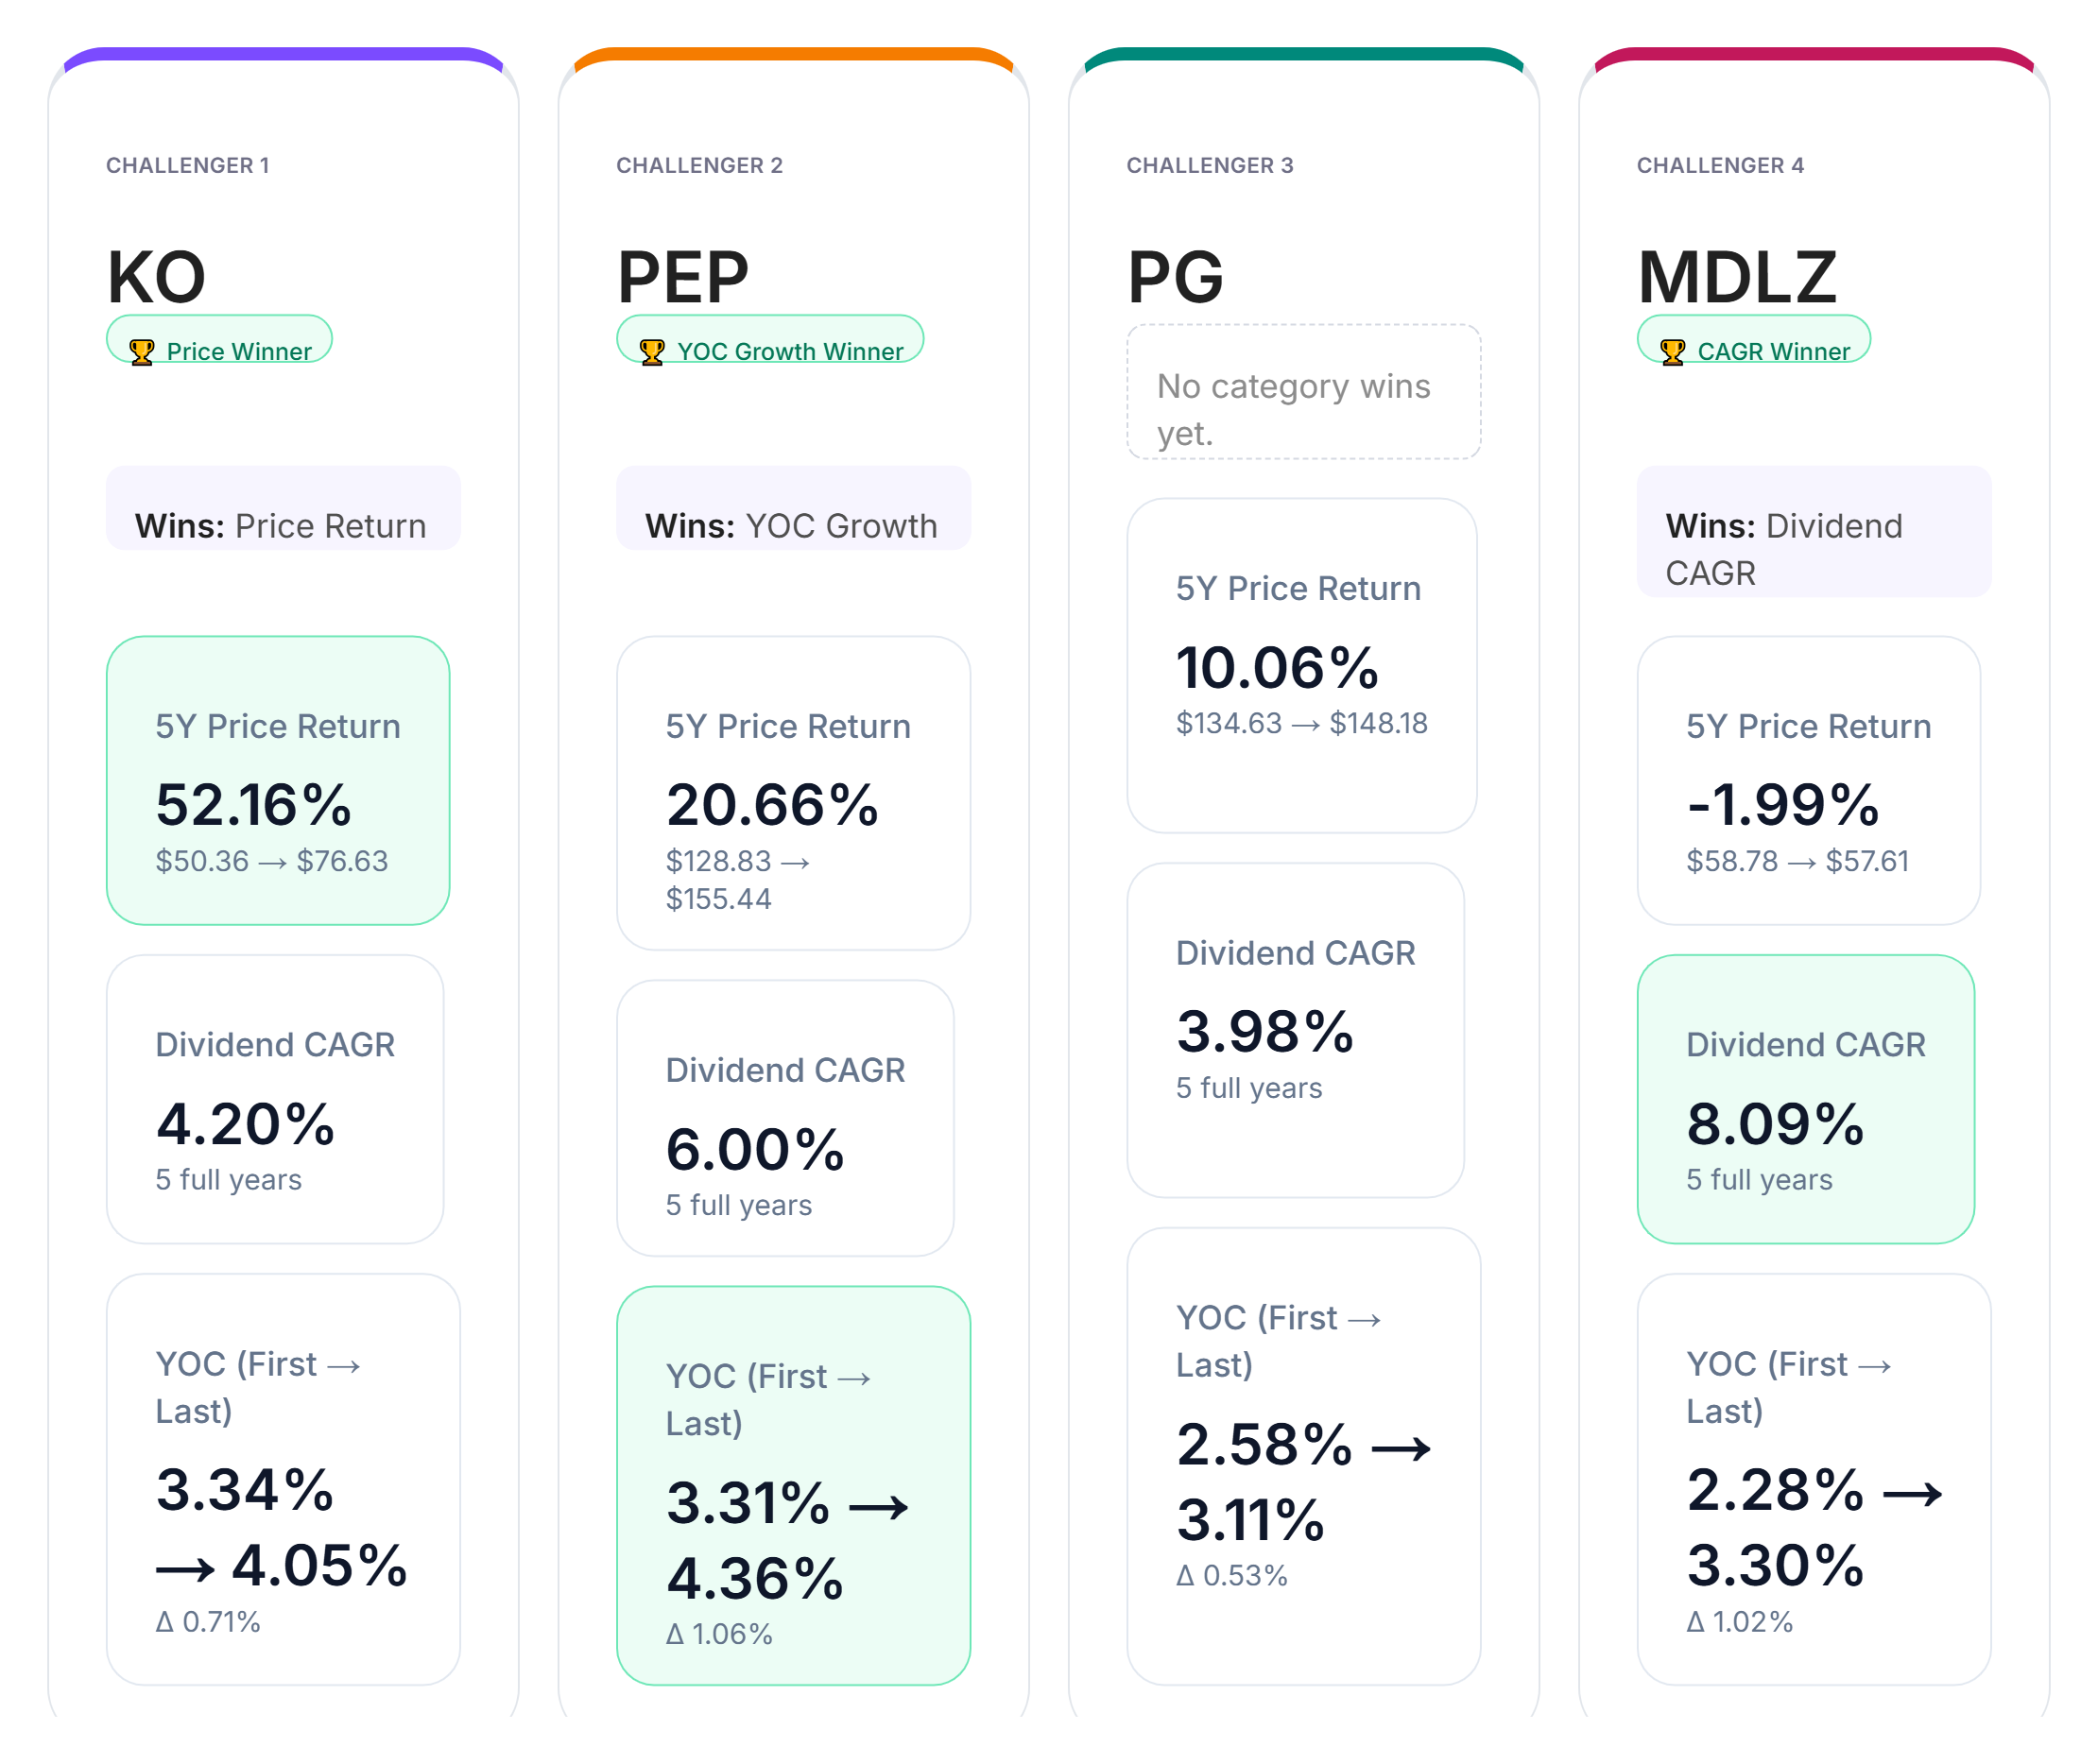
Looking at the data across dividend CAGR, yield-on-cost growth, and price return, clear category leaders emerge.
In dividend growth, MDLZ leads the group with a five-year dividend CAGR of 8.09%, reflecting the company's faster dividend expansion relative to its peers.
For yield-on-cost growth, PEP shows the strongest improvement from the first year to the last year, demonstrating efficient income compounding over time.
In price return, KO comes out ahead with a five-year return of 52.16%, delivering the strongest capital appreciation in this comparison.
PG delivers solid and consistent results across all categories, but does not secure a category win in this battle.
Yield-on-Cost by Year
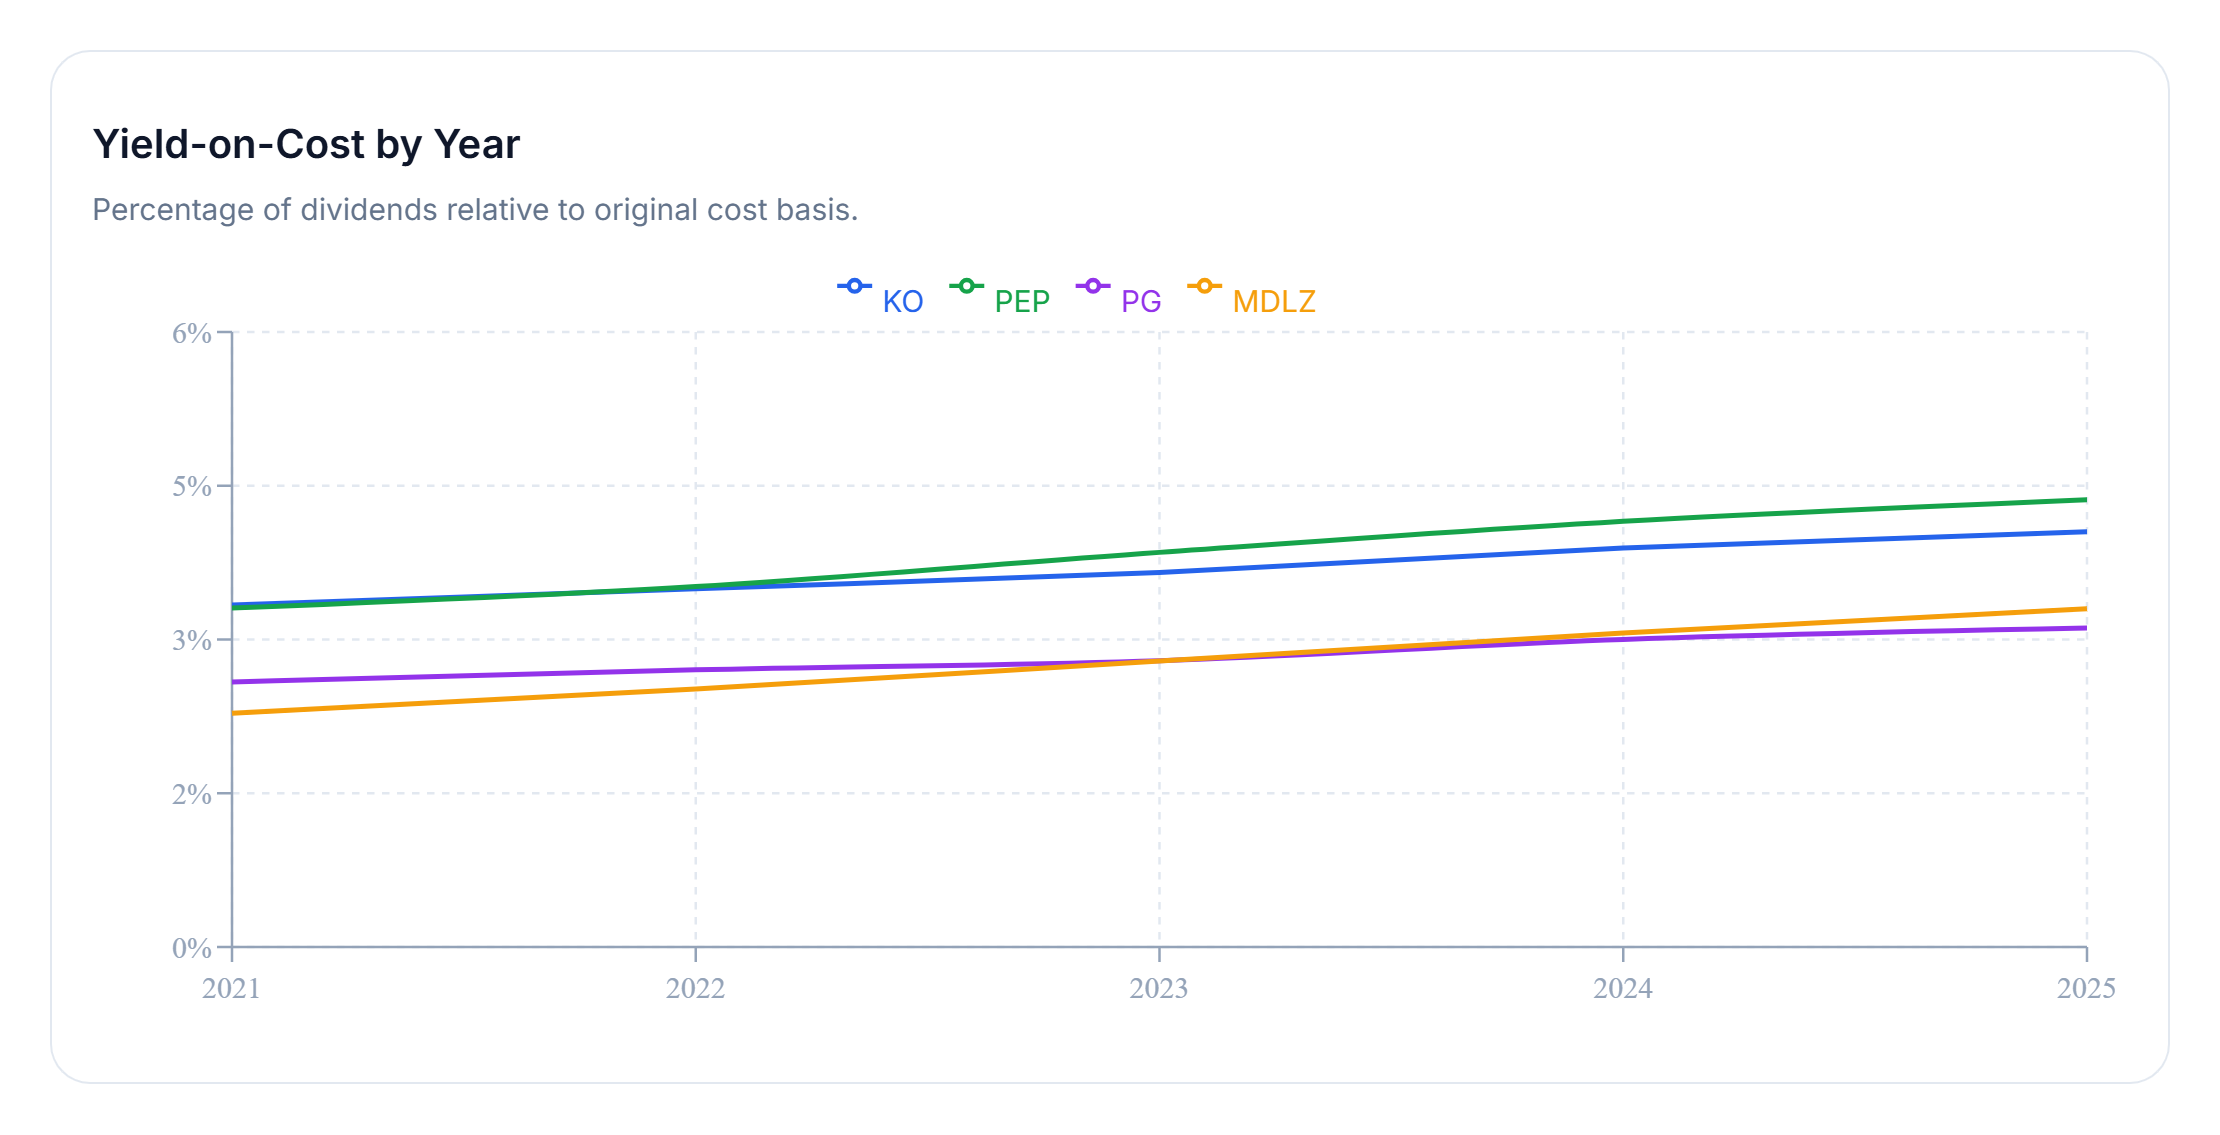
Yield-on-cost measures dividend income relative to the original capital invested. Unlike current yield, it shows how efficiently a holding grows income over time.
Over the five-year window, PEP stands out with the strongest income efficiency, reaching approximately 4.36% yield on cost by the end of the period.
KO, PG, and MDLZ also demonstrate steady upward income trends, but their yield-on-cost growth trajectories are more gradual across the same five-year window.
While the differences may appear modest year to year, the compounding impact becomes increasingly meaningful for long-term dividend investors.
Final Takeaway
Consumer-staples companies have long been favorites for dividend investors because of their resilient business models and dependable cash flow.
This comparison shows how different strengths emerge within the same defensive sector. MDLZ leads in dividend growth, PEP demonstrates the strongest income efficiency, and KO delivers the best price appreciation over the five-year period.
PG remains a cornerstone dividend stock known for stability and reliability, even though it does not take a category win in this particular comparison.
For long-term income investors, combining dependable dividend payers with varying growth profiles can help build a balanced portfolio capable of generating steadily rising income over time.