JEPI vs DIVO vs QYLD vs XYLD: Income ETF Battle
Portfolio Overview
In this DividendXray battle, we compare four income-focused ETFs across dividend growth, yield-on-cost changes, and price performance over a five-year period before shifting to today's income picture and a long-term yield-on-cost projection.
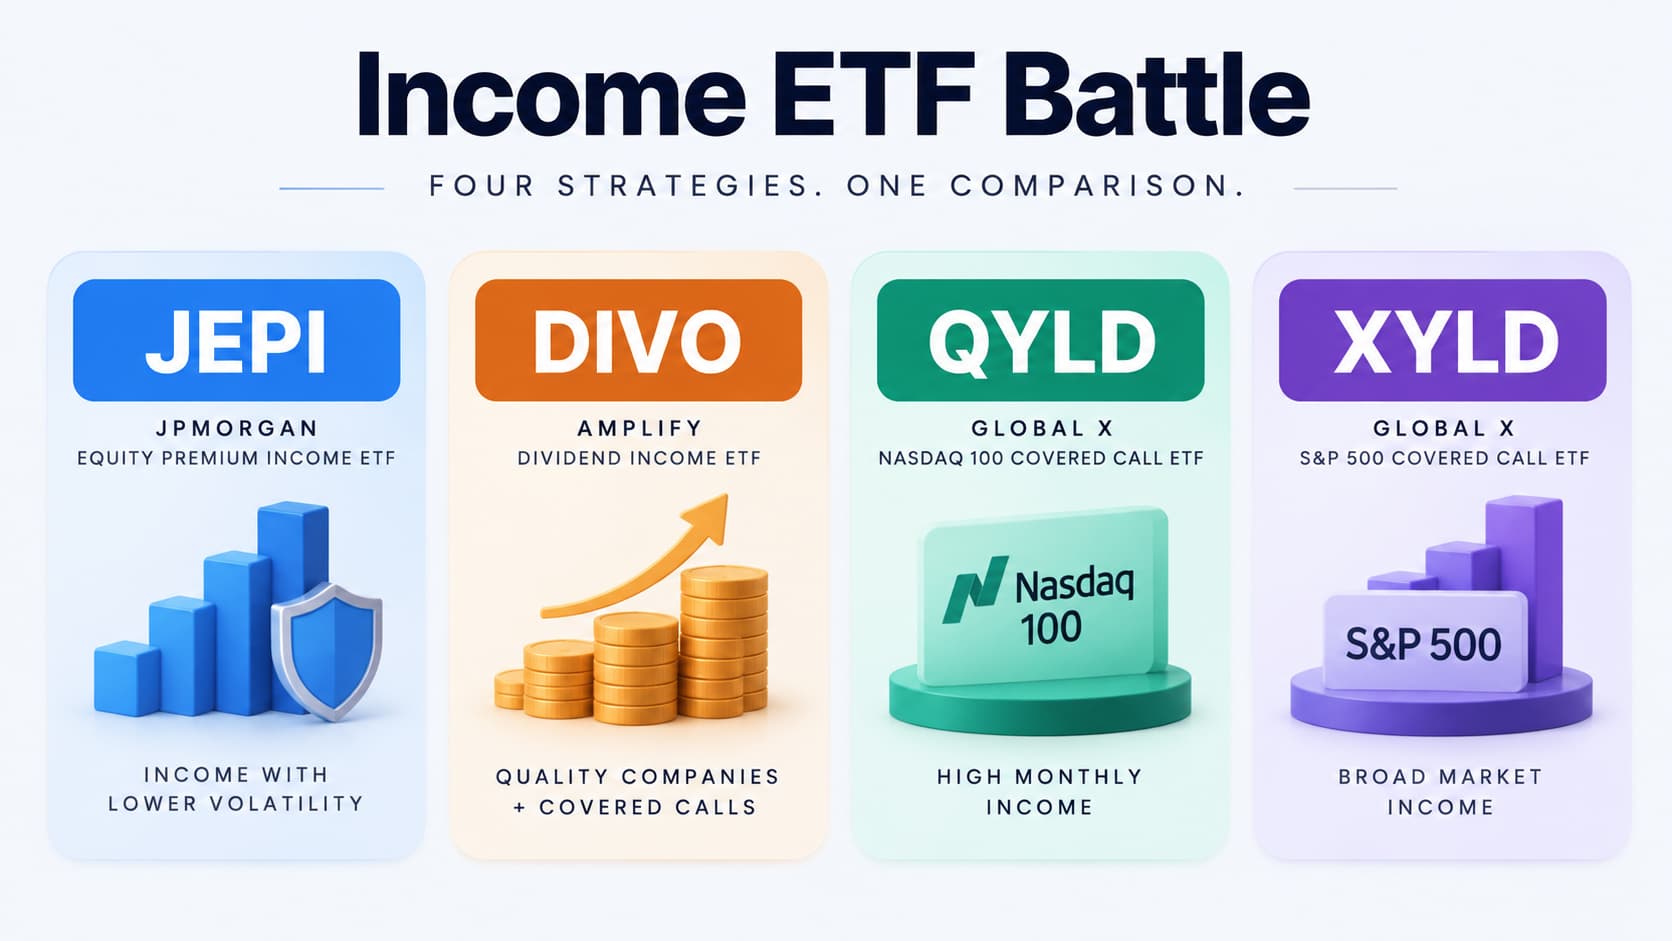
- JEPI combines large-cap stocks with an options strategy designed to generate income while reducing volatility.
- DIVO focuses on high-quality dividend-paying companies and uses covered calls to enhance income.
- QYLD tracks the Nasdaq-100 while using covered calls to generate a high level of monthly income.
- XYLD takes a similar approach with the S&P 500, combining broad large-cap exposure with a covered-call income strategy.
All four emphasize income, but their different approaches can produce very different patterns in distributions, yield on cost, and price performance.
Category Winners
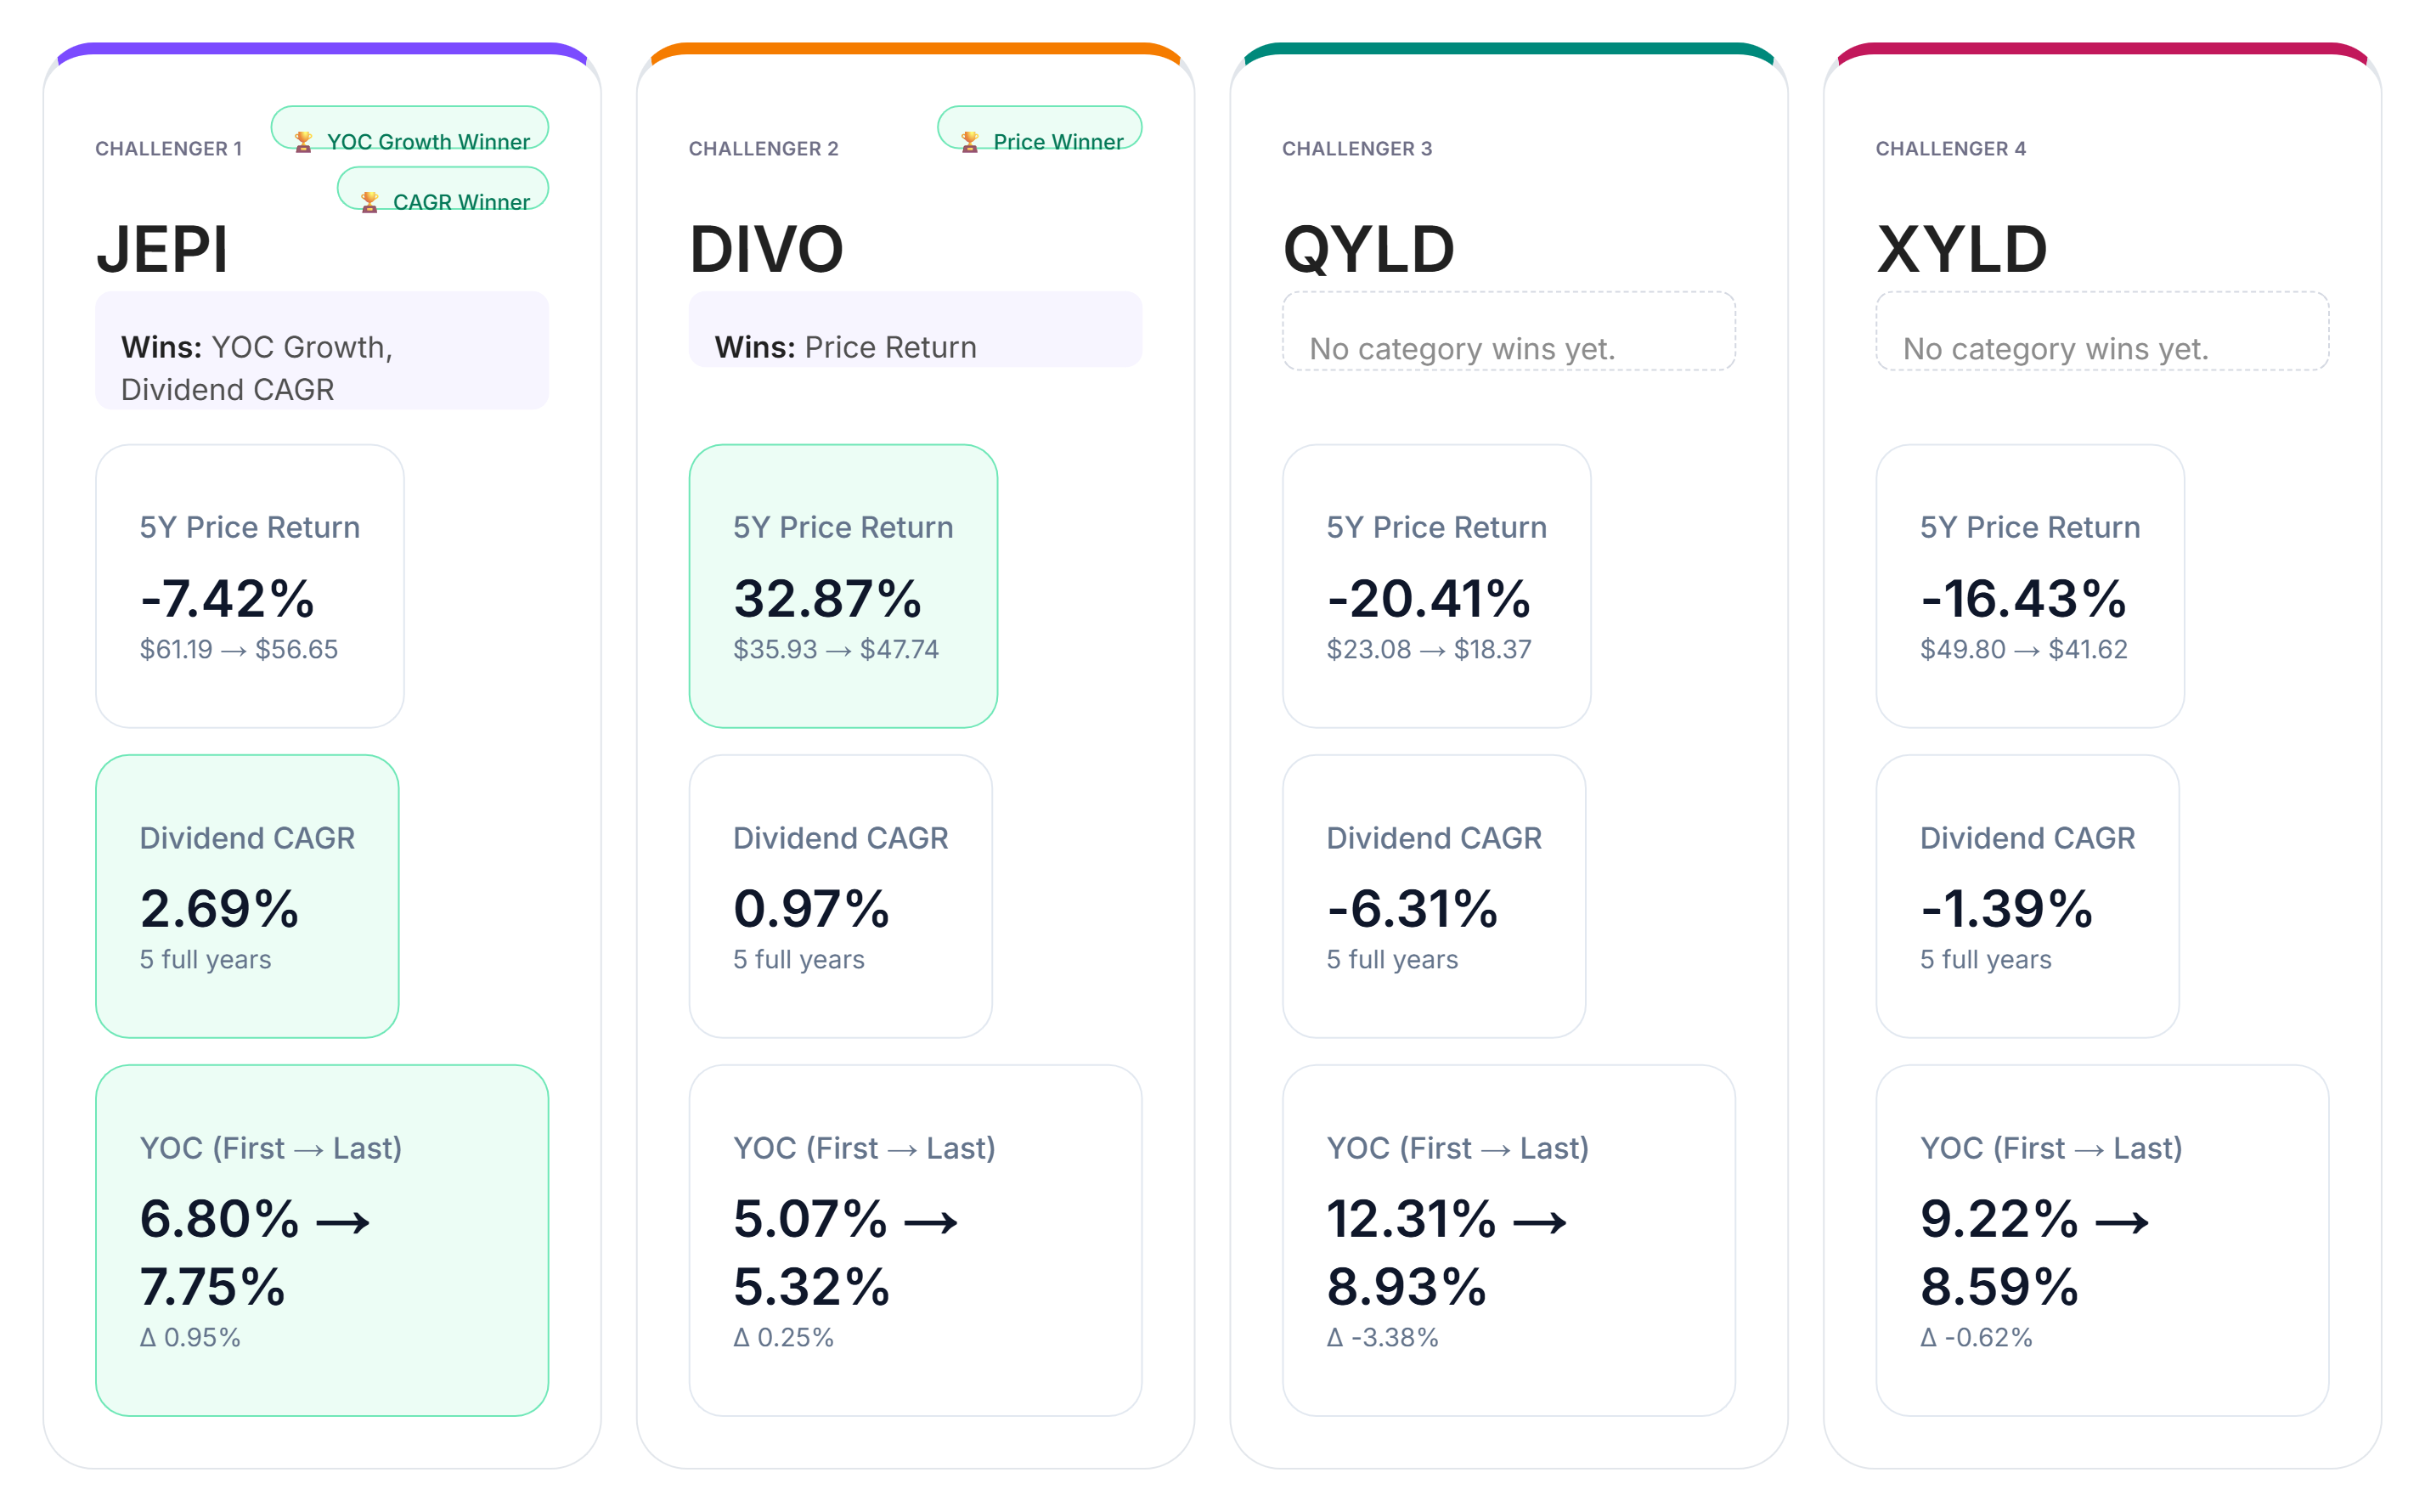
Looking across dividend growth, yield-on-cost growth, and price return, two ETFs take the category wins in this five-year comparison.
In dividend growth, JEPI leads the group with a five-year dividend CAGR of 2.69%.
JEPI also takes the lead in yield-on-cost growth, showing the strongest improvement from the first year to the last.
For price return, DIVO comes out ahead with a five-year return of 32.87%.
The results highlight an important distinction between these income strategies. A fund designed to generate substantial current income does not necessarily produce the strongest distribution growth or price appreciation over the same period.
Yield-on-Cost by Year
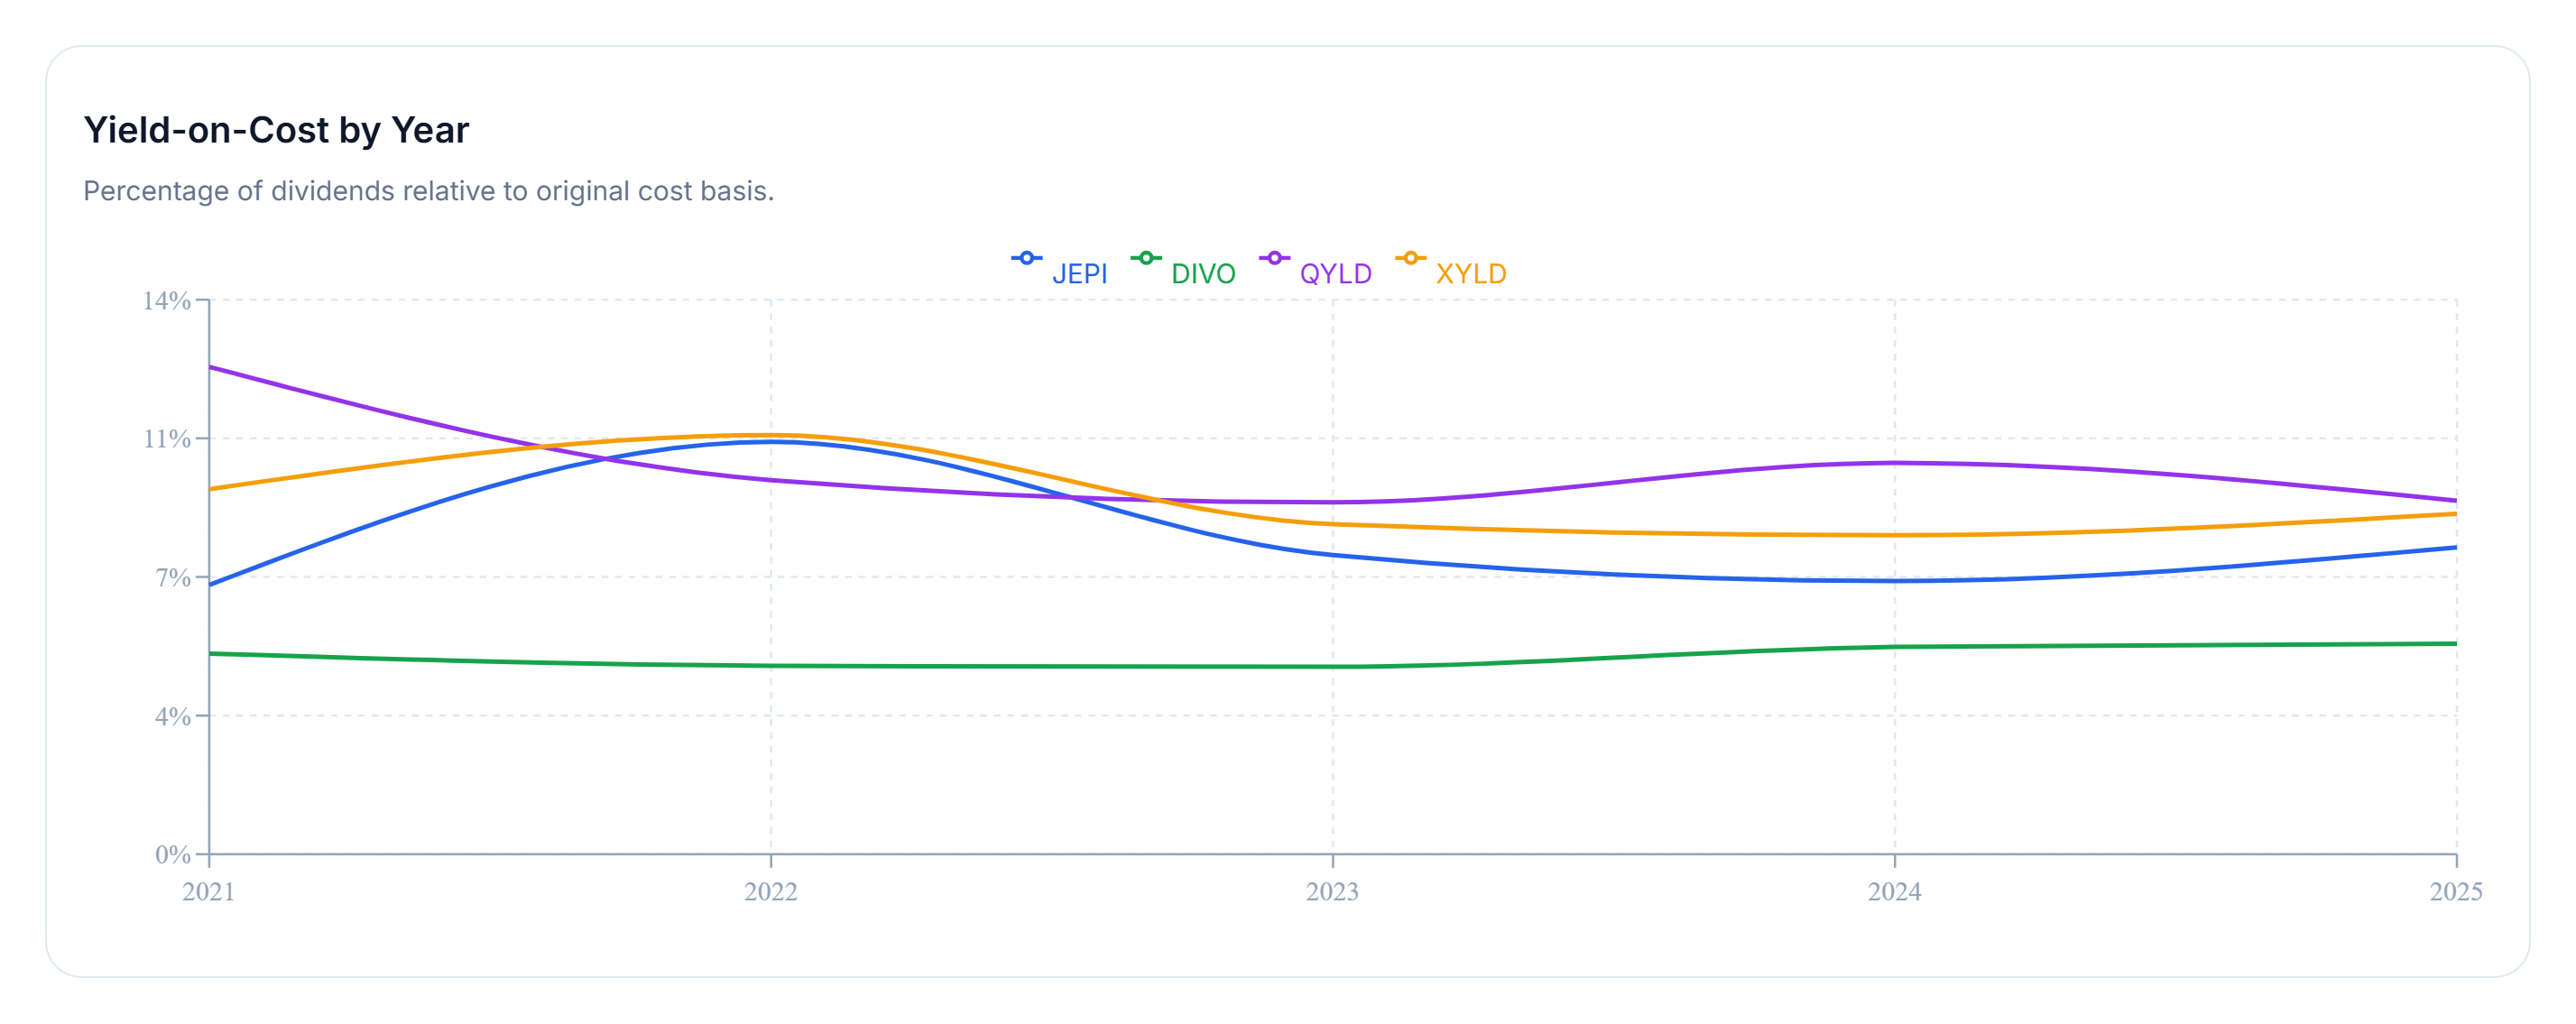
Yield on cost measures the income generated relative to the original investment rather than the investment's current market price.
For these four ETFs, the five-year picture is notably different from the steadily rising income path investors might associate with a traditional dividend-growth portfolio.
JEPI and DIVO finish the period with modestly higher yield on cost than where they began. QYLD and XYLD, however, finish below their starting levels.
QYLD still ends the period with the highest yield on cost at approximately 8.93%, despite declining from roughly 12.31% at the beginning of the period.
That variability is important when evaluating covered-call ETFs. Their distributions can be influenced by option premiums, market volatility, portfolio performance, and fund distribution policies. As a result, distributions can fluctuate considerably from year to year rather than following a predictable upward path.
The historical comparison therefore shows two separate dimensions of income investing: how much income an ETF generates and whether that income has been growing or declining relative to the original investment.
Now let's shift from past performance to today's income picture.
Income Goal Comparison
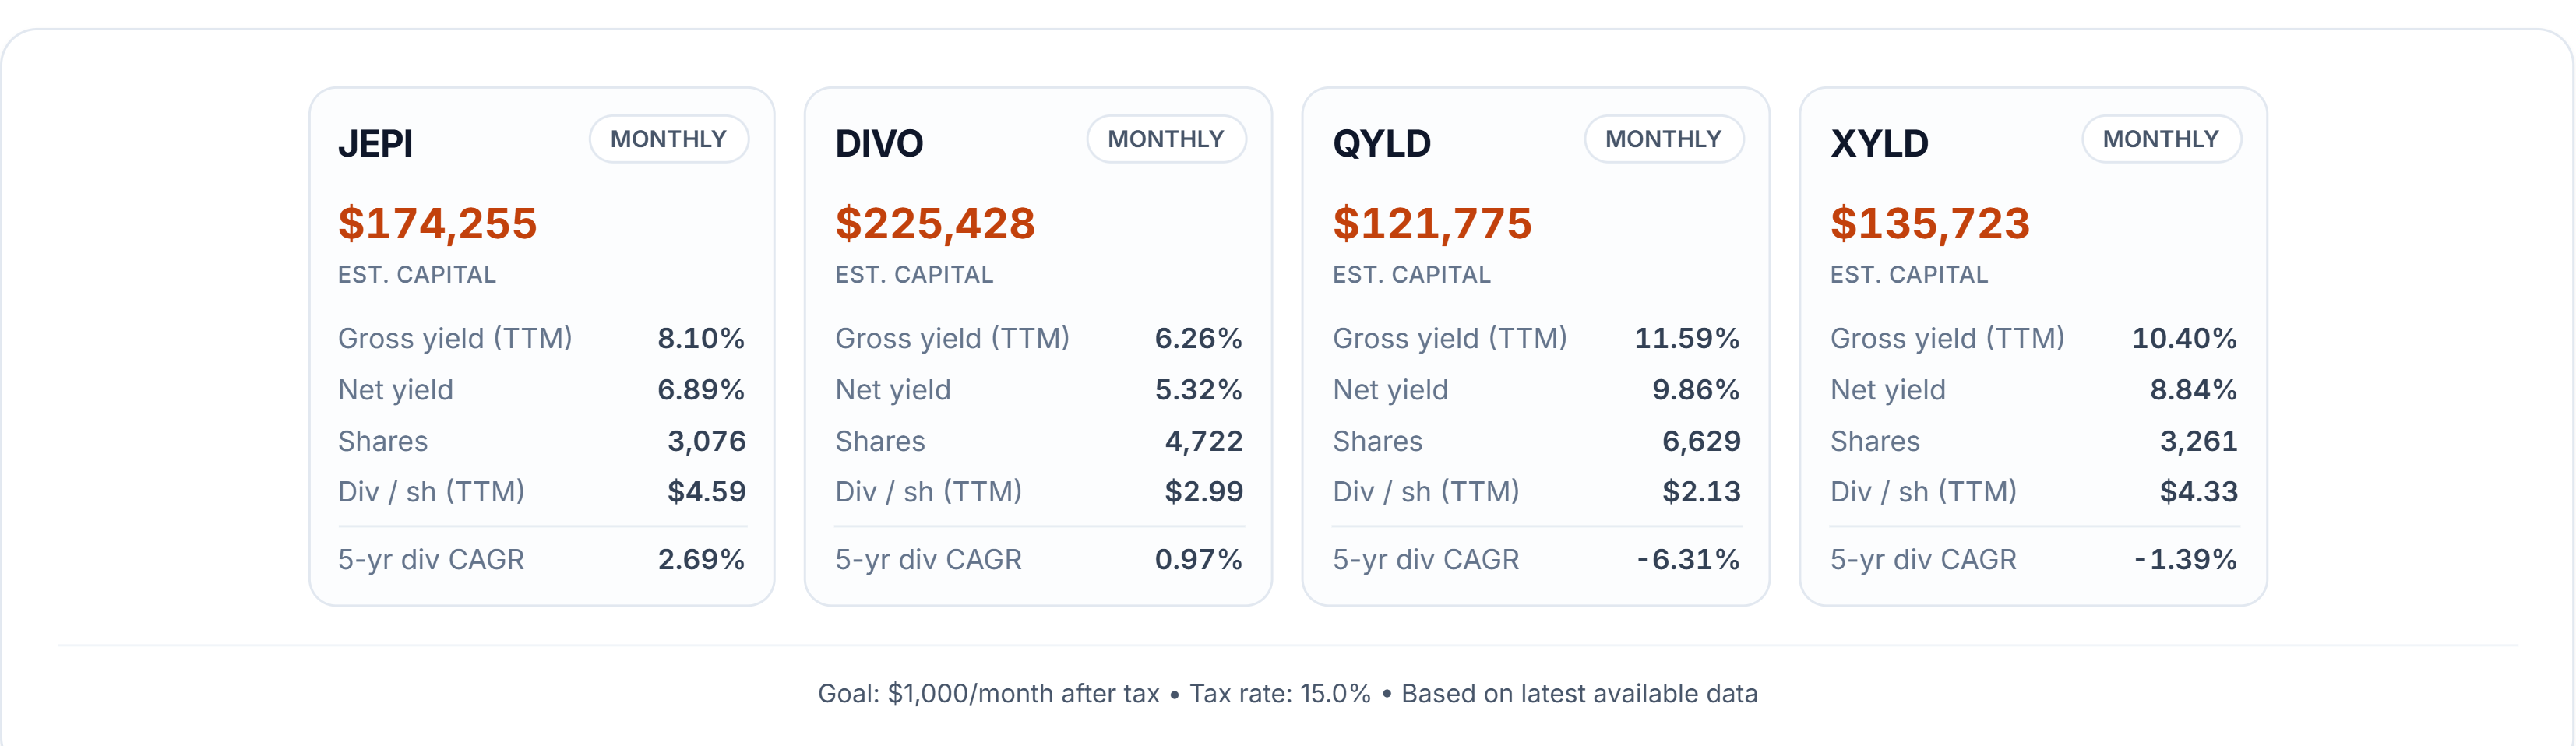
How much capital would each ETF require today to generate $1,000 per month after tax?
Using a 15% tax assumption, QYLD requires the least capital of the group at roughly $121,775, supported by a current yield near 11.6%.
At the opposite end, DIVO requires approximately $225,428, with a yield near 6.3%.
That difference illustrates the immediate advantage of a higher starting yield: less capital is required to generate the same amount of current income.
QYLD offers the highest starting yield in this comparison, while DIVO starts with the lowest. JEPI and XYLD sit more toward the middle of the income spectrum.
But current yield only describes the income picture today. For a long-term income investor, another question is what could happen if the historical distribution trends continued.
Yield Catch-Up Timeline
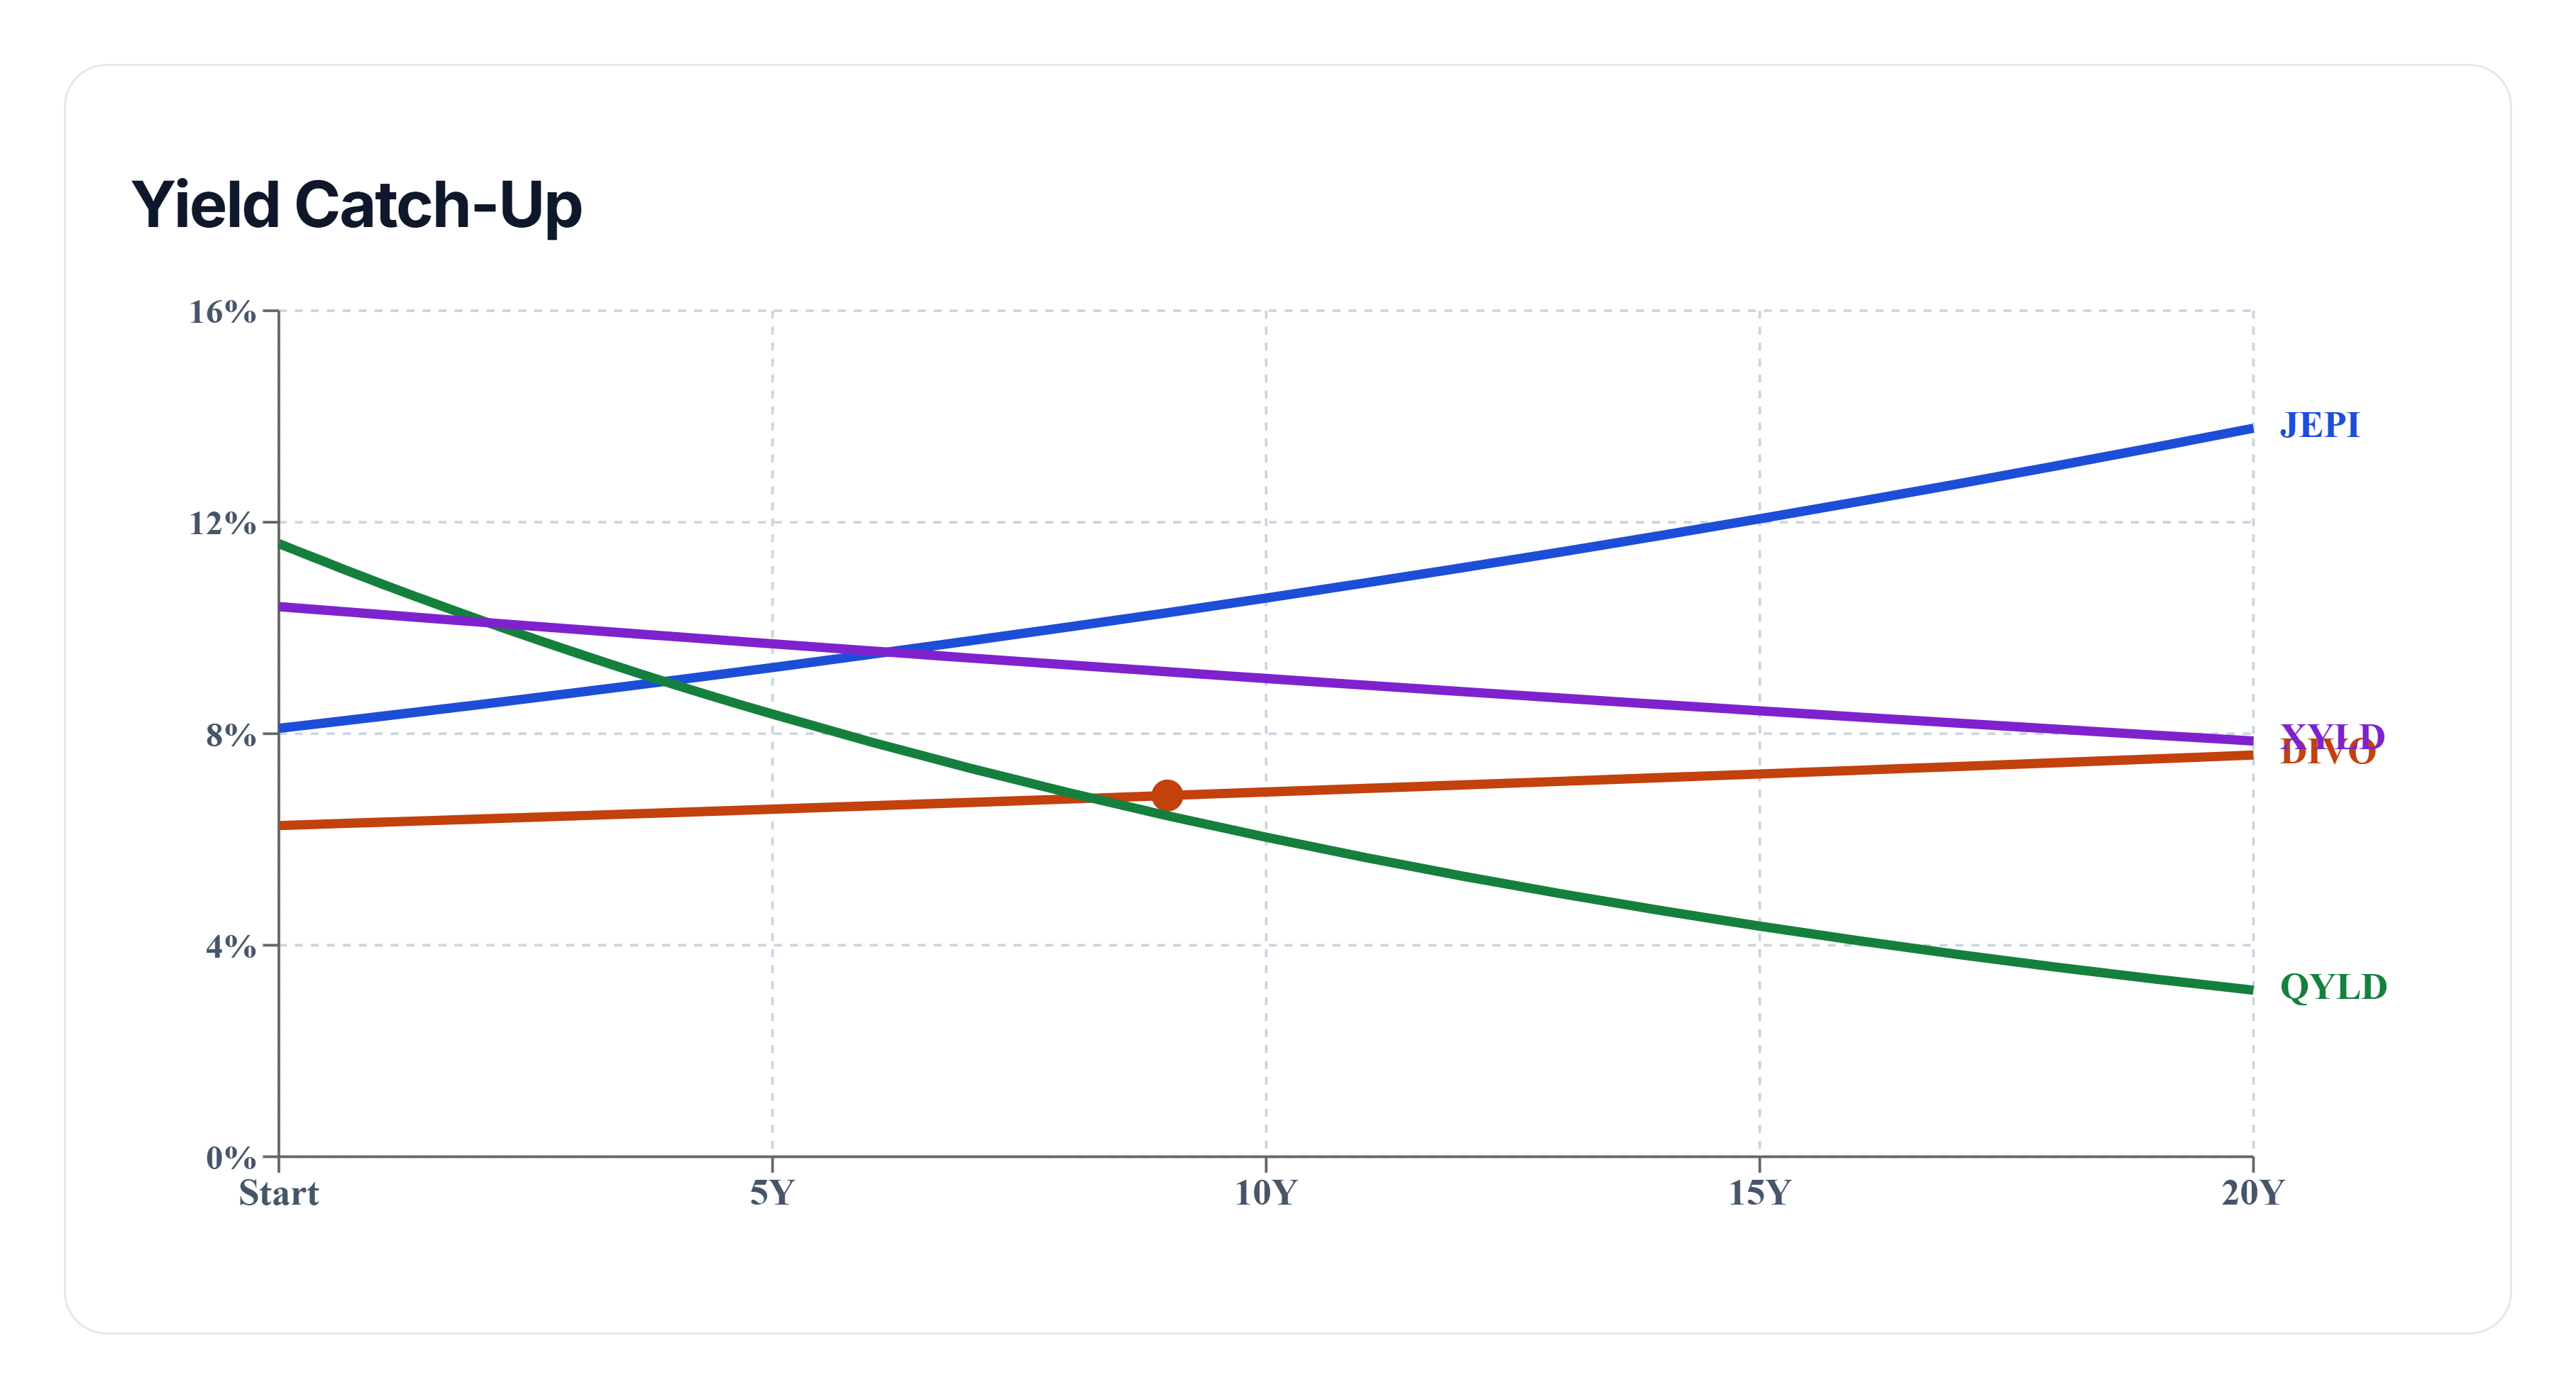
The yield catch-up projection extends each ETF's historical five-year dividend-growth rate forward. It is a model based on past trends, not a prediction of future distributions.
JEPI enters the projection with the strongest historical dividend-growth rate at approximately 2.7%.
QYLD, meanwhile, begins with the highest current yield at roughly 11.6%, giving it a substantial initial income advantage.
DIVO starts much lower at approximately 6.3%, but its historical dividend-growth rate is positive. QYLD's five-year dividend CAGR is negative, so its projected yield on cost declines when that historical trend is extended forward.
Under those assumptions, the large initial gap between DIVO and QYLD gradually narrows.
The model shows DIVO passing QYLD at around year nine in projected yield on cost.
This is not a forecast that the crossover will actually occur. Covered-call ETF distributions can change substantially as market conditions, option premiums, portfolio performance, and distribution policies evolve. Instead, the projection demonstrates how sensitive long-term income outcomes can be to the combination of starting yield and subsequent distribution growth.
Final Takeaway
This battle highlights a different challenge from comparing traditional dividend-growth ETFs.
QYLD offers the strongest current income proposition among the figures highlighted here, requiring roughly $121,775 to reach the $1,000 monthly after-tax target. But its distributions declined over the historical five-year period used in this analysis.
JEPI leads the historical dividend-growth and yield-on-cost-growth categories, while DIVO produces the strongest five-year price return at 32.87%.
The long-term projection makes the trade-off especially visible. A high starting yield can provide considerably more income today, but the direction of future distributions can dramatically change the yield-on-cost picture over time.
For income investors, that means current yield is only one part of the comparison. Distribution stability, distribution growth, price performance, and the amount of capital required to reach an income goal can all tell different parts of the story.
Historical performance and modeled projections do not guarantee future results, and this analysis is for educational purposes rather than financial advice.