High-Yield Income Portfolio Analysis: SPYI, QQQI, BST, and DIVO

Portfolio Overview
This portfolio is built around high-yield option-income ETFs and technology-focused income strategies designed to generate strong monthly cash flow. It combines NEOS S&P 500 High Income ETF (SPYI) and NEOS Nasdaq 100 High Income ETF (QQQI) with the BlackRock Science and Technology Trust (BST) and Amplify CWP Enhanced Dividend Income ETF (DIVO) to create a diversified income engine.
SPYI and QQQI generate most of the portfolio's income through covered-call strategies on major equity indexes, producing elevated yields and steady monthly distributions. BST adds technology exposure through a closed-end fund structure focused on income, while DIVO contributes diversified dividend income from high-quality equities enhanced by options premiums.
Dividend Growth Trend
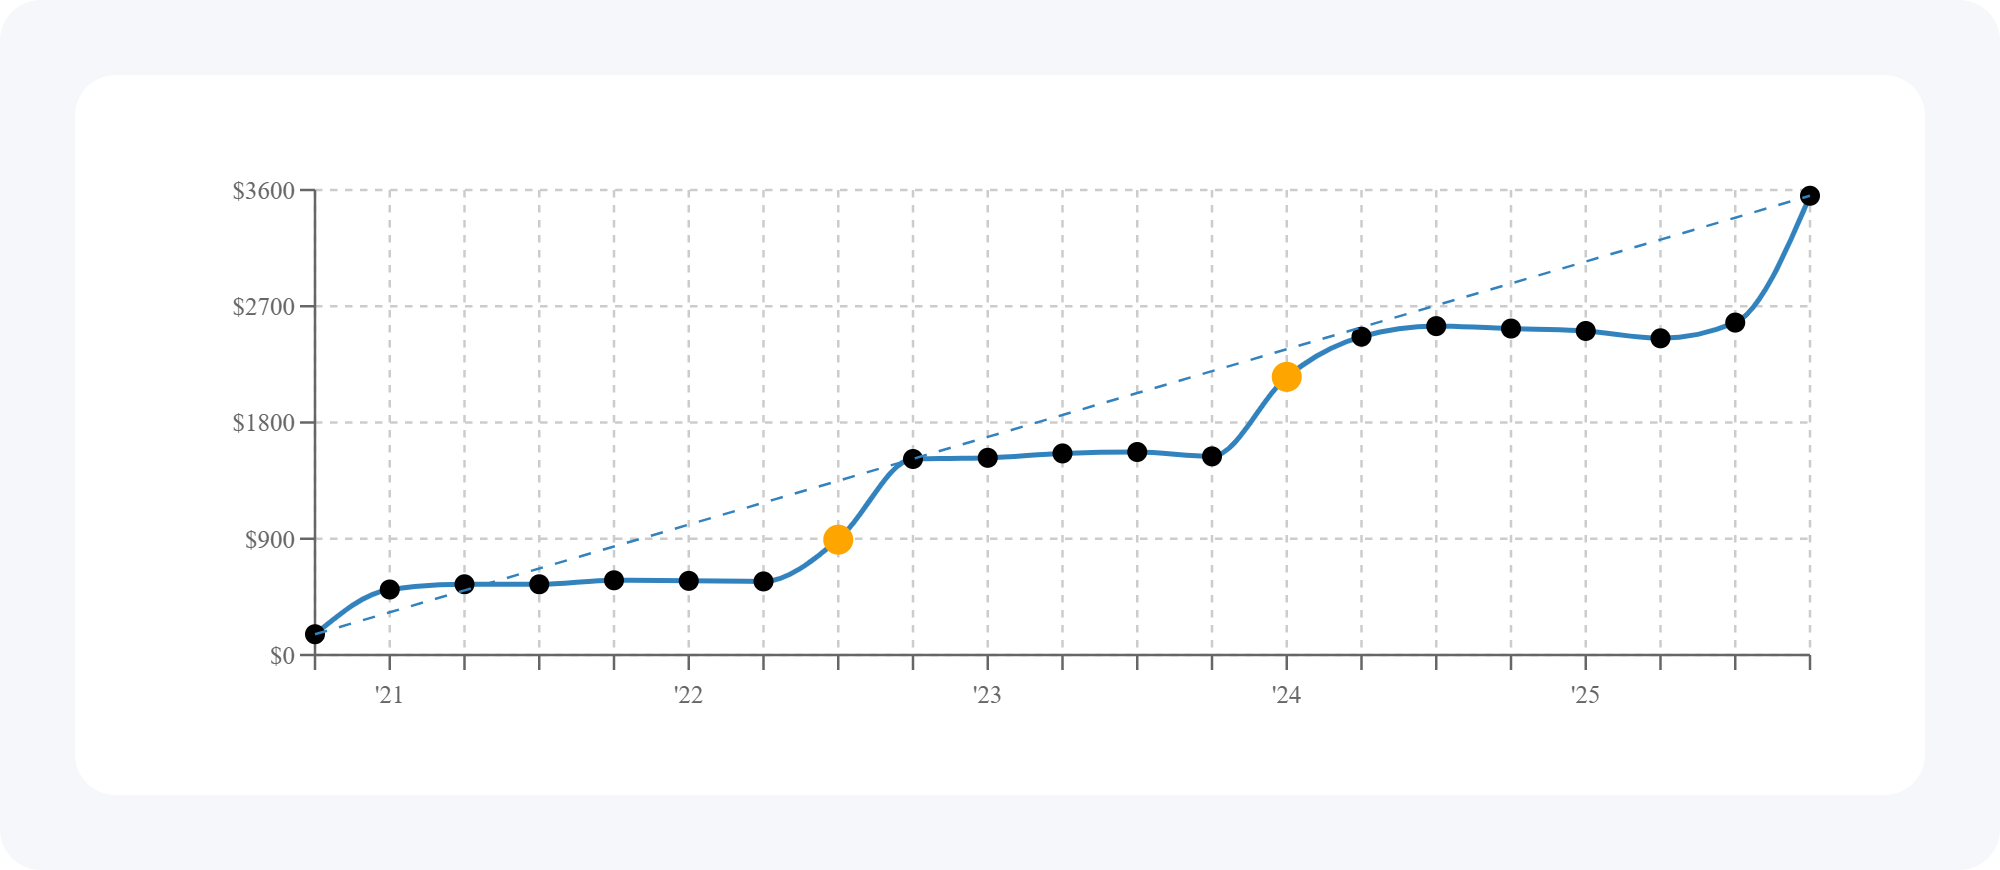
Here's the dividend growth trend for these holdings over the last five years.
The noticeable jumps in the line occur when newer income ETFs like SPYI and QQQI entered the portfolio. As these high-yield strategies were added, the overall income stream increased significantly — demonstrating how introducing higher-yield instruments can accelerate a portfolio's cash-flow growth.
Portfolio Snapshot

Here's the quick snapshot for this portfolio:
- Yield on cost: 10.5%
- Annual dividend income: $10,510 per year
- Monthly dividend income: about $876 per month
- Dividend income growth: roughly 7.3% per year over five years
- Average ETF expense ratio: 0.48% (about $508 per year in fees)
This portfolio emphasizes strong current income generation, combining option-income ETFs with technology-focused income strategies to produce elevated yield and steady monthly distributions.
Income Breakdown by Holding
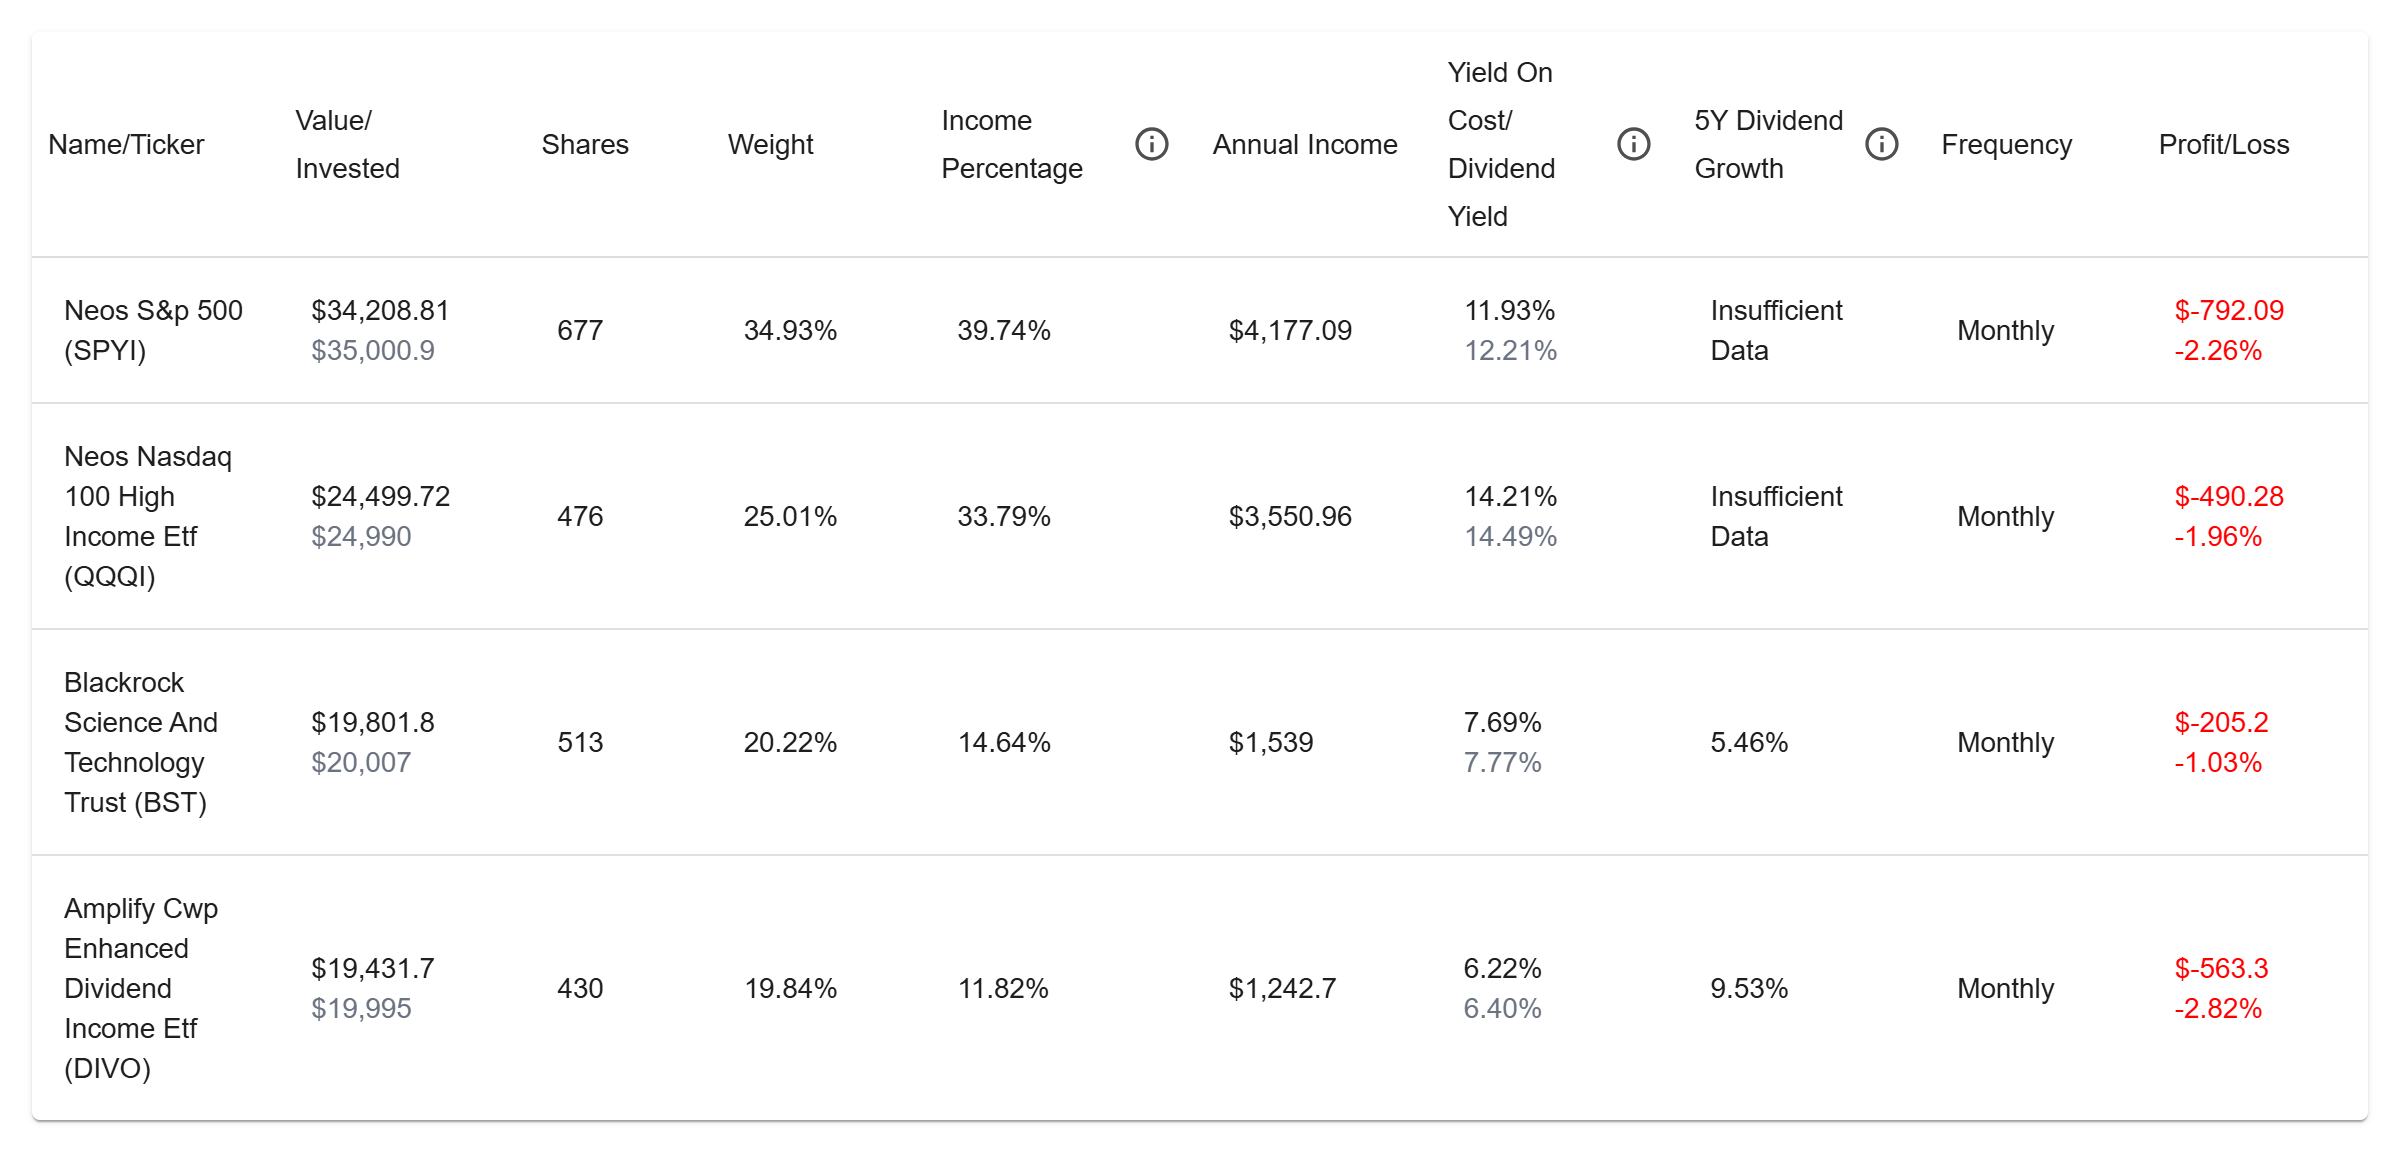
Here's how the portfolio's dividend income is split between the holdings:
- SPYI: about 39.7% of the income (roughly $4,173 per year)
- QQQI: about 33.8% (about $3,553 per year)
- BST: about 14.6% (about $1,535 per year)
- DIVO: about 11.8% (about $1,240 per year)
Distribution frequency within this portfolio:
- SPYI: monthly
- QQQI: monthly
- BST: monthly
- DIVO: monthly
This allocation creates a high monthly income engine, with SPYI and QQQI driving most of the cash flow while BST and DIVO add diversification and technology exposure.
Forward Income Outlook
If income growth continues in line with recent history, this portfolio's cash flow could rise steadily over time.
- Yield on cost may grow from 10.5% today to about 14.9% in five years
- Annual income could increase from $10,510 to roughly $14,935
- Monthly income could rise from $876 to about $1,245
- And this projection is described as happening without adding new capital or reinvesting dividends
This highlights the potential of high-yield income strategies: even without additional contributions, rising distributions and reinvestment effects can meaningfully expand a portfolio's cash flow over time.