BMO vs RY vs TD vs BNS: Canadian Bank Dividend Battle
Portfolio Overview
In this DividendXray battle, we compare four major Canadian banks across dividend growth, yield-on-cost expansion, and price return over a five-year period.
- BMO (Bank of Montreal) combines a long dividend history with a broad banking and wealth management business.
- RY (Royal Bank of Canada) is Canada's largest bank, with diversified operations across banking, wealth management, and capital markets.
- TD (Toronto-Dominion Bank) has a major presence in both Canada and the United States, with a long history of paying dividends.
- BNS (Bank of Nova Scotia) stands out for its international exposure, including Latin America.
Each bank brings a different mix of current income, dividend growth, and business exposure to the comparison.
Category Winners
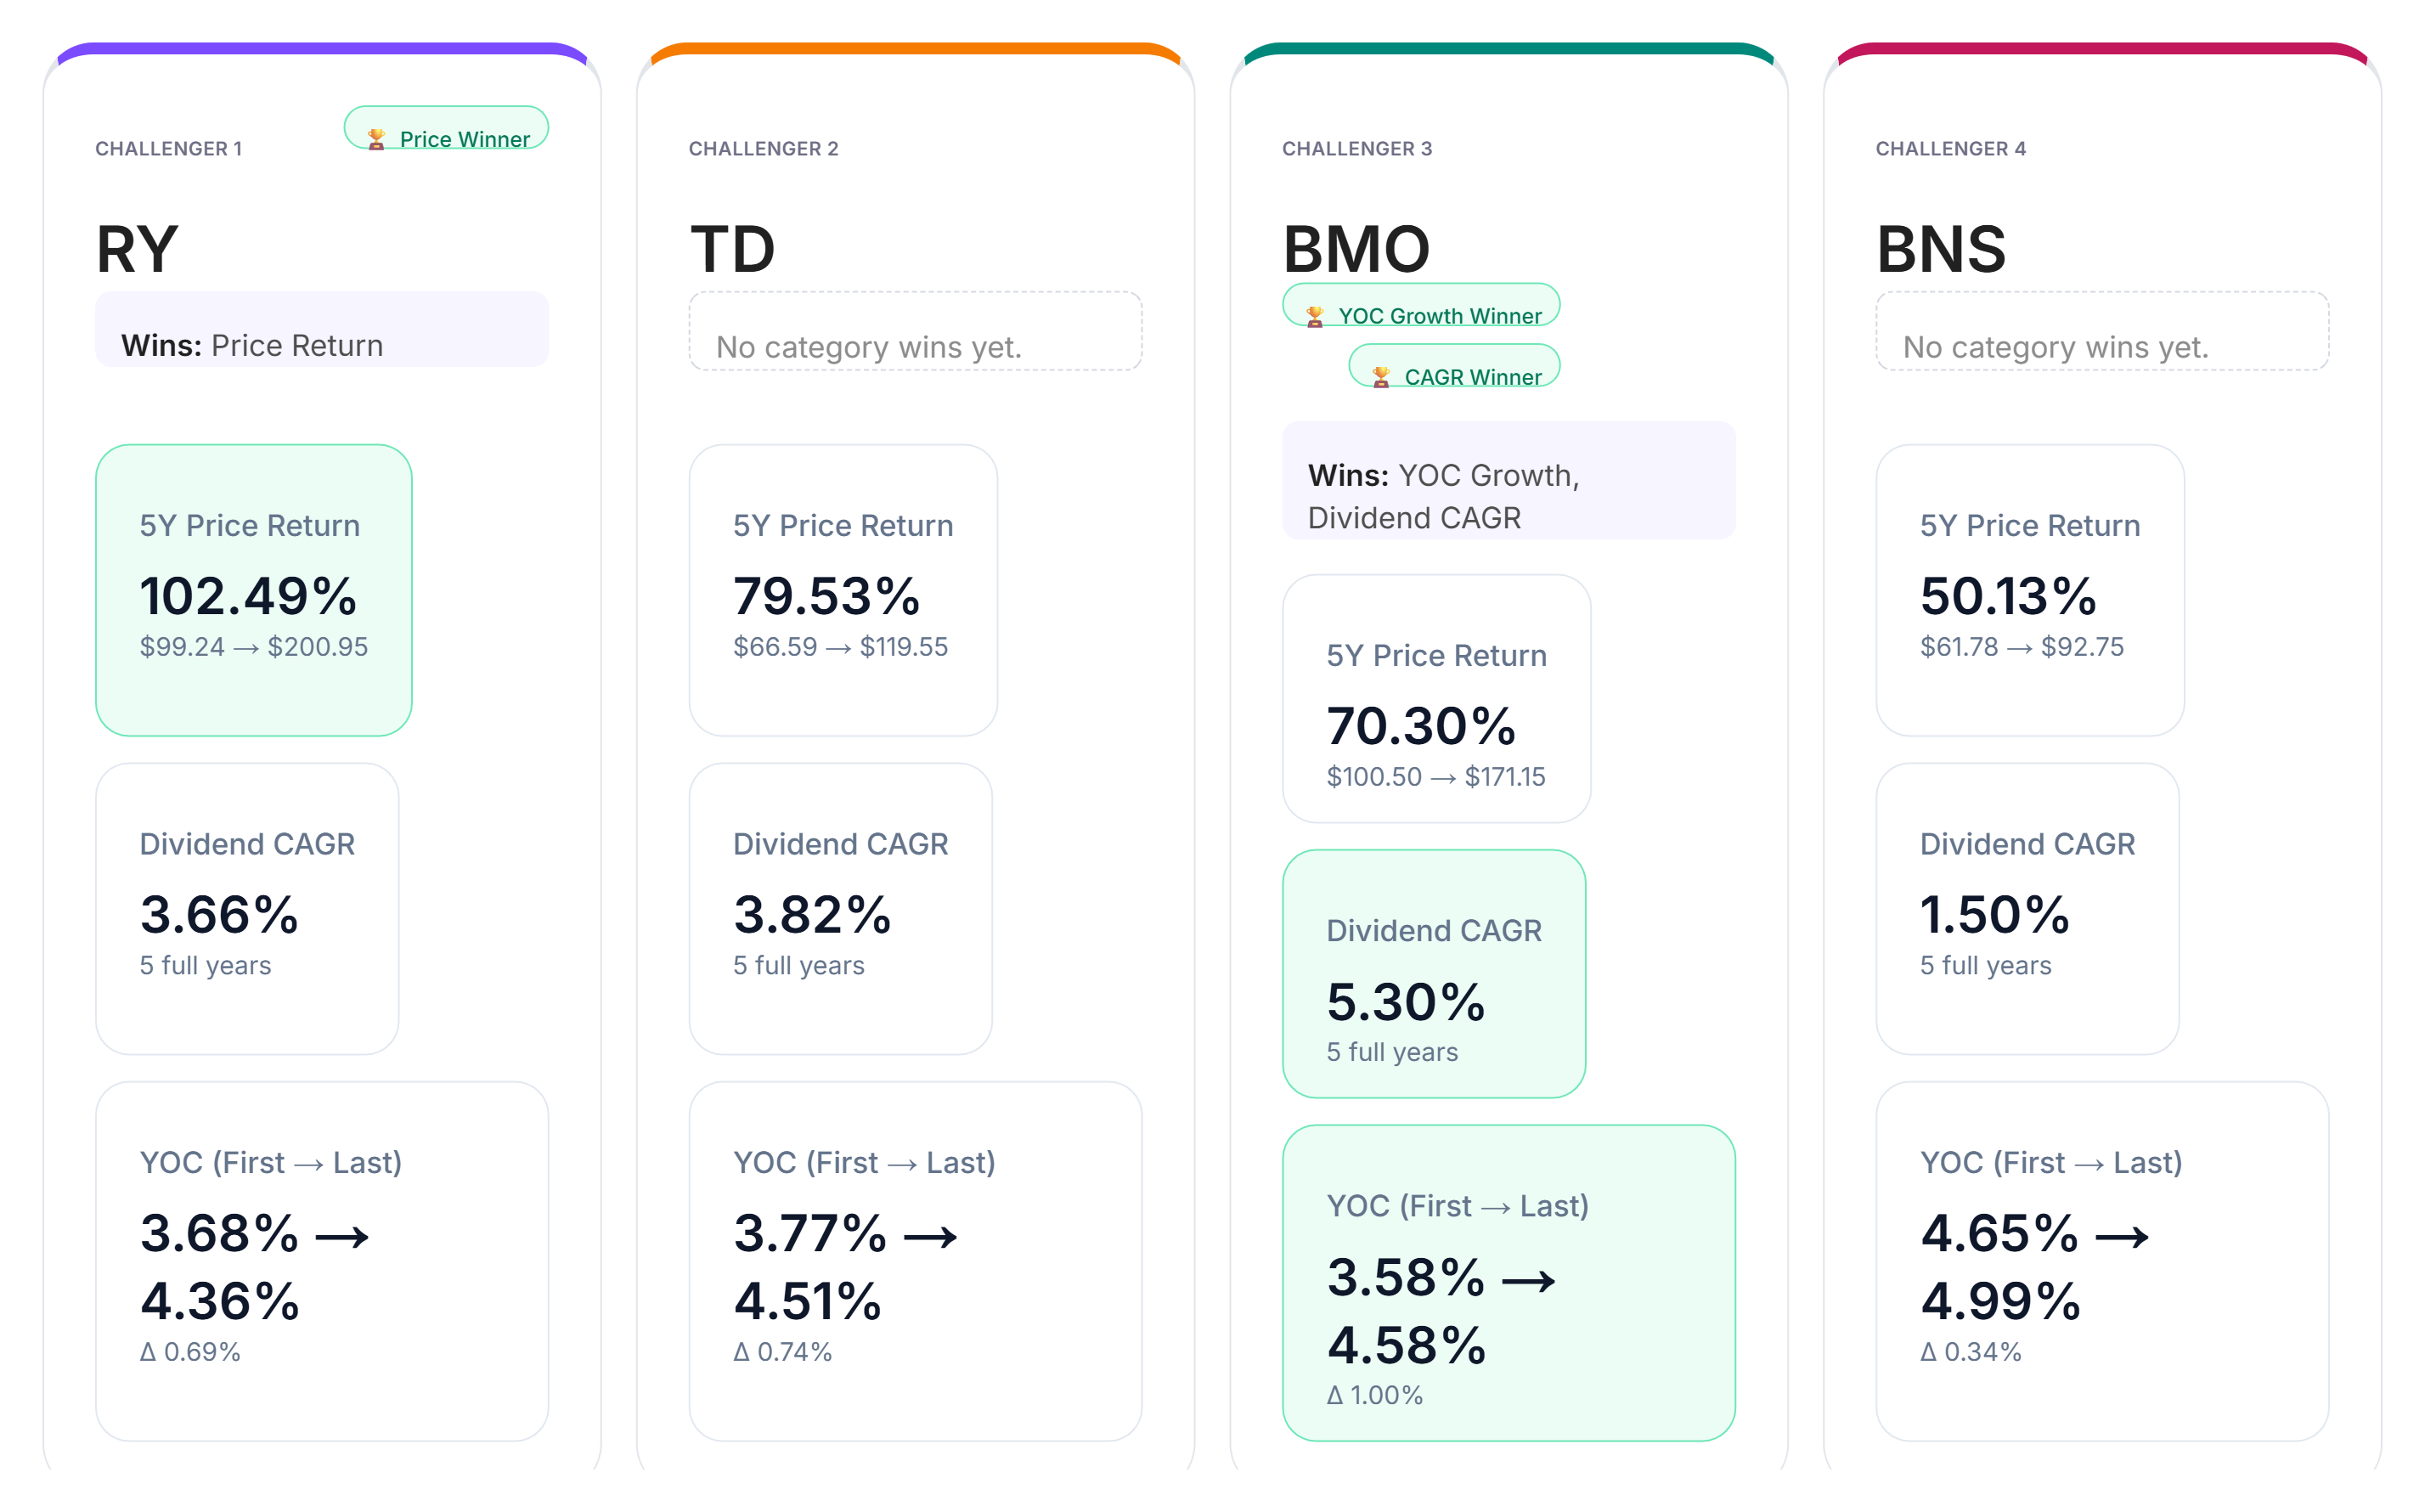
Looking at the five-year data across dividend CAGR, yield-on-cost growth, and price return, different leaders emerge.
In dividend growth, BMO leads the group with a five-year dividend CAGR of 5.3%.
For yield-on-cost growth, BMO again takes the category, showing the strongest improvement from the first year to the last.
In price return, RY comes out ahead with a five-year return of 102.49%.
TD and BNS deliver solid results across the comparison but do not take a category win in this battle.
The results show why looking at several metrics matters. Dividend growth, income efficiency, and share-price performance measure different aspects of an investment, and the same bank does not necessarily lead across all three.
Yield-on-Cost by Year
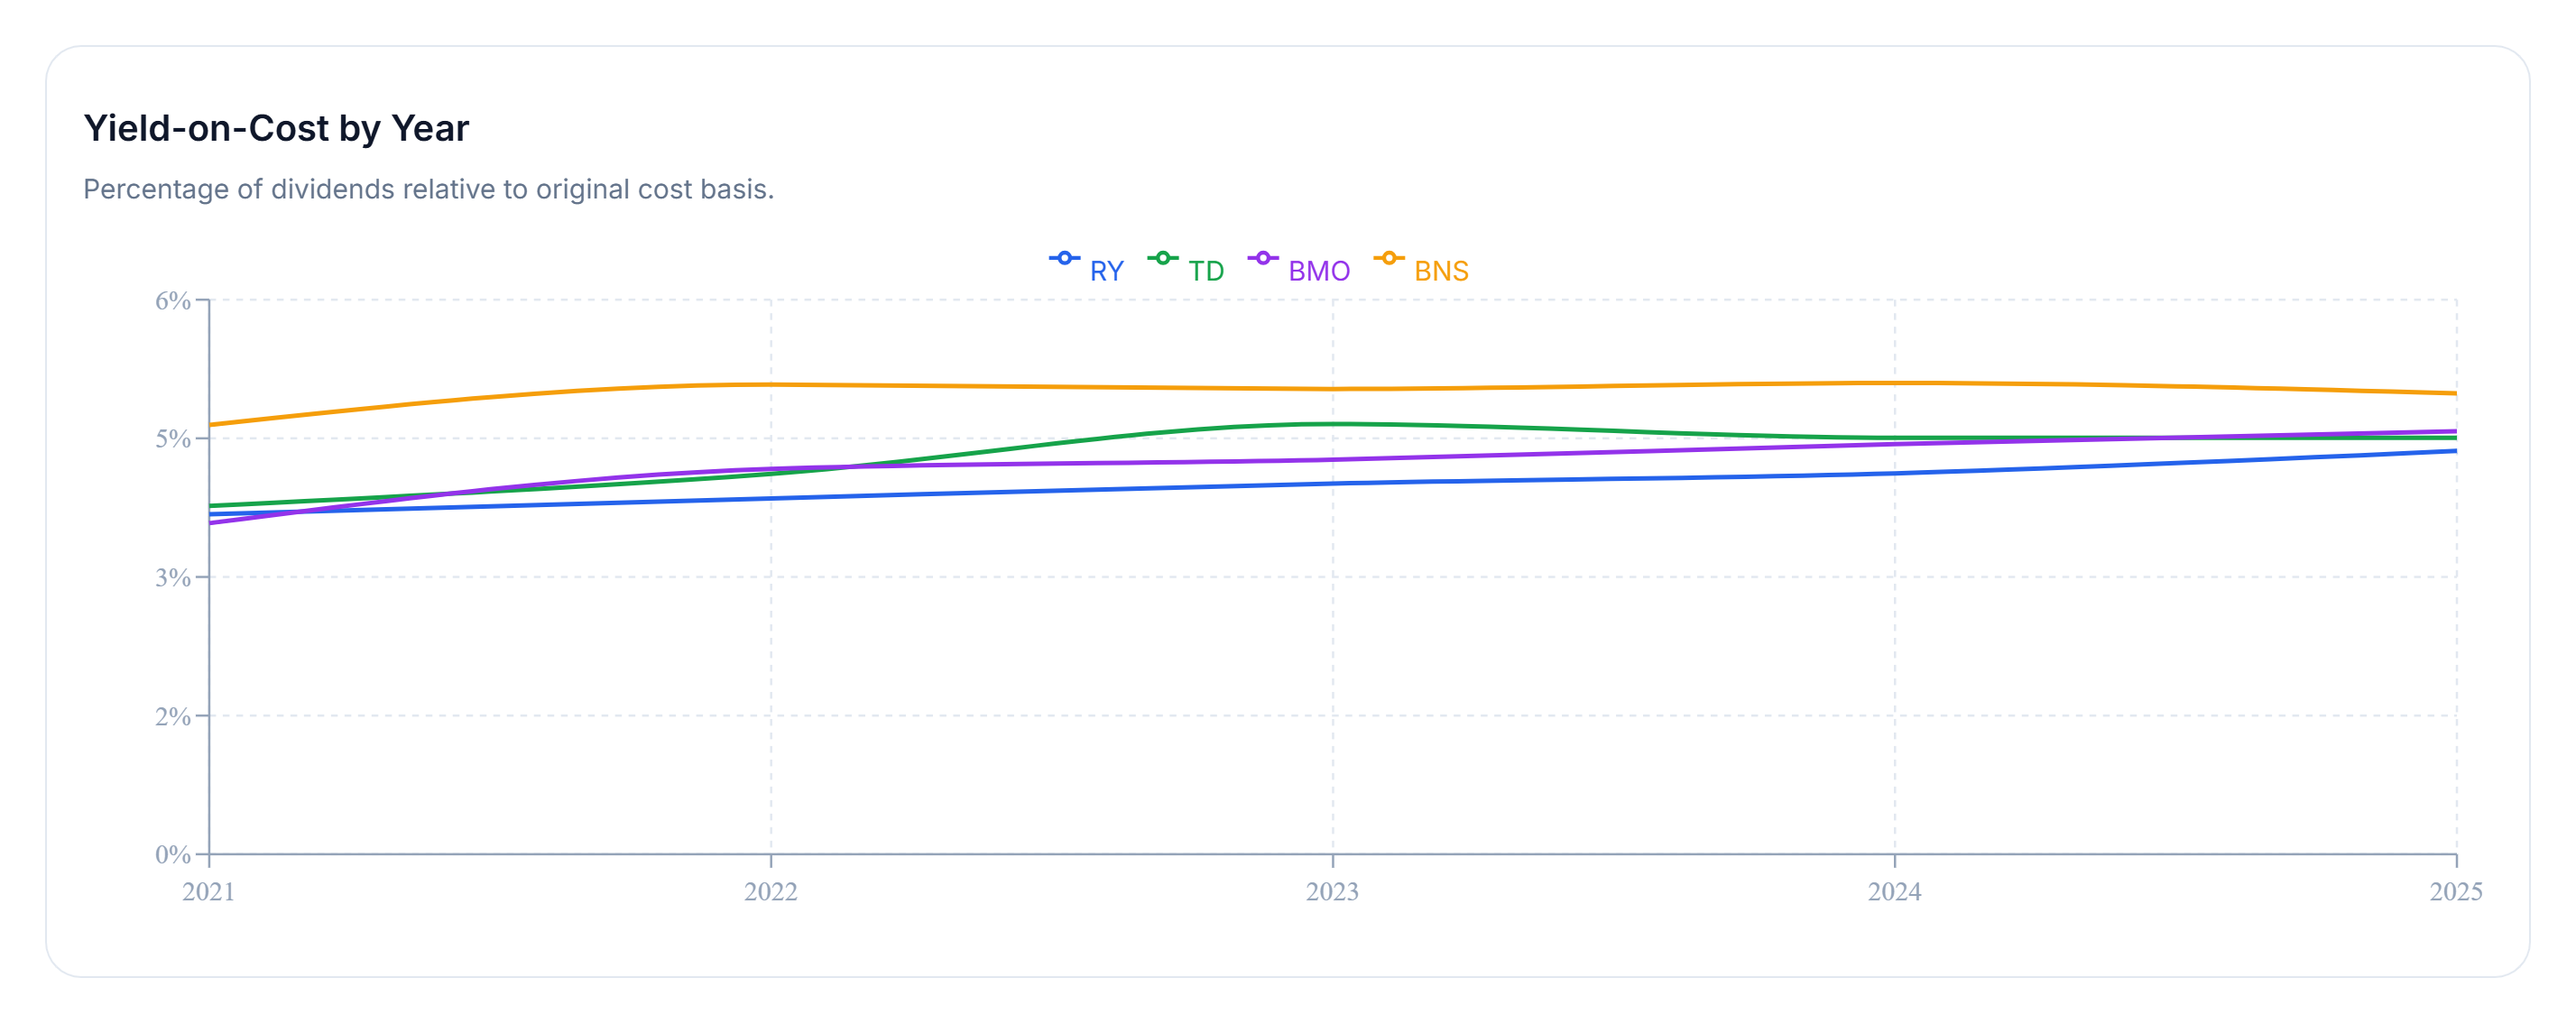
Yield on cost measures dividend income relative to the original investment rather than the holding's current market price. This provides a way to see how income generated by the original capital changes over time.
Across the five-year window, BNS stands out for income efficiency, reaching approximately 4.99% yield on cost by the end of the period.
The other holdings grow more gradually, but all show steady upward income trends over the same five-year window.
There is also an important currency consideration when interpreting these results. Because the historical figures are measured in U.S. dollars, changes in the U.S.-Canadian exchange rate affect the reported dividend values and growth rates. The USD results therefore reflect both the underlying dividends and the effect of currency movements.
Yield on cost adds another perspective to the battle. A holding does not need to have the strongest price return to produce attractive income relative to the investor's original capital.
Now let's shift from past performance to today's income picture.
Income Goal Comparison
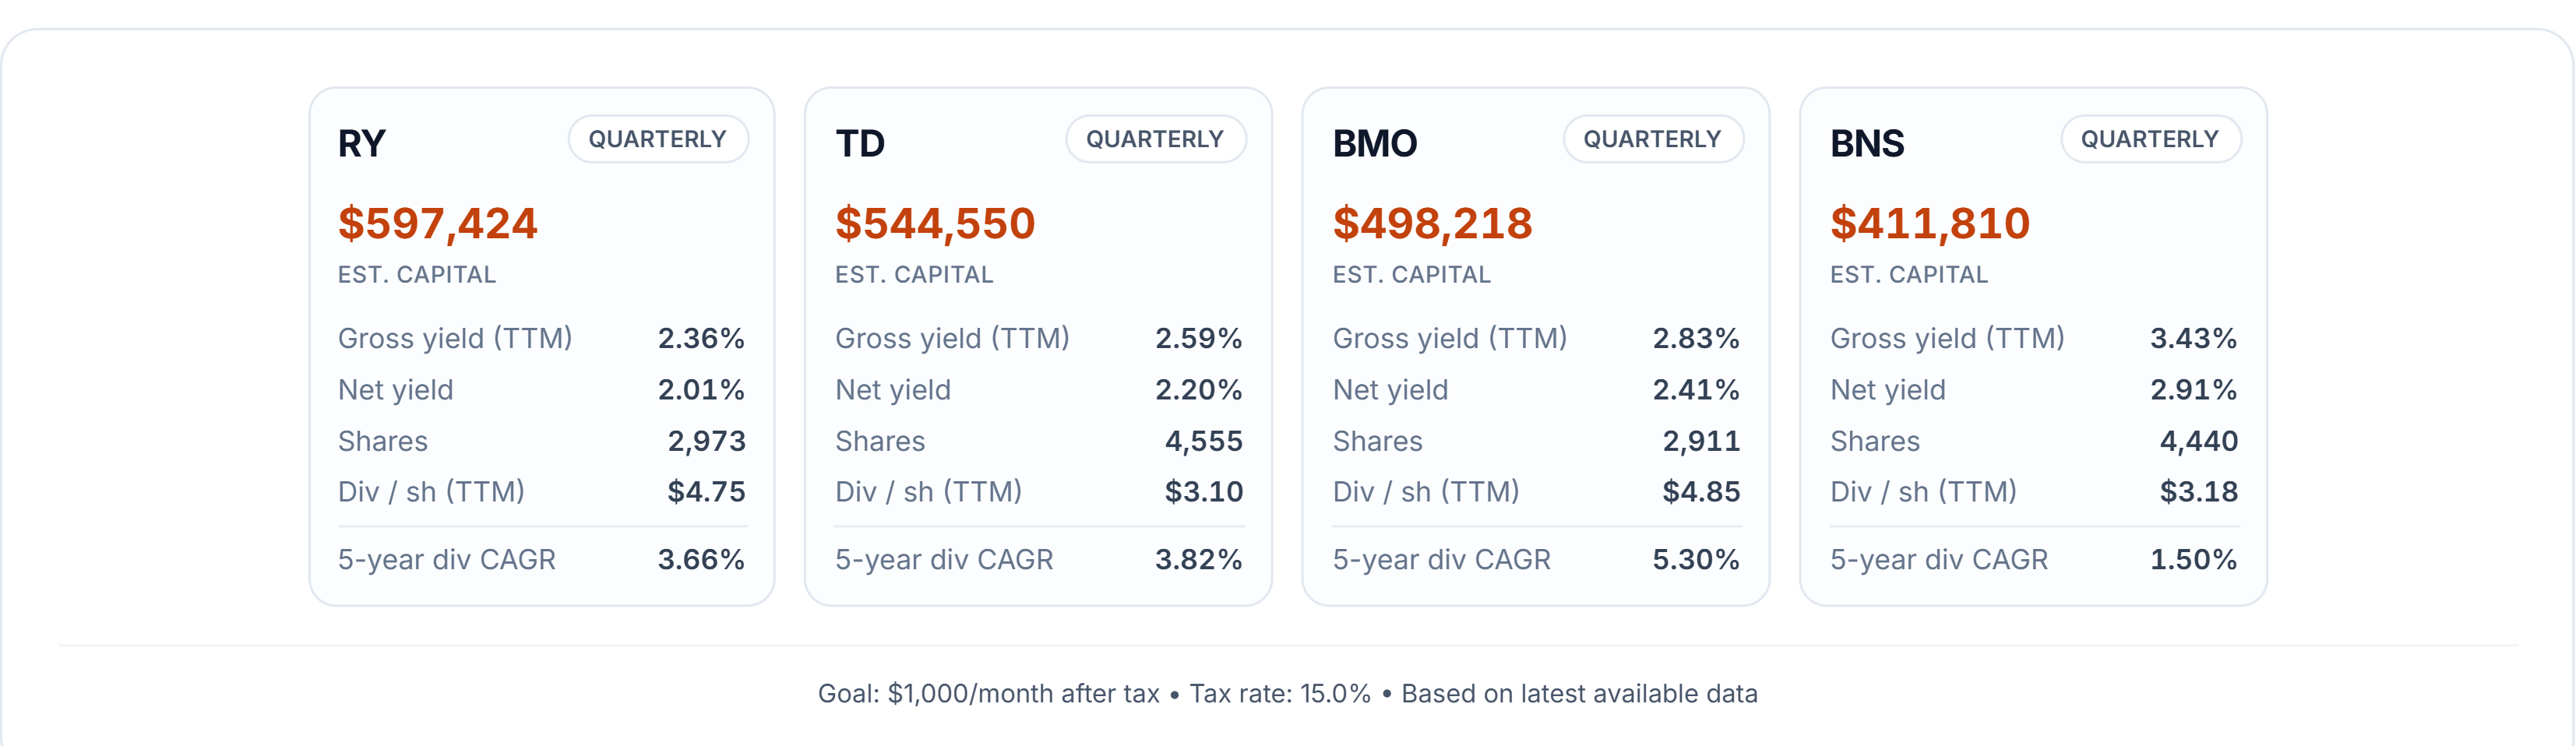
How much capital would be required to generate $1,000 per month in after-tax dividend income today?
Using a 15.0% tax assumption, BNS requires the least capital in this comparison at roughly $411,810, with a current yield near 3.4%.
At the other end of the comparison, RY requires the most capital at about $597,424, with a yield near 2.4%.
BNS therefore begins with the highest yield near 3.4%, while RY starts with the lowest near 2.4%. TD and BMO sit more in the middle between current yield and dividend growth.
This illustrates the tradeoff between current income and growth. A higher starting yield can reduce the amount of capital required to reach an income target today, while stronger dividend growth may change the income relationship over a longer period.
Yield Catch-Up Timeline
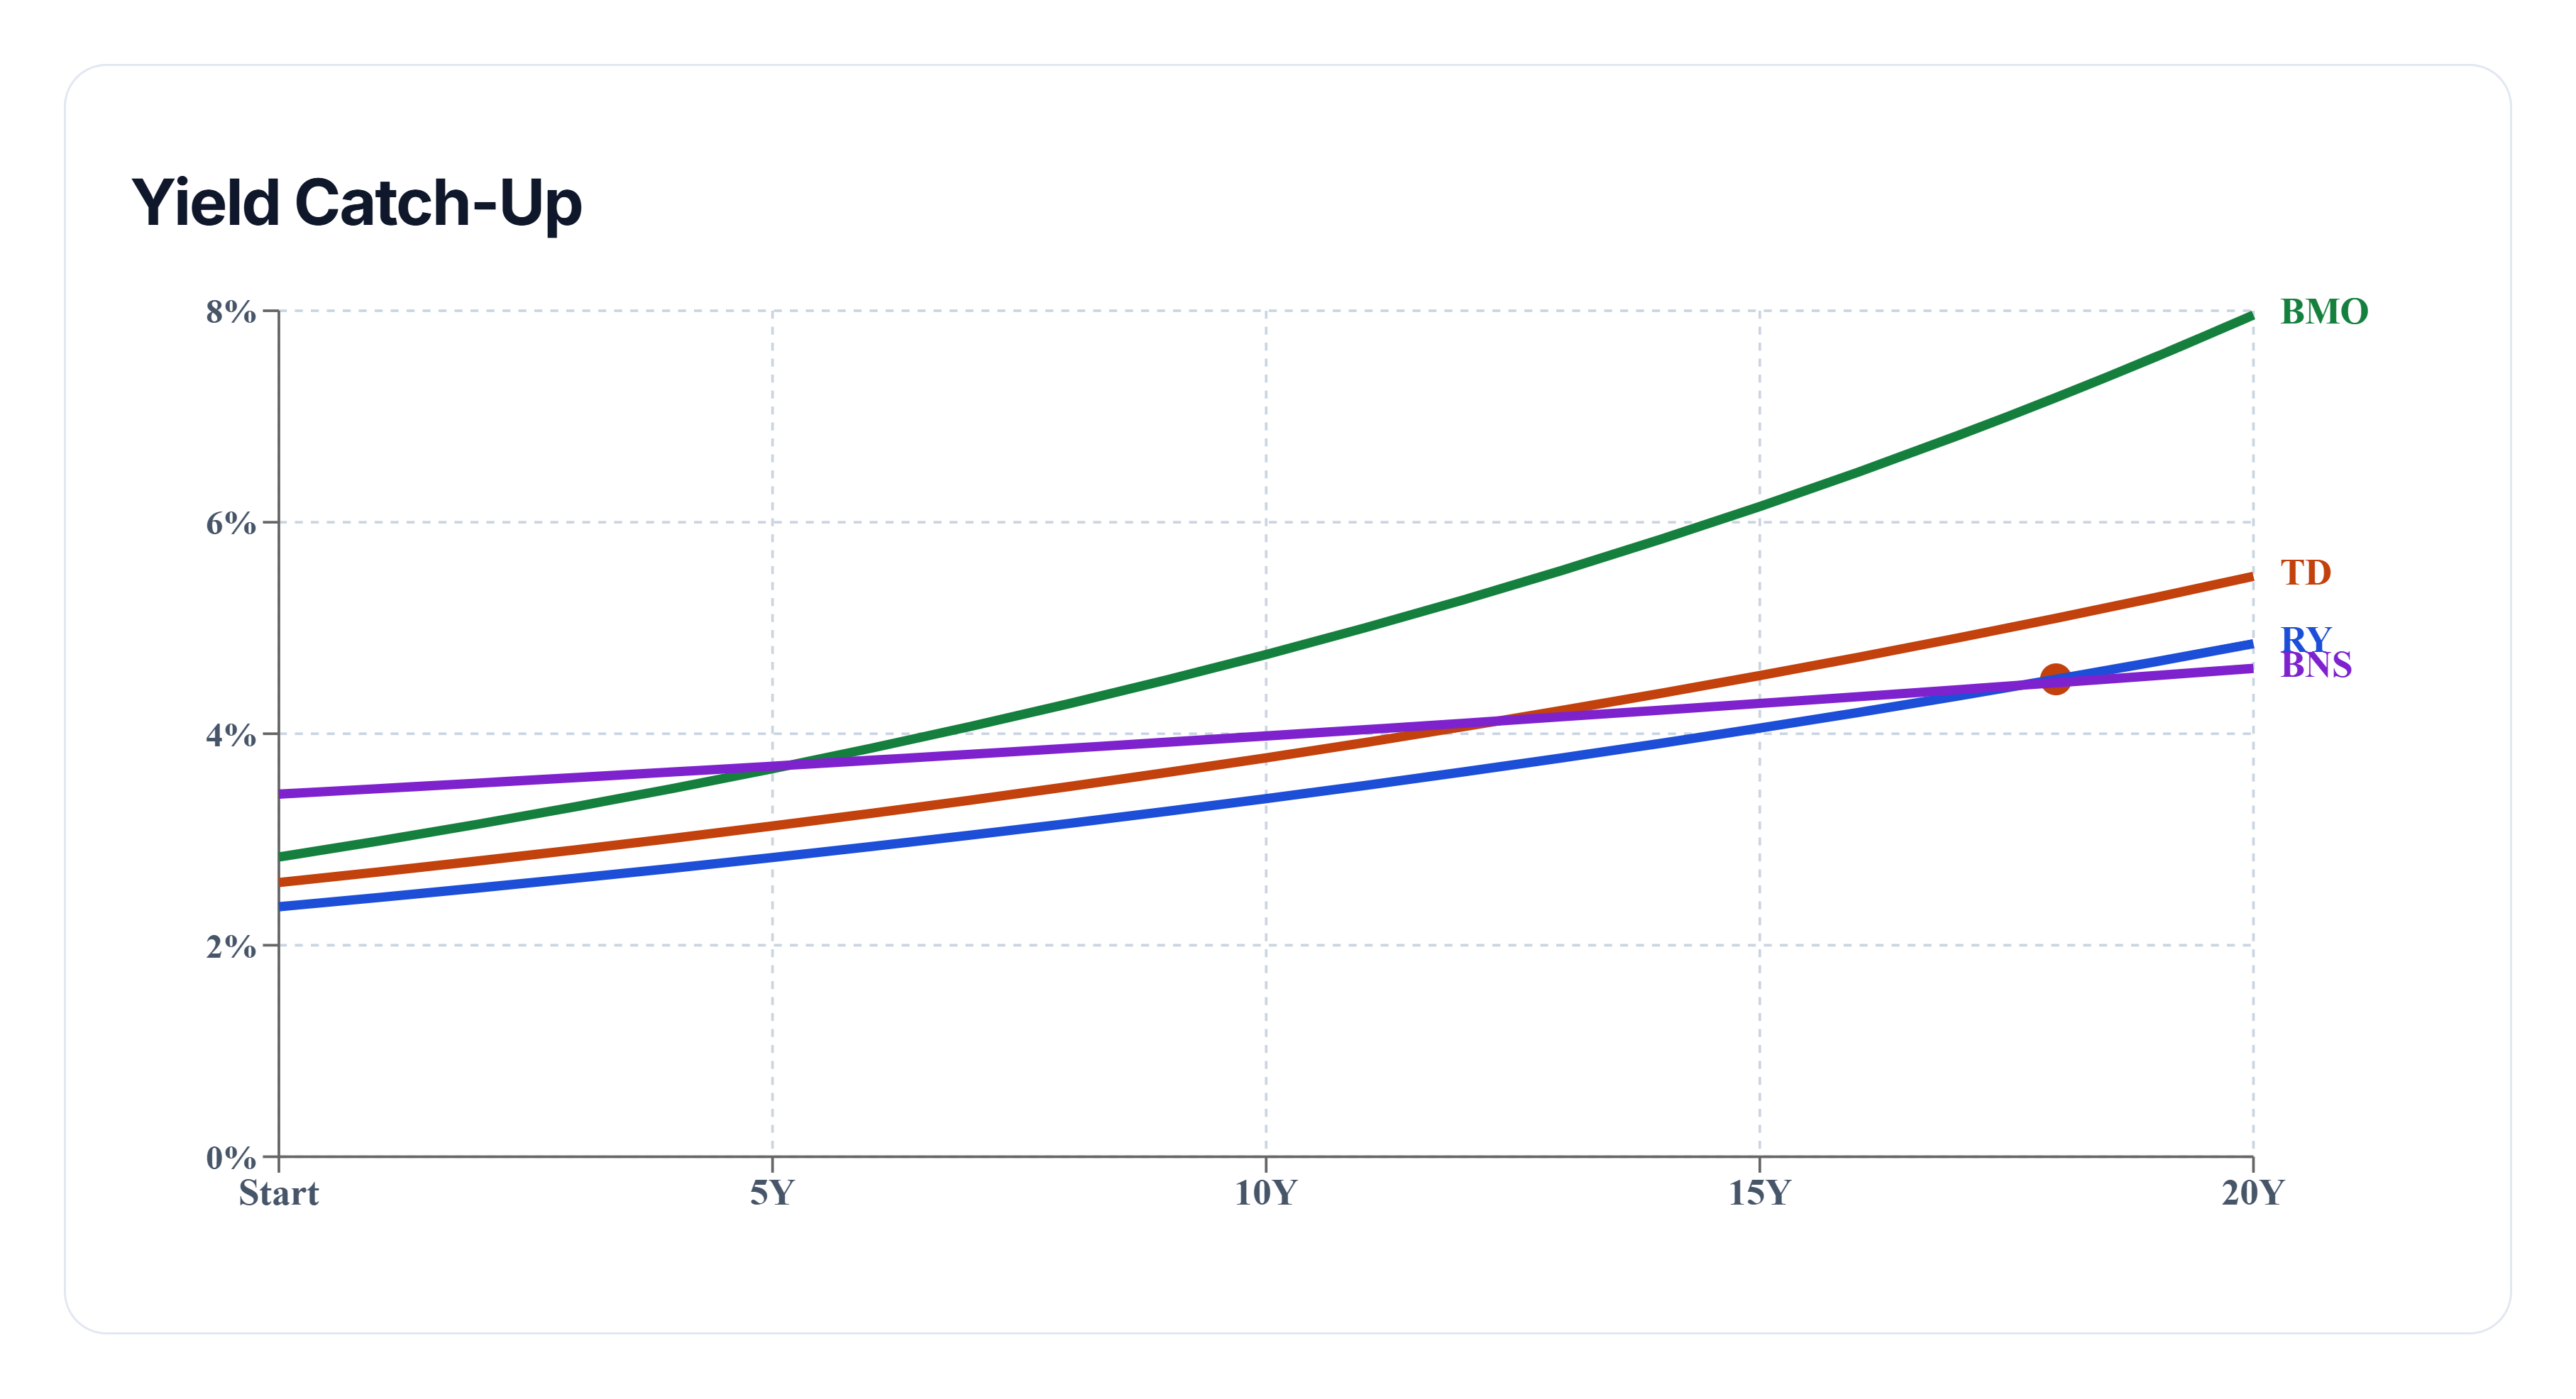
The final phase shifts from today's income picture to a forward-looking yield-on-cost projection.
The catch-up model assumes future dividend growth continues at a pace similar to each holding's historical five-year dividend CAGR. It is a projection based on that assumption rather than a prediction of actual future dividend growth.
BMO enters the model with the strongest dividend growth rate near 5.3%, while BNS starts with the highest current yield near 3.4%. RY begins near 2.4%.
As those different starting yields and modeled growth rates compound, the income relationships can change over time. Under this model, RY passes BNS around year 18 on projected yield on cost.
The timeline demonstrates the tension between starting yield and dividend growth. A higher yield provides more income efficiency initially, while sustained dividend growth can gradually narrow — and potentially overcome — that initial advantage.
Final Takeaway
There is no single metric that captures the full picture of these four Canadian banks.
Over the five-year historical window, BMO leads dividend growth with a 5.3% CAGR and shows the strongest yield-on-cost improvement, while RY leads price return at 102.49%. BNS, meanwhile, finishes the historical period with yield on cost around 4.99%.
Today's income comparison presents another perspective. With a $1,000 monthly after-tax income target and a 15.0% tax assumption, BNS requires roughly $411,810 at a yield near 3.4%, compared with approximately $597,424 for RY at a yield near 2.4%.
The projection then shows how those relationships could evolve if historical dividend-growth rates continued, including RY passing BNS around year 18 on projected yield on cost.
Together, the three phases — historical performance, today's income requirements, and projected income growth — illustrate the tradeoff between starting yield, dividend growth, and long-term income efficiency.
The projections are hypothetical and depend on historical growth rates continuing. Actual future dividends, yields, exchange rates, and returns may differ.
This analysis is for educational purposes only and does not constitute financial advice.