AAPL vs MSFT vs NVDA vs CSCO: Dividend Growth, Income & Yield on Cost

Portfolio Overview
In this DividendXray battle, we compare four major technology stocks across dividend growth, yield-on-cost expansion, and price return performance over a ten-year period.
- AAPL combines a massive consumer ecosystem with a steadily growing dividend.
- MSFT pairs strong dividend growth with a long history of consistent increases.
- NVDA is primarily a high-growth semiconductor company, with a small but growing dividend.
- CSCO offers a more mature technology profile, with a stronger emphasis on current dividend income.
These companies occupy different positions within the technology sector, creating an interesting comparison between dividend growth, current income, and capital appreciation.
Category Winners
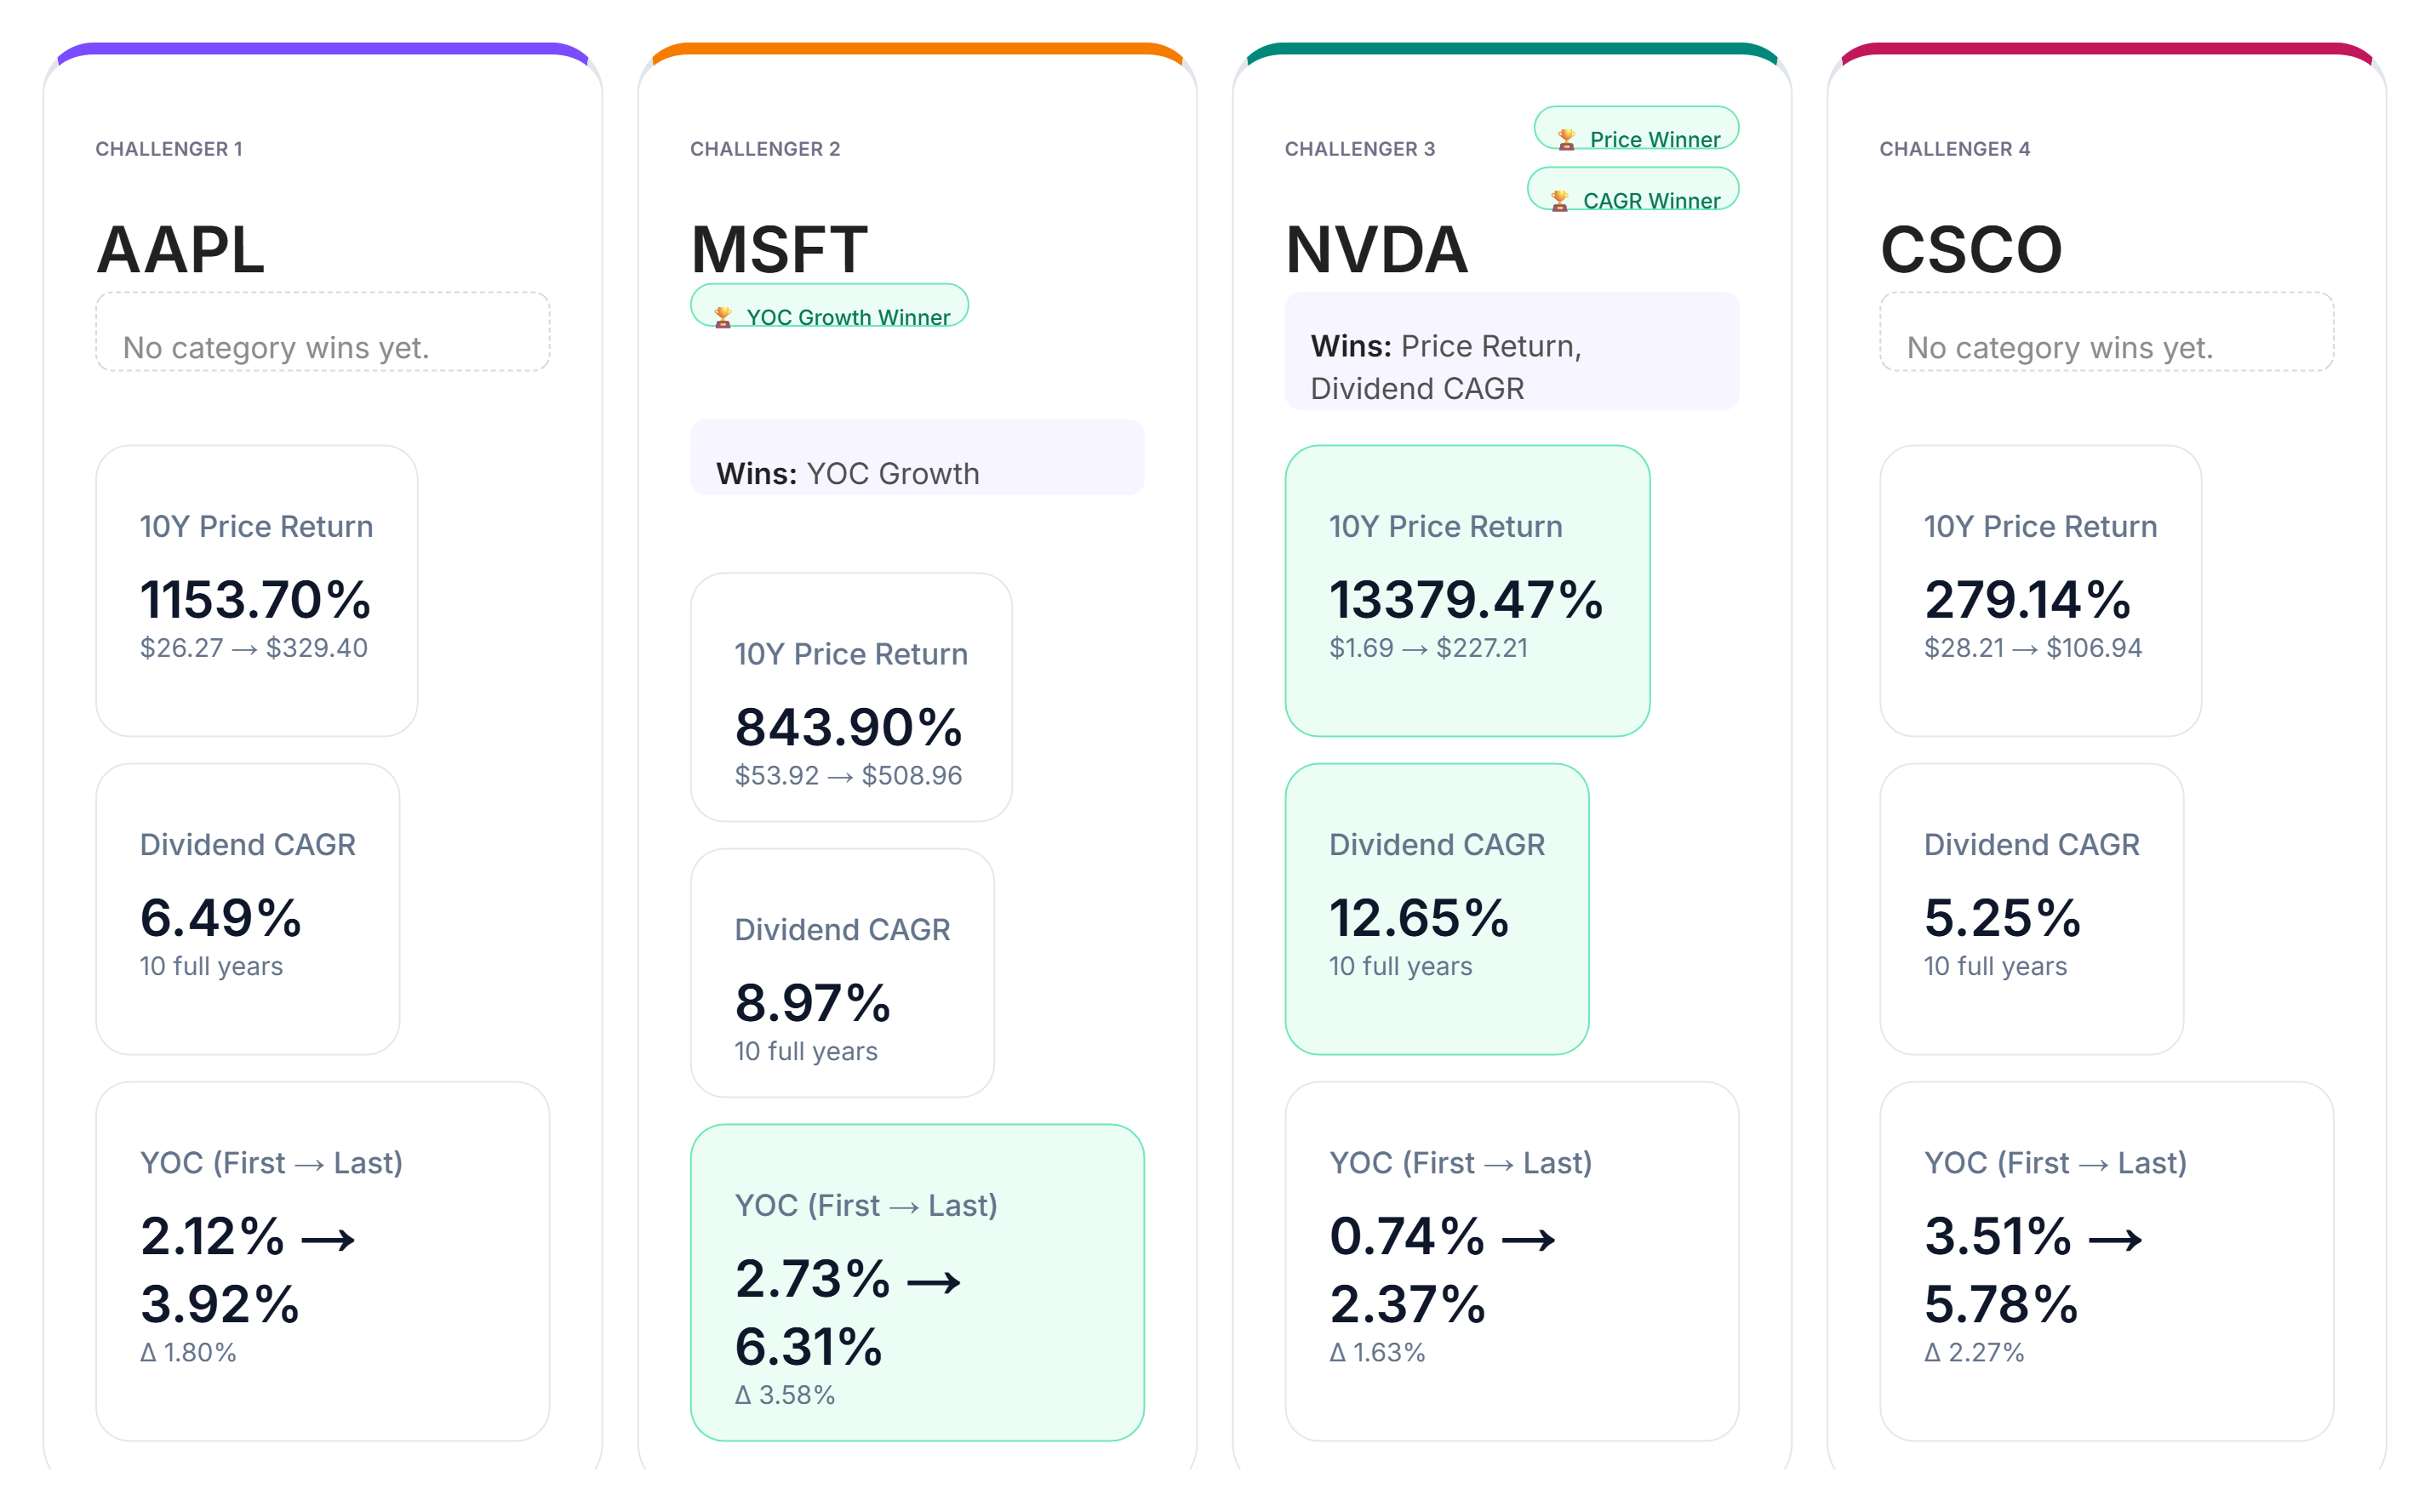
Looking across dividend CAGR, yield-on-cost growth, and price return, two stocks emerge as the category leaders.
In dividend growth, NVDA leads the group with a ten-year dividend CAGR of 12.65%.
For yield-on-cost growth, MSFT shows the strongest improvement from the first year to the last, demonstrating how dividend growth can increase income relative to the original investment over time.
In price return, NVDA is the clear standout, with a ten-year return of 13,379.47%.
AAPL and CSCO deliver solid results across the comparison but do not take a category win in this battle.
The results also demonstrate that dividend performance and price appreciation do not necessarily tell the same story. A stock can begin with a relatively small dividend while delivering strong dividend growth or substantial price appreciation over a long holding period.
Yield-on-Cost by Year
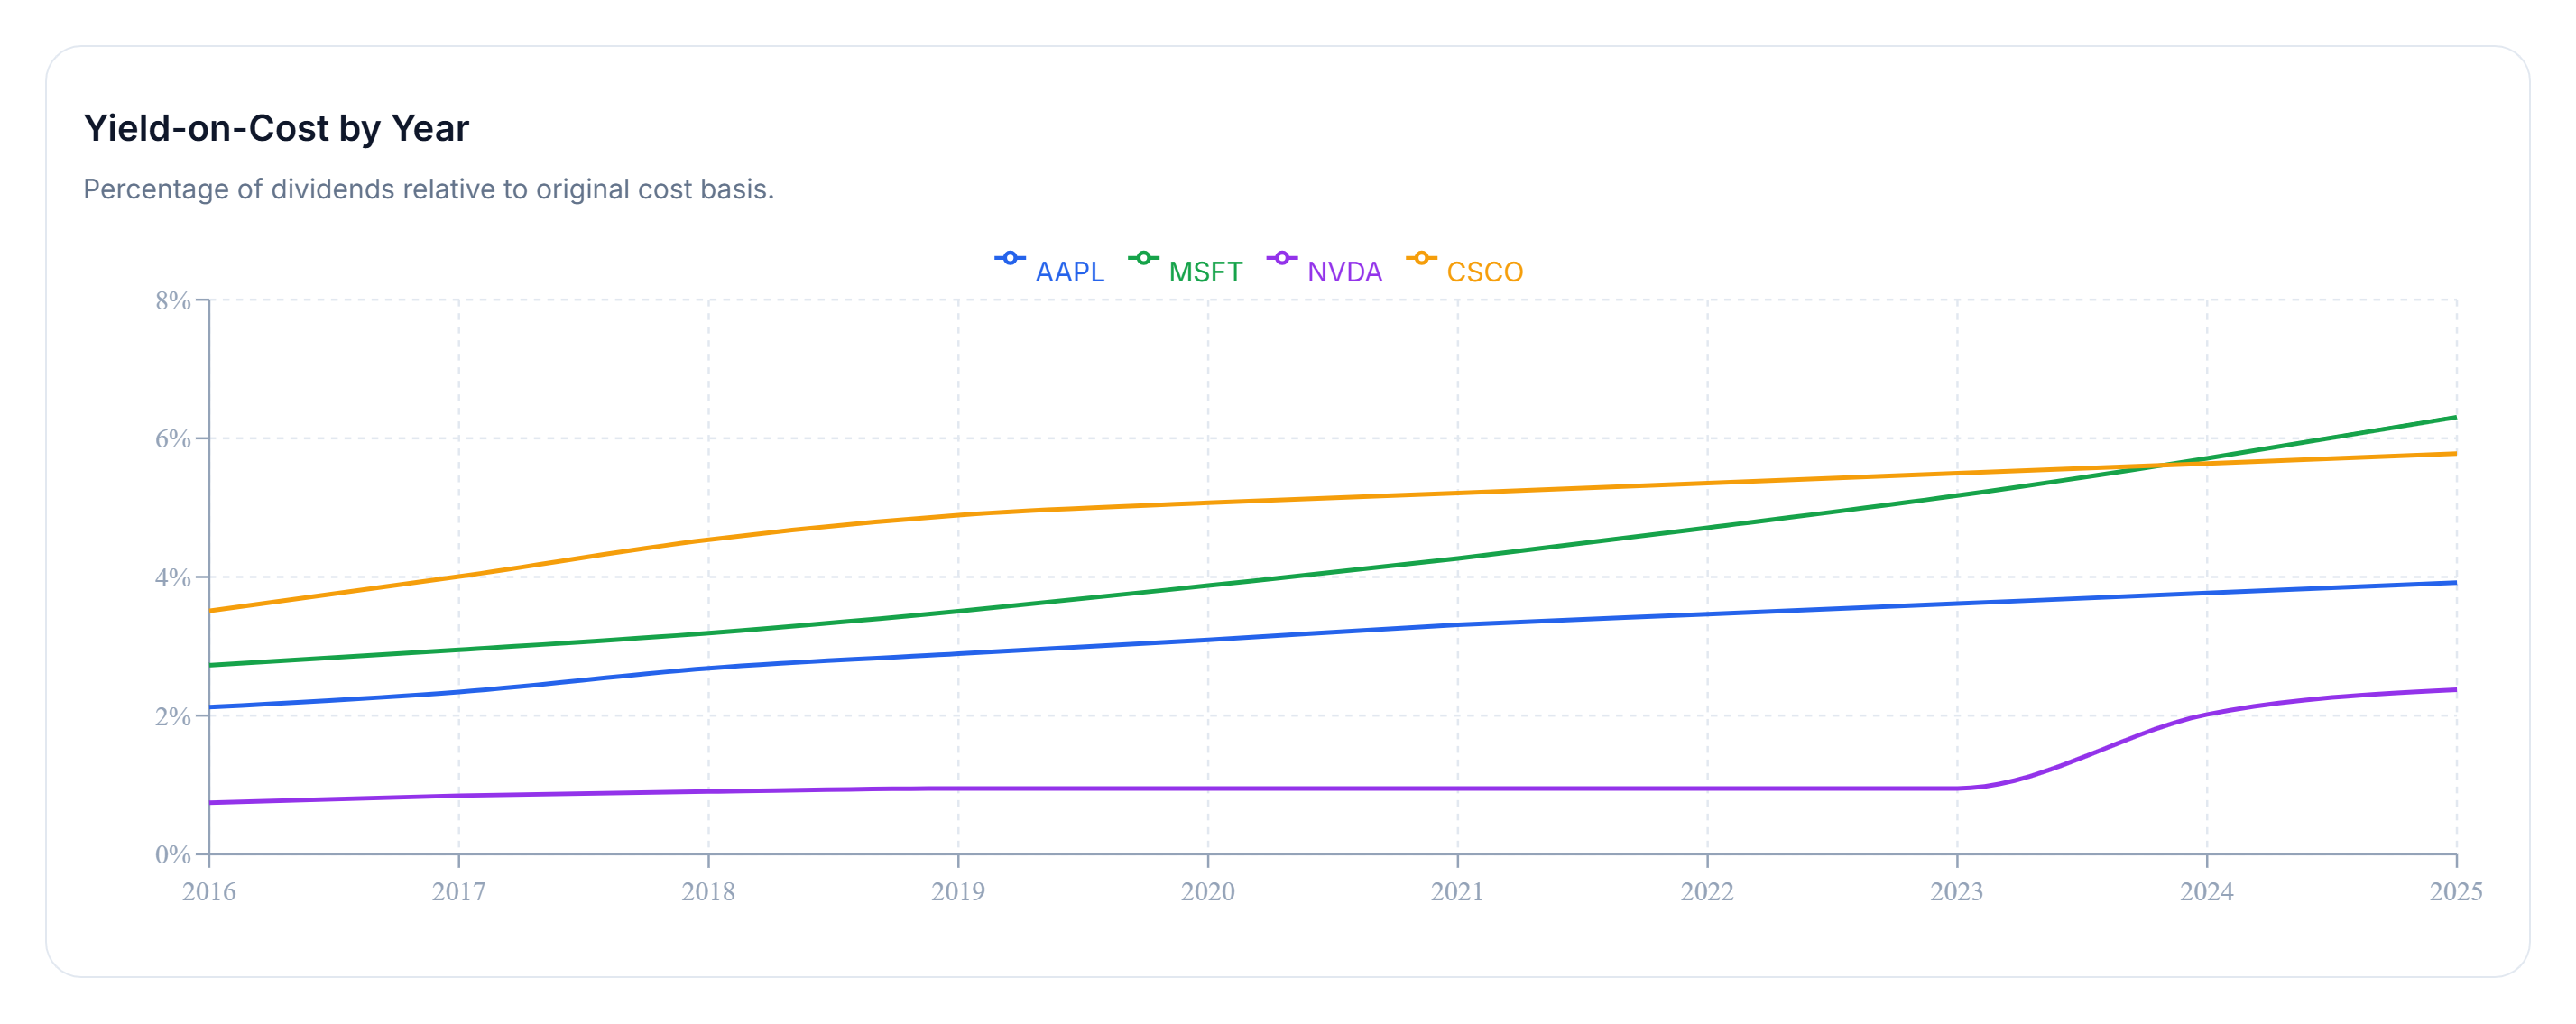
Yield on cost measures dividend income relative to the original capital invested rather than the stock's current market price. It provides another way to see how an investment's income production changes over time.
Across the ten-year window, MSFT stands out with the strongest income efficiency, reaching approximately 6.31% yield on cost by the end of the period.
The other holdings grow more gradually, but all show upward income trends across the same ten-year window.
This distinction is particularly useful when comparing technology stocks with very different starting yields. Current yield provides a snapshot of income today, while yield on cost illustrates how dividend growth can change the income generated from the original investment over time.
Now let's shift from past performance to today's income picture.
Income Goal Comparison
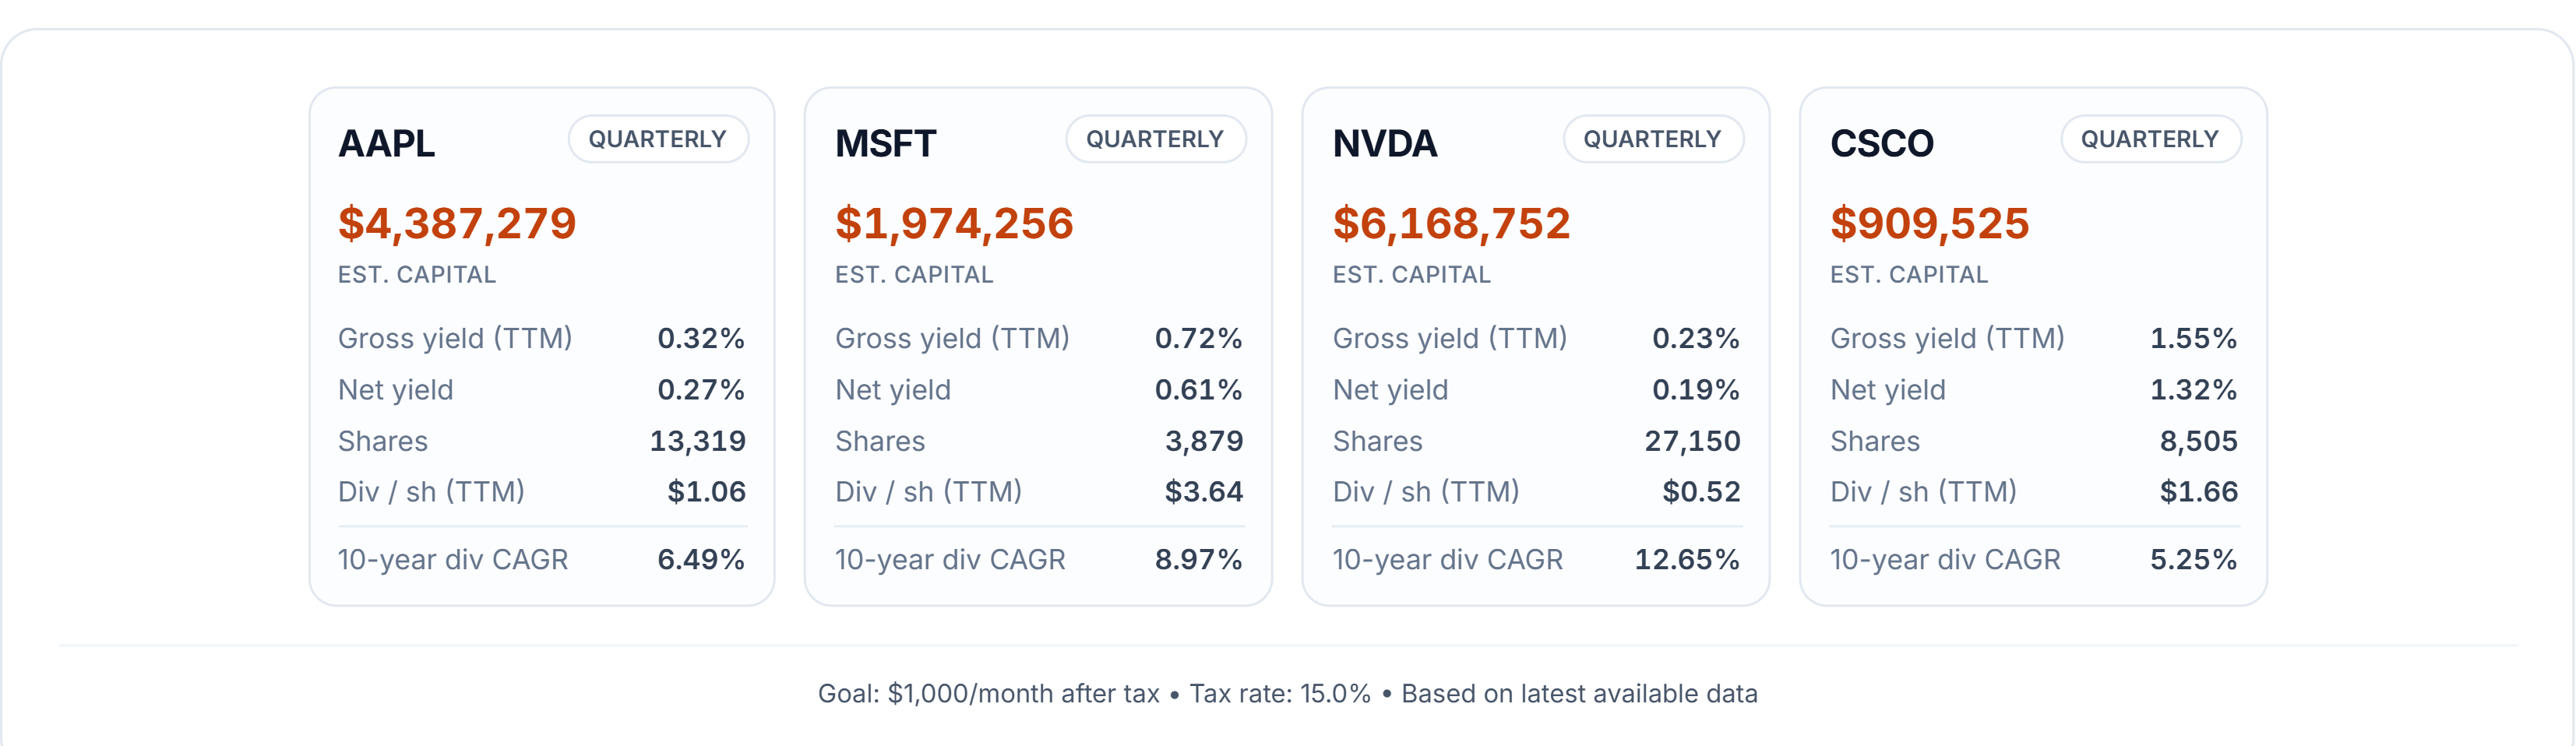
How much capital would each stock require to generate $1,000 per month in after-tax dividend income today?
Using a 15% tax assumption, CSCO requires the least capital at roughly $909,525, based on a current yield near 1.6%.
At the opposite extreme, NVDA requires approximately $6.17 million, with a current yield of only about 0.2%.
CSCO therefore begins with the highest yield of the four stocks, while NVDA starts with the lowest. AAPL and MSFT sit between those two extremes, balancing current yield with dividend growth.
This comparison illustrates an important distinction between current income and dividend growth. A higher starting yield can dramatically reduce the amount of capital needed to reach an income target today, while a lower-yielding stock may depend much more heavily on future dividend growth to improve its income efficiency.
The income comparison cards make that difference visible by placing each stock against the same $1,000 monthly after-tax income target.
Yield Catch-Up Timeline
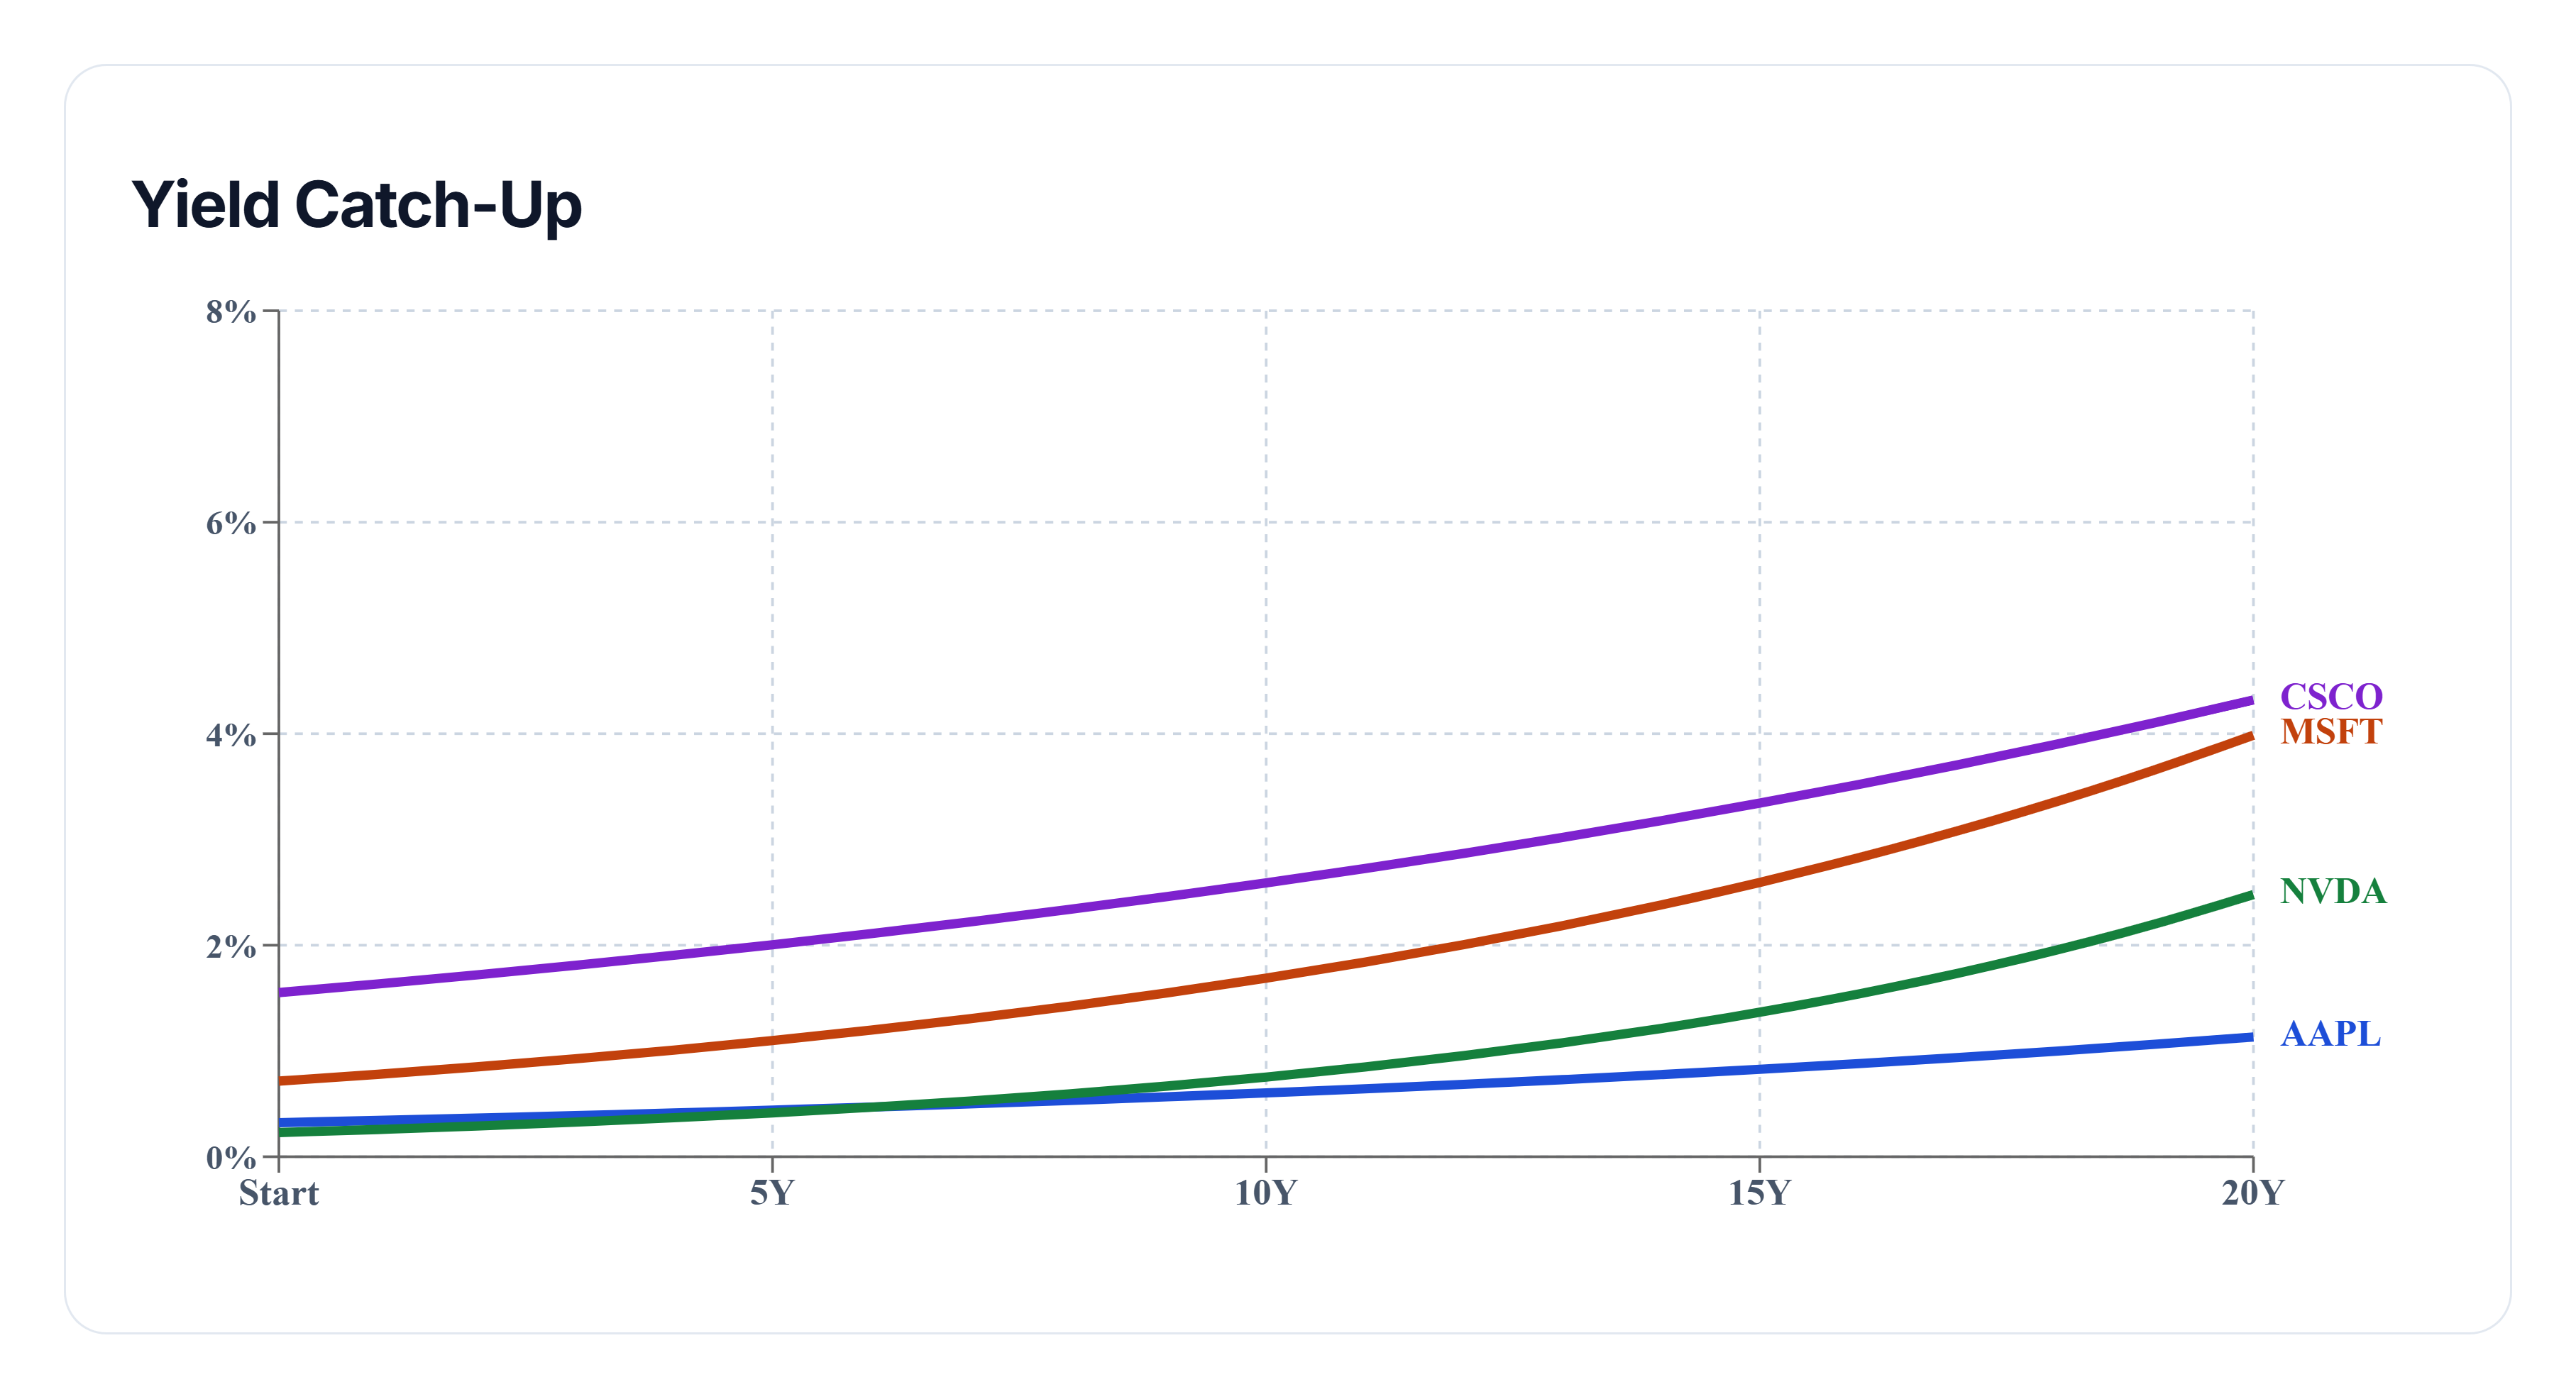
The final phase looks forward rather than backward.
This projection assumes future dividend growth continues at a pace similar to each holding's historical ten-year dividend CAGR. It is a modeled scenario based on historical growth rates, not a prediction of future dividend payments.
NVDA enters the projection with the strongest modeled dividend growth rate at approximately 12.7%, but it also begins with the lowest current yield at roughly 0.2%.
CSCO starts from the opposite position, with the highest current yield of the group at approximately 1.6%.
The catch-up timeline illustrates the tension between those two variables: starting yield and dividend growth. A lower starting yield creates a larger income gap to overcome, while faster dividend growth can potentially narrow that gap as the years pass.
Rather than treating the projection as a forecast, it is more useful as a way to visualize how different combinations of starting yield and dividend growth can affect future yield on cost.
Final Takeaway
This battle highlights how differently four major technology stocks can behave from an income investor's perspective.
Historically, NVDA leads dividend growth with a 12.65% ten-year CAGR and price return with a 13,379.47% ten-year return, while MSFT shows the strongest yield-on-cost improvement, reaching approximately 6.31% by the end of the period.
Today's income comparison tells a different story. CSCO's roughly 1.6% yield requires about $909,525 to target $1,000 per month after tax under the assumptions used here, while NVDA's roughly 0.2% yield requires about $6.17 million.
The forward-looking projection then adds another dimension: NVDA's stronger historical dividend growth rate gives it a faster modeled growth trajectory, but it begins from a substantially lower yield than CSCO.
Together, the three phases — historical performance, today's income requirements, and projected yield-on-cost growth — show why starting yield, dividend growth, and price appreciation need to be evaluated separately. Each tells a different part of the investment story.