VYM vs HDV vs DVY vs SPYD: Which Dividend ETF Reaches $1,000/Month Faster?

Introduction
How much capital do you need to generate $1,000 per month in dividend income after taxes? The answer depends on the ETF, the starting yield, and how quickly distributions grow over time.
In this breakdown, we compare VYM, HDV, DVY, and SPYD against the same after-tax income goal using the DividendXray income goal calculator. The objective is not simply to identify the highest yield, but to understand how different combinations of current income and dividend growth affect the capital required to reach the same monthly income target.
VYM provides broad high-dividend exposure across U.S. companies, HDV focuses more heavily on financially durable large-cap names, DVY leans toward higher-yield domestic dividend payers, and SPYD prioritizes current income through the highest-yielding stocks in the S&P 500.
Income Goal Comparison
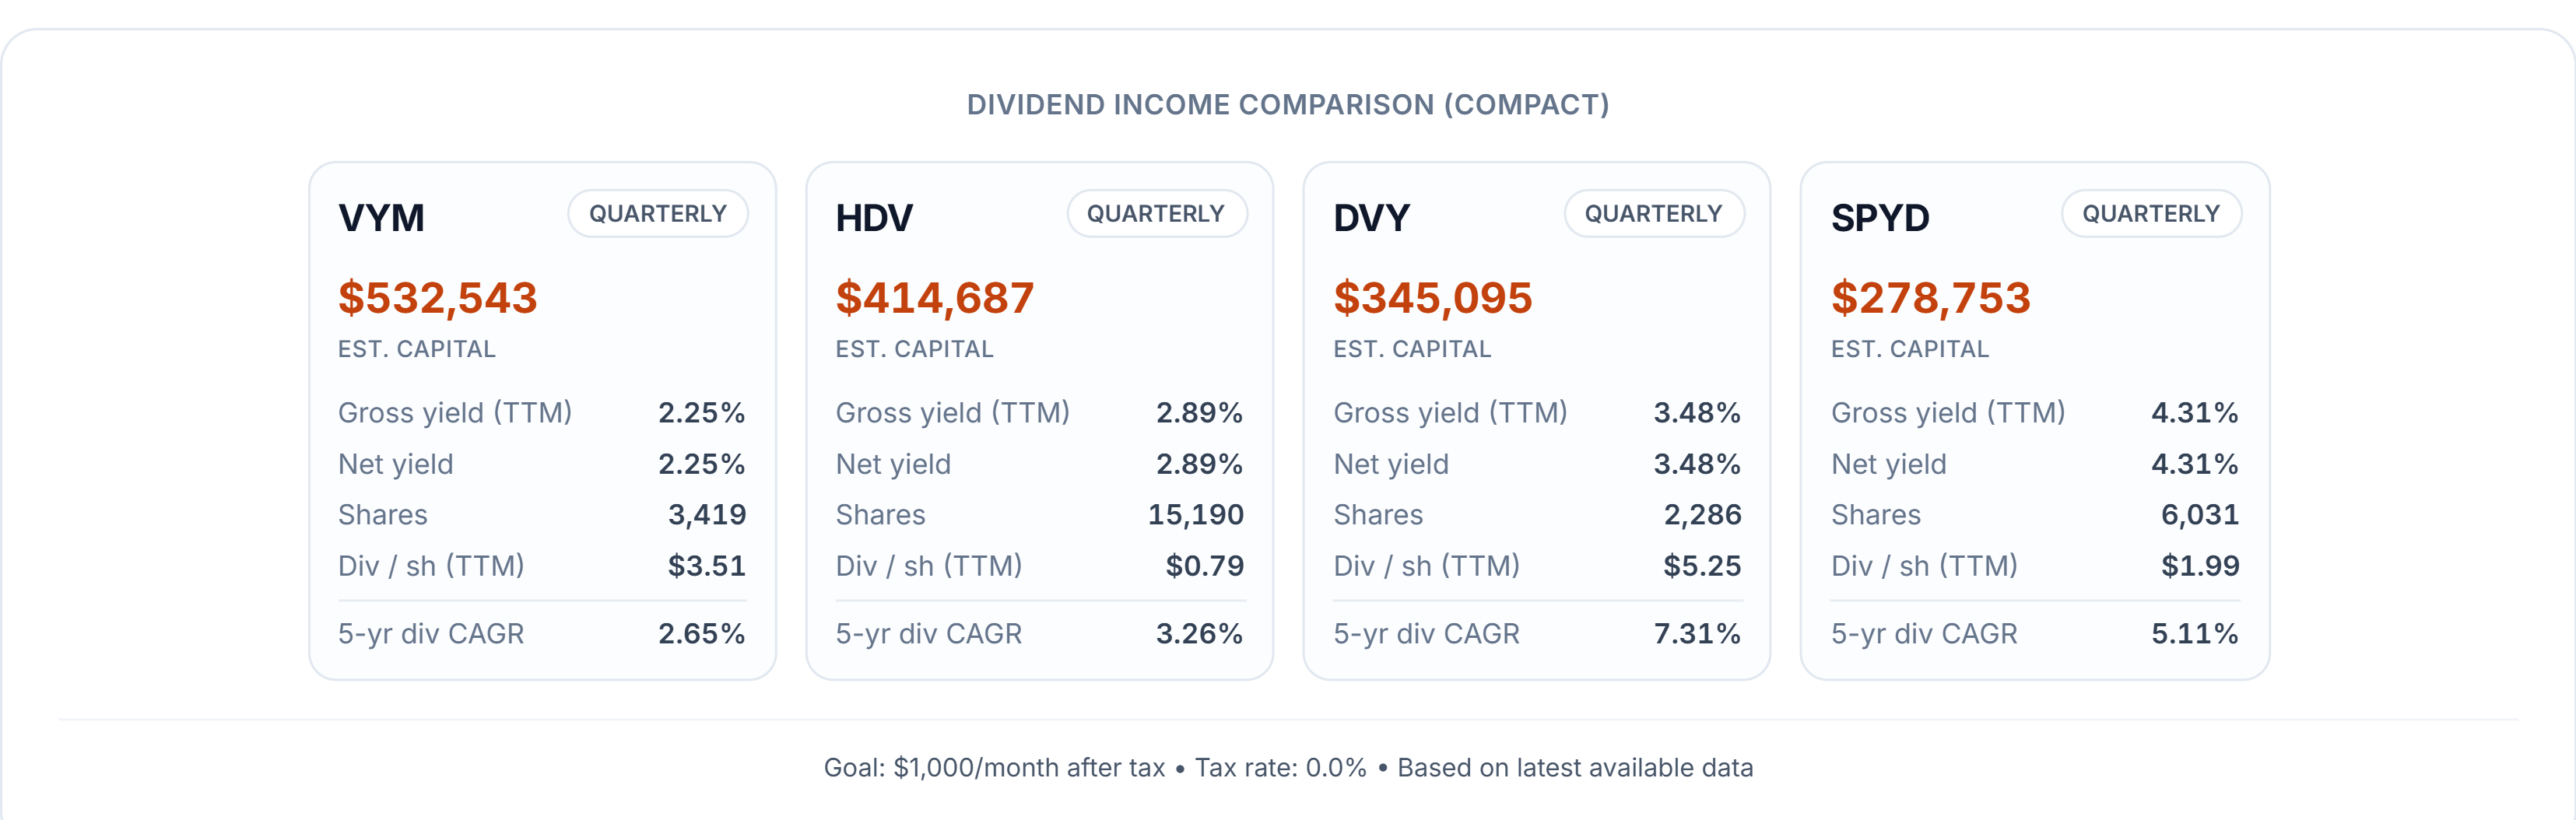
Here is a side-by-side comparison of how much capital each ETF would need to produce the same after-tax monthly income goal, based on current yield and tax assumptions.
For a $1,000/month after-tax target with a 0.0% tax assumption, SPYD currently requires the least capital at roughly $278,753, supported by a yield near 4.3%. VYM requires the most capital at approximately $532,543, reflecting its lower starting yield near 2.3%.
HDV and DVY sit more in the middle between current income and dividend growth potential. The comparison cards highlight the tradeoff clearly: some ETFs reach the income goal with less upfront capital today, while others may improve more gradually through long-term dividend growth.
Yield Catch-Up Timeline
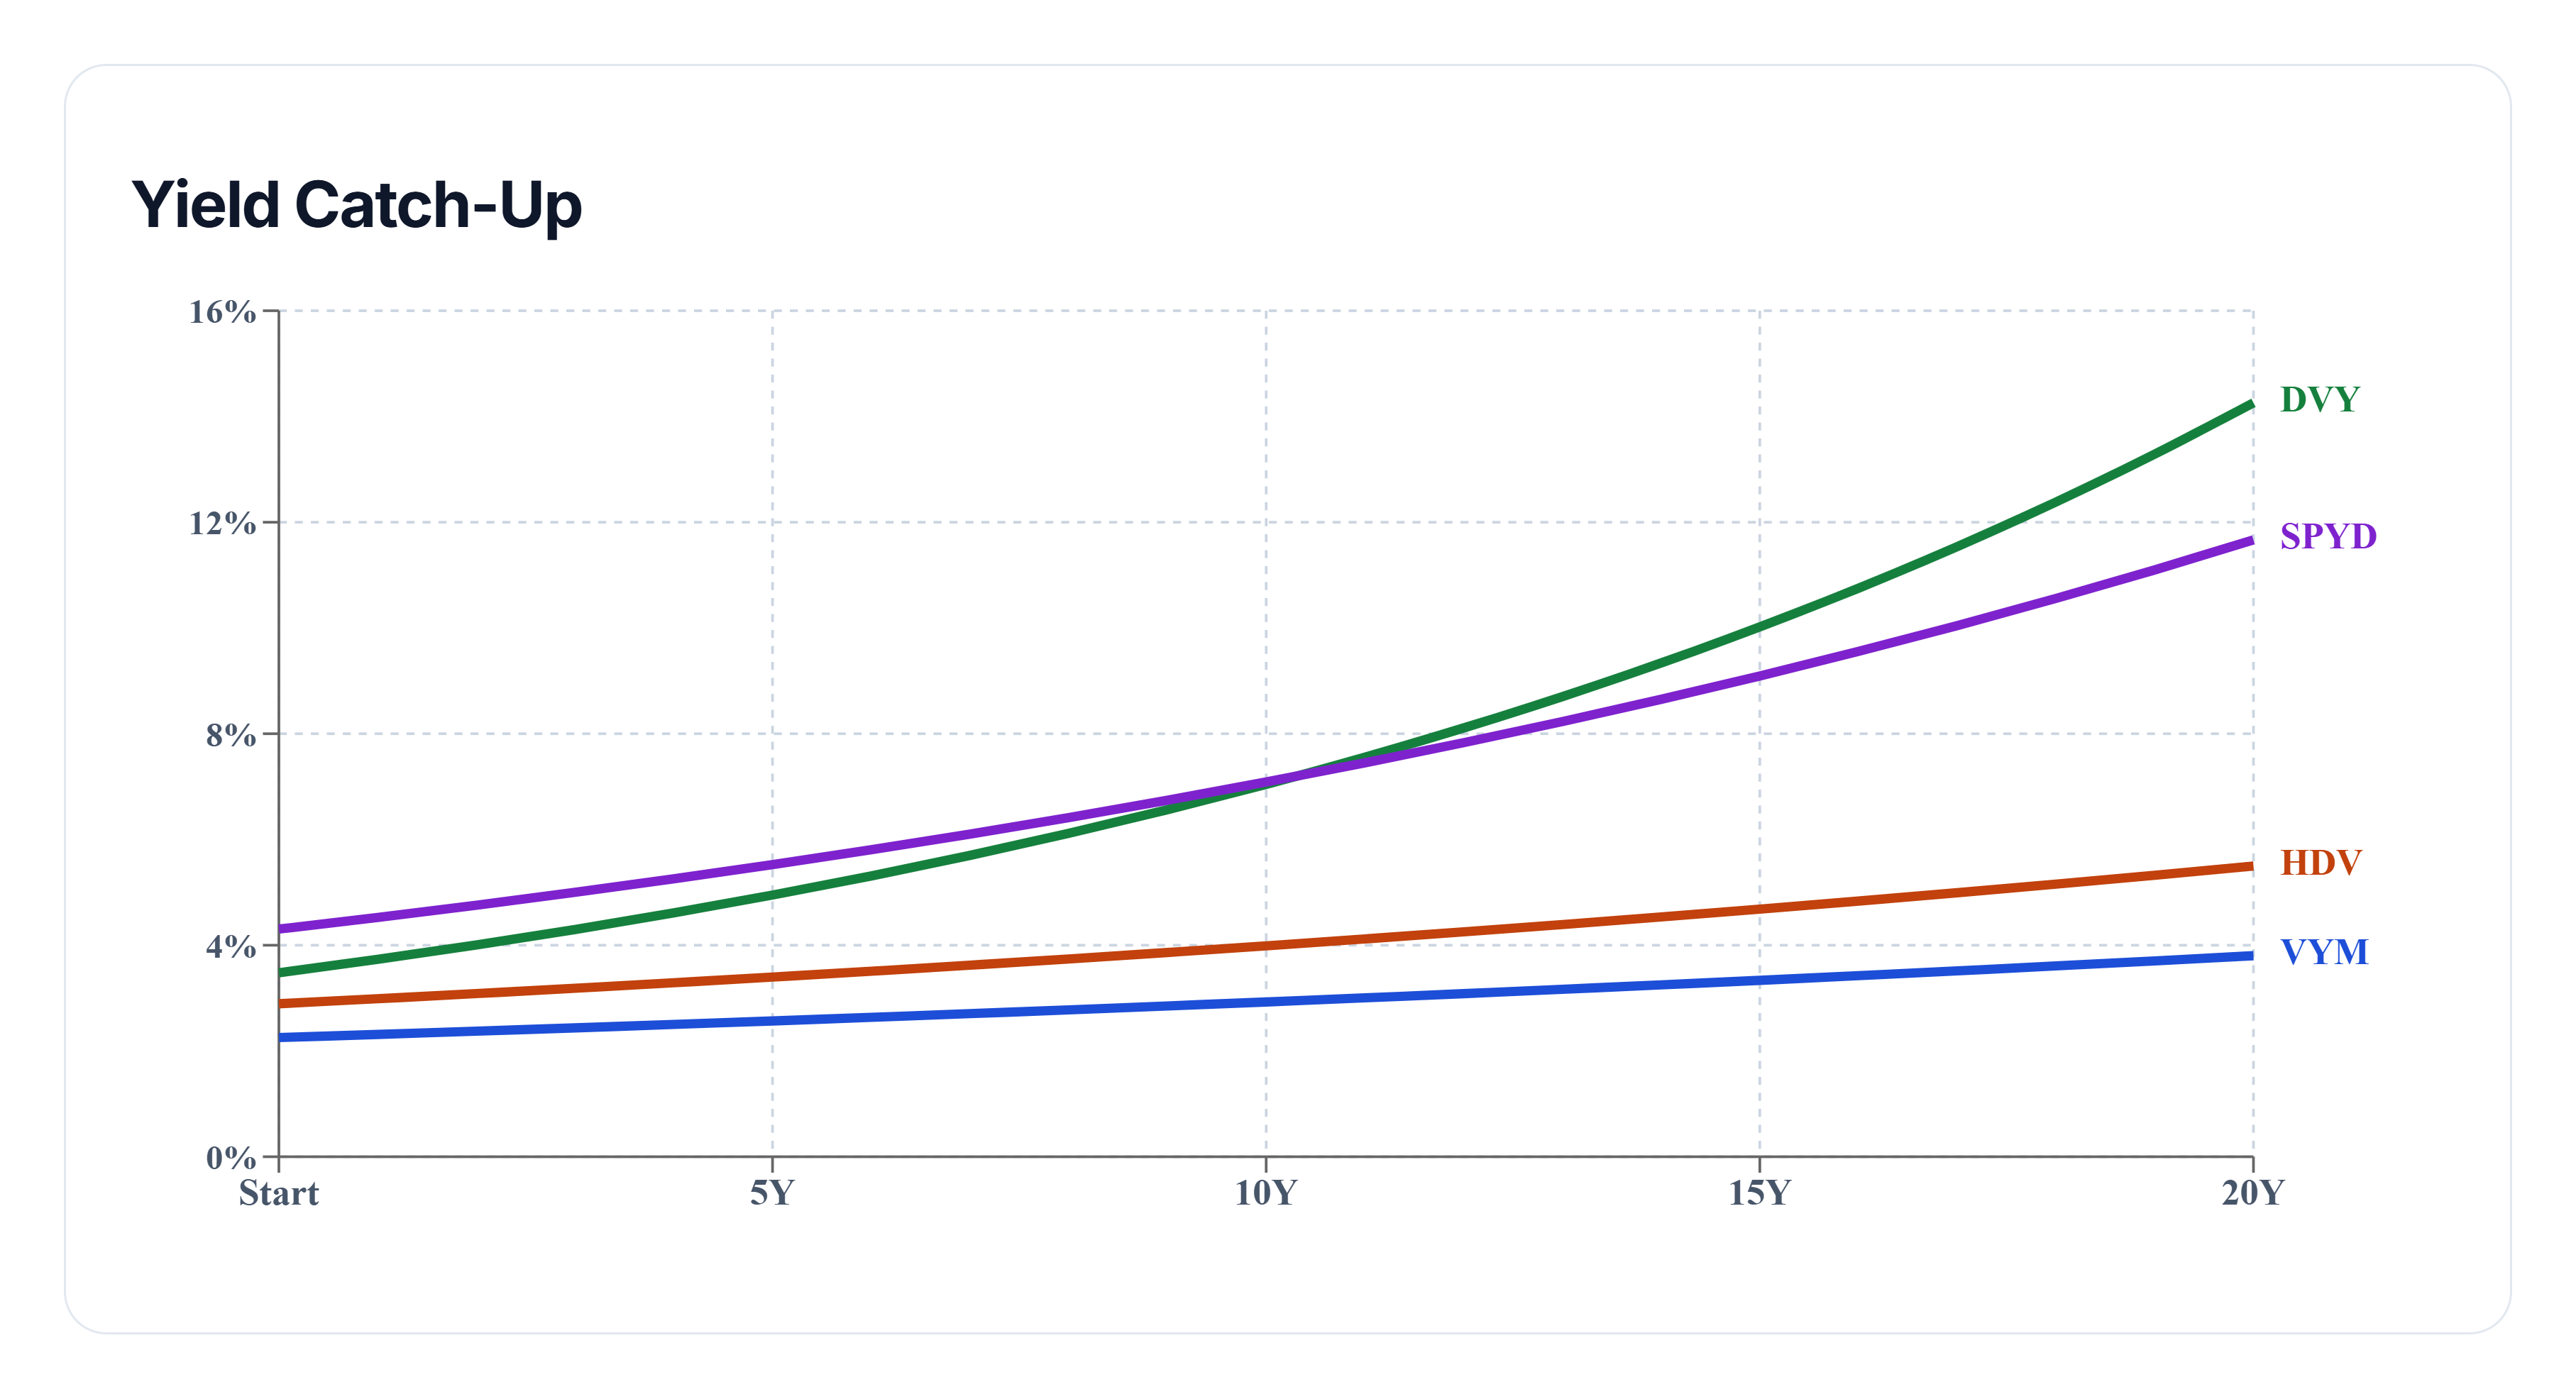
This chart shows how long it may take for lower-yield dividend ETFs to catch higher-yield alternatives on a yield-on-cost basis, assuming future dividend growth continues at a pace similar to the past five years.
DVY currently shows the strongest modeled dividend growth near 7.3%, while SPYD starts with the highest current yield near 4.3%. VYM begins lower near 2.3%, requiring more time for dividend growth to close the gap.
Even over a projected 20-year horizon, VYM still does not fully catch SPYD on projected yield-on-cost under these assumptions.
For investors building toward a specific monthly income target, the timeline illustrates an important distinction: higher starting yield may dominate immediately, while stronger dividend growth can improve long-term income efficiency over time.
Final Takeaway
There is no single “best” ETF for generating $1,000 per month in dividend income. The right choice depends on whether you prioritize lower upfront capital requirements, higher current income, or stronger long-term dividend growth potential.
SPYD currently offers the strongest starting yield in this comparison, while DVY demonstrates the fastest modeled dividend growth. VYM provides broader diversification with a lower starting yield, and HDV attempts to balance higher income with quality-focused large-cap exposure.
Use the income comparison cards to evaluate how much capital is required today, and use the catch-up timeline to understand how dividend growth may reshape income efficiency over the long term.