SCHD vs ARCC vs JEPI vs O — Dividend Income Battle
Portfolio Overview
In this DividendXray battle, we compare four income-focused holdings across dividend growth, yield-on-cost expansion, and total return performance over a five-year period.
- SCHD emphasizes high-quality dividend payers with a focus on income stability and long-term dividend growth.
- ARCC is a business development company that generates income by lending to middle-market businesses, offering high yields tied to credit markets.
- JEPI uses an options-income strategy designed to produce high monthly distributions while maintaining relatively lower volatility.
- O (Realty Income) is a real estate investment trust known for reliable monthly dividends backed by long-term commercial property leases.
Each holding represents a different approach to generating income — from dividend growth to credit lending, options strategies, and real estate cash flow.
Category Winners
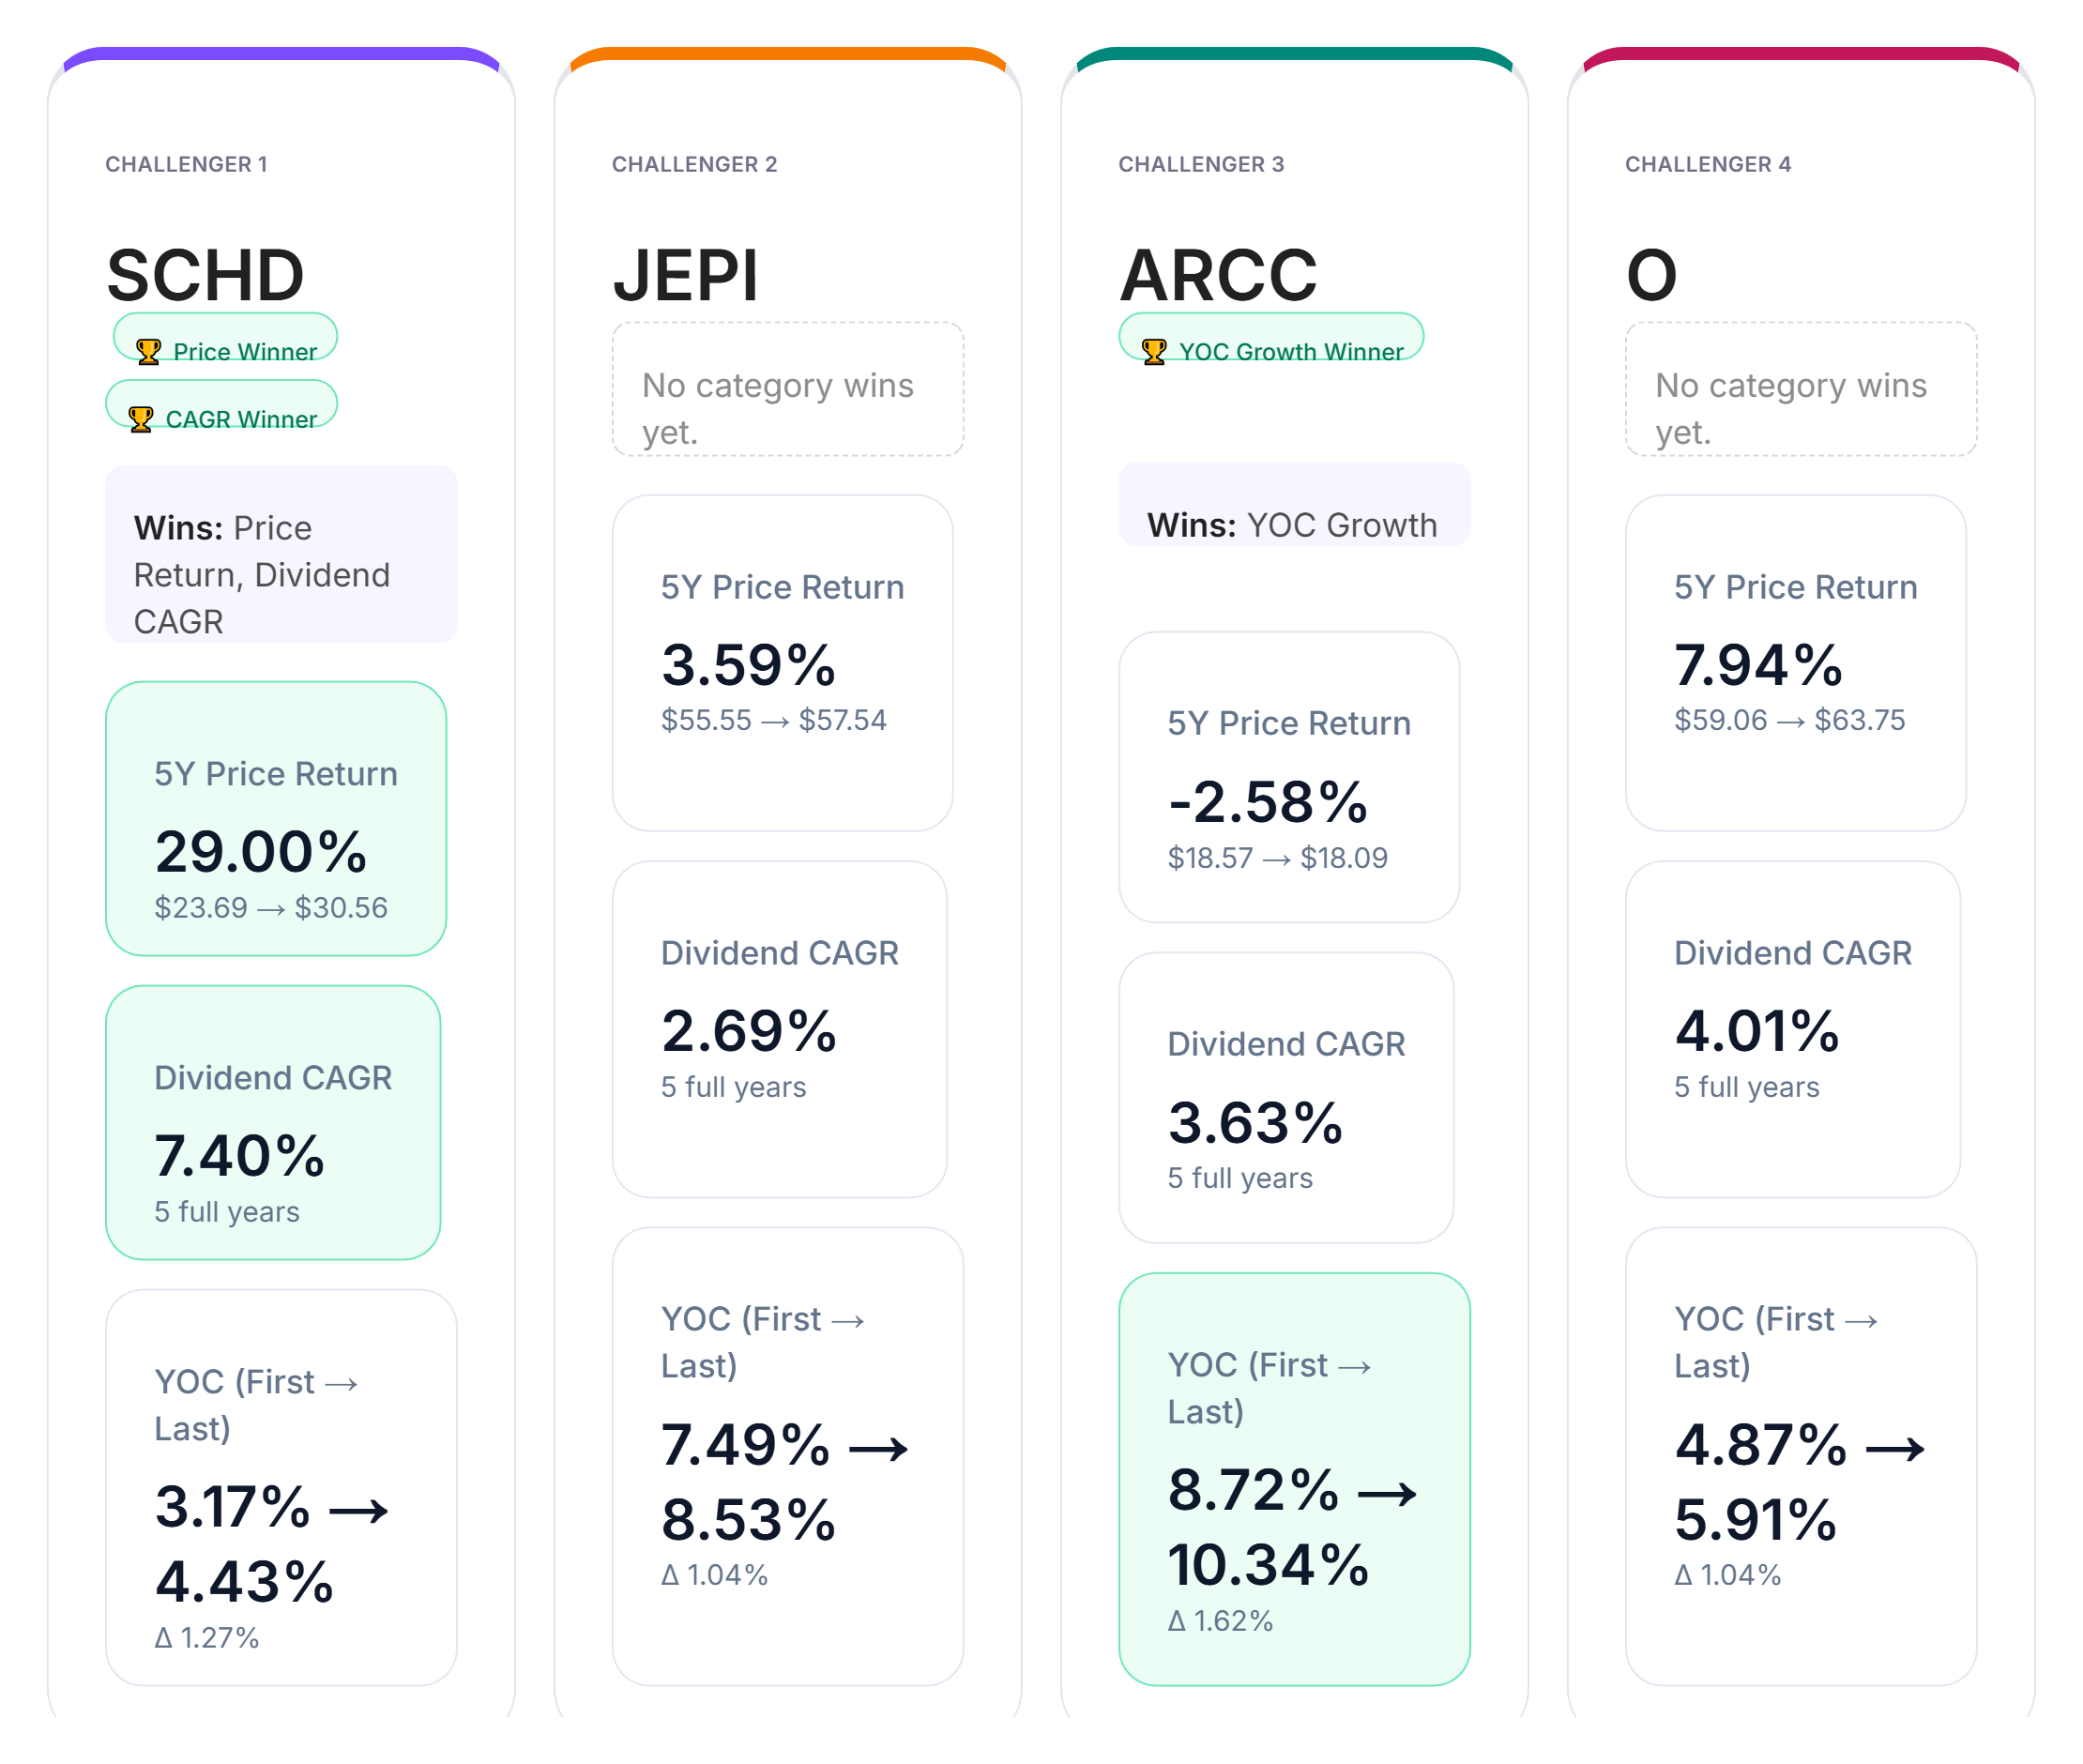
Looking at the data across dividend CAGR, yield-on-cost growth, and price return, clear category leaders emerge.
In dividend growth, SCHD leads the group with a five-year dividend CAGR of 7.40%.
For yield-on-cost growth, ARCC shows the strongest improvement from first to last year, reflecting powerful income expansion relative to the original investment.
In price return, SCHD again comes out ahead with a five-year return of 29.00%, outperforming the other holdings in total appreciation.
JEPI and Realty Income deliver steady income performance across the period, but neither secures a category win in this particular comparison.
The results highlight how different income strategies — dividend growth, lending income, options premiums, and real estate cash flow — shape portfolio outcomes over time.
Yield-on-Cost by Year
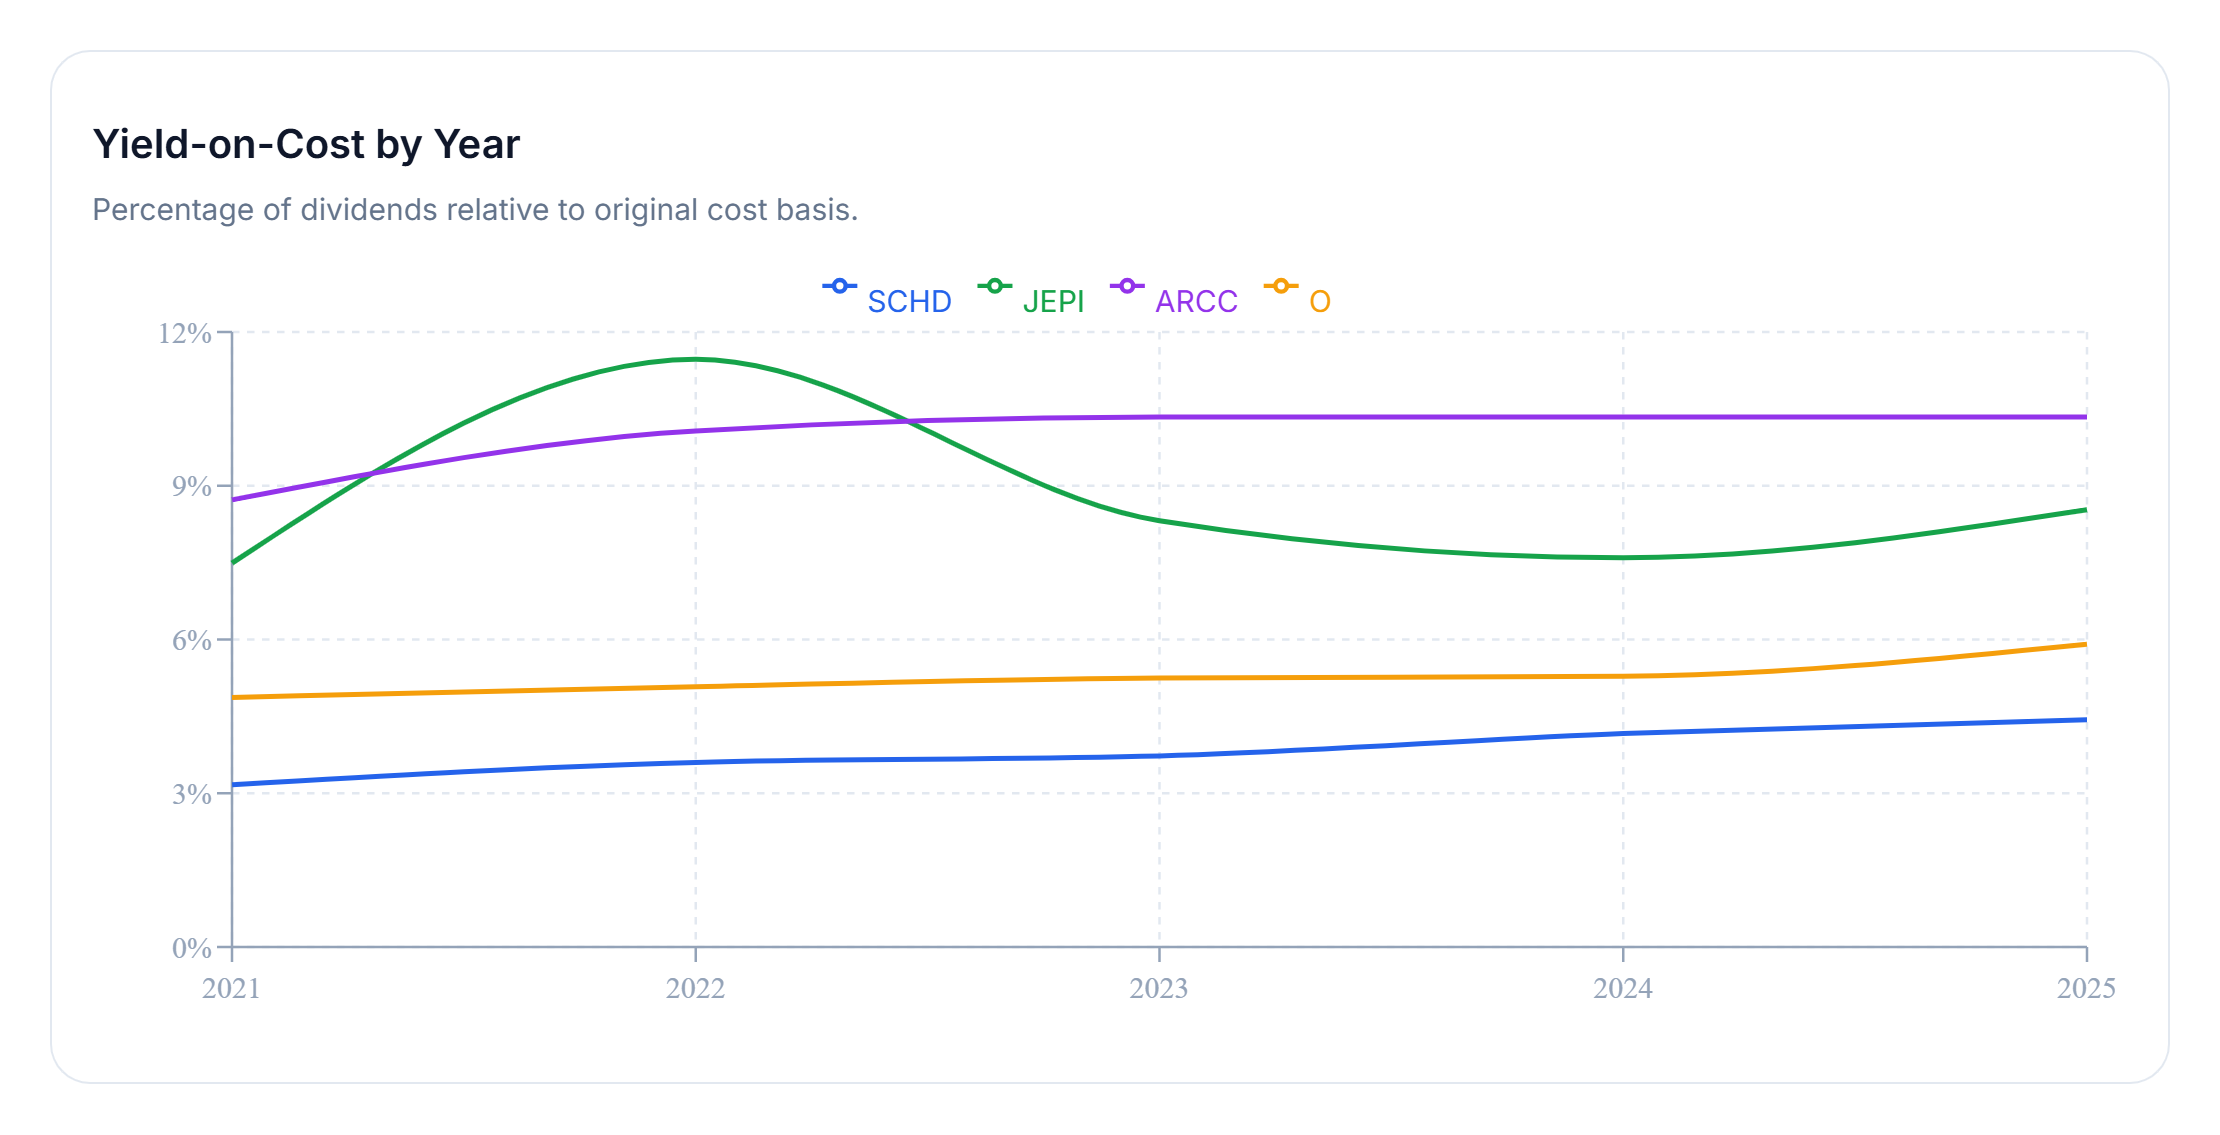
Yield-on-cost measures dividend income relative to the original capital invested. Unlike current yield, it shows how efficiently a holding grows income over time.
Over the five-year window, ARCC stands out with the strongest income efficiency, reaching approximately 10.34% yield on cost by the end of the period.
The other holdings show more gradual income expansion. SCHD demonstrates steady dividend growth, while JEPI and Realty Income maintain stable income generation across the same time frame.
While differences may appear modest year to year, compounding effects become increasingly visible across longer investment horizons.
For income-focused investors, understanding how dividend income evolves over time can be just as important as the starting yield.
Final Takeaway
There is no single "perfect" income investment. Each holding reflects a different balance between dividend growth, income yield, and total return.
This battle shows SCHD leading in both dividend growth and price appreciation, while ARCC demonstrates exceptional income efficiency through strong yield-on-cost expansion.
JEPI and Realty Income provide steady income profiles that many investors value for diversification and consistent distributions.
Ultimately, the best choice depends on whether your goal is maximizing present income, accelerating long-term dividend growth, or balancing multiple income strategies within a diversified portfolio.